TECHNOLOGY EXPLAINER
Bandgap and Composition Design
— “mix it and you can dial in any value”, and the wall that lies beyond
One of the strengths of perovskites is that simply changing the ratio of halides or metals shifts the absorption edge continuously. Yet it turned out that widening the bandgap by adding bromine lets the composition separate under nothing more than illumination. This article starts by calculating the theoretical optimum ourselves, then lays out, in materials terms, the “dials” of composition design and where they run out.
- What the bandgap is, in three points
- Our calculation: what is the theoretical optimum in eV?
- What sets the bandgap: the orbitals of lead and iodine
- Three dials of composition design: X, B and A
- A materials engineer's view (1): mix Sn and Pb and the gap narrows below both ends
- The wall on the wide side: halides that separate under light
- Our calculation: how much voltage does a 1.74 eV cell lose?
- A materials engineer's view (2): designing not just the composition but its ability to stay mixed
- The values tandems call for
- Strengths, weaknesses and open issues
- Glossary / References / Claim-to-source audit
Sourced = stated in published material or a peer-reviewed paper (link given)
Our calculation = a value this article derived from assumptions it states
Not yet confirmed = a plan or target with no confirmed track record
Structural readings and materials-design interpretations are marked separately as Commentary.
1. What the bandgap is, in three points
- What it decides: the long-wavelength limit of the light a semiconductor can absorb. Photons with less energy than the bandgap Eg (eV) are not absorbed. In wavelength terms, λ (nm) ≈ 1240 ÷ Eg (our commentary)
- Why there is an optimum: a narrower Eg collects more photons and so more current, but each photon yields less voltage. Shockley and Queisser derived the limiting efficiency under ideal conditions, allowing only radiative recombination, as a function of EgSourced
- What perovskites allow: through the halide ratio, the bandgap of MAPb(BrxI1−x)3 has been reported to vary continuously over 1.6 to 2.3 eV, and that of FA-based compositions over 1.48 to 2.23 eVSourced
A perovskite's bandgap is set by how it is mixed, but that mixture is not guaranteed to survive once light falls on it. Hoke and colleagues reported that when bromine-containing films were illuminated at around 1 sun, iodide-rich regions appeared in under a minute and the emission became pinned at 1.68 eVSourced. Composition design is two problems: making the target value, and keeping it (our commentary).
2. Our calculation: what is the theoretical optimum in eV?
We calculated the upper efficiency limit of an ideal single-junction solar cell from the standard solar spectrum. The spectrum is the ASTM G173-03 AM1.5G spectrum (global, on a 37° tilted surface) distributed by NLR (the National Laboratory of the Rockies, formerly the US National Renewable Energy Laboratory)Sourced.
- Assumption: every photon above Eg is absorbed and yields one electron (step-function absorption)
- Assumption: radiative recombination only (the ideal Shockley–Queisser condition). Cell temperature 25 °C (298.15 K). The dark current is taken from blackbody radiation at the same temperature
- Assumption: the incident light is the ASTM G173 AM1.5G spectrum (about 1,000 W/m² when integrated)
- Jsc is the integral of photons above Eg; the voltage is swept to find the maximum power point
Result: the limiting efficiency peaks at about 33.7% near Eg = 1.34 eVOur calculation. Shockley and Queisser's original 1961 paper treated the sun and the cell as blackbodies at 6000 K and 300 K and gave a maximum of 30% at 1.1 eVSourced. The values differ because this article uses a real spectrum that has passed through the atmosphere (AM1.5G).
Assumptions and limits: real cells add non-radiative recombination, reflection, parasitic absorption and resistive losses, and fall short of this value. Use it as a guide to which bandgap gives the highest ceiling.
| Eg (eV) | Absorption edge (nm) | Current ceiling Jsc (mA/cm²) | Efficiency limit | Link to the text |
|---|---|---|---|---|
| 1.25 | 992 | 37.6 | 33.1% | Sn–Pb mixtures (Section 5) |
| 1.34 | 925 | 35.0 | 33.7% | Optimum in our calculation |
| 1.48 | 838 | 29.7 | 32.4% | FAPbI3 (Eperon et al.) |
| 1.55 | 800 | 27.3 | 31.5% | Around MAPbI3 (Eperon et al., Hao et al.) |
| 1.74 | 713 | 21.4 | 28.4% | Top cell for Si tandems (McMeekin et al.) |
| 2.00 | 620 | 14.6 | 22.9% | Bromine-rich compositions |
Wavelengths, currents and efficiencies are all Our calculation (assumptions in the box above). The pairing of compositions and bandgaps in the right-hand column uses values reported in the papers [Refs. 5, 7 and 8].
3. What sets the bandgap: the orbitals of lead and iodine
From photoelectron spectroscopy and calculations, Umebayashi and colleagues reported that in CH3NH3PbI3 the top of the valence band consists mainly of σ-antibonding states of Pb 6s and I 5p, and the bottom of the conduction band mainly of σ-antibonding states of Pb 6p and I 5sSourced. In other words, the band edges are built by the B site (lead) and the X site (iodine); the organic cation on the A site does not contribute directly to them (our commentary).
4. Three dials of composition design: X, B and A
| Dial | What changes | Reported effect | Source |
|---|---|---|---|
| X (halide) | I to Br ratio | Continuous tuning over 1.6 to 2.3 eV in MAPb(BrxI1−x)3. More Br moves the absorption edge to shorter wavelengths | Hoke et al. |
| X (halide) | I to Br ratio in FA compositions | 1.48 to 2.23 eV in FA lead trihalides. A planar cell of 14.2% with 1.48 eV FAPbI3 | Eperon et al. |
| X (halide) | I to Br ratio in MA compositions | Colour changes covering almost the whole visible range. Cell efficiency of 12.3% | Noh et al. |
| B (metal) | Sn to Pb ratio | Does not follow a straight line between the end members (MAPbI3 1.55 eV, MASnI3 1.35 eV); mixtures fall below 1.3 eV. Absorption extends to about 1,050 nm | Hao et al. |
| A (cation) | Choice of MA or FA, and adding Cs | Switching MA to FA narrows the gap to the FA minimum of 1.48 eV (Eperon et al.). FA0.83Cs0.17Pb(I0.6Br0.4)3 gives about 1.74 eV with a photostable composition | Eperon et al. / McMeekin et al. |
| A and B | Four iodides: MA or FA with Sn or Pb | Direct gaps spread over 1.25 to 1.75 eV. Sn–Pb solid solutions form across the whole composition range | Stoumpos et al. |
All Sourced (Hoke et al. [Ref. 6], Eperon et al. [Ref. 5], Noh et al. [Ref. 9], Hao et al. [Ref. 7], McMeekin et al. [Ref. 8], Stoumpos et al. [Ref. 4]).
5. A materials engineer's view (1): mix Sn and Pb and the gap narrows below both ends
In designing alloys and solid solutions, the first rule of thumb that comes to mind is that mixing two components moves a property linearly between the two ends (Vegard's law). Hao and colleagues reported that the bandgap of CH3NH3Sn1−xPbxI3 does not run in a straight line between the end members, 1.55 eV (Pb) and 1.35 eV (Sn), and that the mixtures fall below 1.3 eVSourced. Absorption extends into the near infrared to about 1,050 nm, and the half-and-half Sn–Pb composition gave the broadest absorption and a short-circuit current of about 20 mA/cm²Sourced.
Narrower than either end is a value that linear interpolation can never produce. Applying the Section 2 calculation, the limiting efficiency at 1.25 eV is about 33.1%, higher than about 31.5% at 1.55 eVOur calculation. And in all-perovskite tandems, discussed in Section 9, the bottom cell needs a narrow bandgap, which is where this bowing pays off (our commentary).
Adding Sn, however, brings a different problem. Stoumpos and colleagues report that Sn compounds oxidise readily, becoming p-type through Sn⁴⁺ doping and showing metallic conductivitySourced. Freedom in the bandgap is bought at the price of chemical stability. See our explainer on tin-based perovskites for details.
6. The wall on the wide side: halides that separate under light
The most straightforward way to widen the bandgap is to add more bromine. Hoke and colleagues, however, started from earlier reports that in bromine-containing films the open-circuit voltage does not rise even though the bandgap widens (a voltage drop for x > 0.25), and set out to find the causeSourced.
- What happened: under continuous illumination, MAPb(BrxI1−x)3 films with 0.2 < x < 1 developed a new emission peak at about 1.68 eV regardless of composition, which grew within a minute even at less than 1 sunSourced
- Structurally: X-ray diffraction peaks split, suggesting separation into minority iodide-rich regions (x ≈ 0.2) and majority regions slightly richer in bromineSourced
- Reversibility: after a few minutes in the dark, the emission, absorption and diffraction patterns returned to their original stateSourced
- What it means: the authors propose that light moves halide ions, and that the narrower-gap iodide-rich regions act as recombination centres, pinning the emission and the open-circuit voltage at low valuesSourced
7. Our calculation: how much voltage does a 1.74 eV cell lose?
McMeekin and colleagues reported a cell using FA0.83Cs0.17Pb(I0.6Br0.4)3 with an optical bandgap of about 1.74 eV, an open-circuit voltage of 1.2 V, over 17% on a small area and 14.7% on 0.715 cm²Sourced. We compare that voltage with the open-circuit voltage of the same ideal model used in Section 2.
- Open-circuit voltage in the ideal model: with Eg = 1.74 eV, AM1.5G, 25 °C and radiative recombination only, about 1.46 VOur calculation
- Gap to the reported value: 1.46 − 1.2 = about 0.26 V, i.e. about 82% of the ideal (1.2 ÷ 1.46)Our calculation
- Gap to the bandgap: 1.74 − 1.2 = 0.54 VOur calculation
Assumptions and limits: the ideal open-circuit voltage is calculated on the same assumptions as Section 2. The reported 1.2 V is the value stated in the paper's abstract; this article does not separate out whether segregation occurred or how much it contributed. How much of the gap is due to halide segregation cannot be told from this calculation.
8. A materials engineer's view (2): designing not just the composition but its ability to stay mixed
Phase separation in a solid solution normally takes heat treatment or long holding times. In halide perovskites, however, the composition separates at room temperature, under nothing more than light, within a minute, and remixes after a few minutes in the darkSourced (Hoke et al.). Diffusion this fast shows how easily halide ions move through the lattice (our commentary).
The phenomenon turns composition design into a two-stage task.
- Stage one: choose a composition that gives the target bandgap (the dials of Section 4)
- Stage two: make sure the composition stays mixed during operation (crystallinity, A-site composition, treatment of defects and grain boundaries)
McMeekin and colleagues demonstrated a 1.74 eV material in a mixed FA–Cs system that is “highly crystalline” and compositionally photostableSourced. Its bromine fraction is 0.4, inside the range where Hoke and colleagues observed segregation (0.2 < x < 1)Sourced. One reading is therefore that keeping bromine at or below 0.2 is not the only answer; at the same bromine fraction, behaviour can change with crystal quality and the A site (our commentary).
The lesson for materials suppliers is that a composition sheet (what, at what percentage) does not by itself make a material specification. If the same nominal composition can differ in its ability to stay mixed depending on precursor purity, crystallisation conditions and additives, then the stability of the emission spectrum and diffraction under illumination needs to be considered as an incoming-inspection metric (our commentary). The mechanism by which ions move is covered in our explainer on ion migration and degradation.
9. The values tandems call for
Separate from the single-junction optimum (about 1.34 eV in Section 2), tandems, which stack two cells, require a different bandgap for each of the upper and lower cells.
- Tandems with silicon: McMeekin and colleagues put the optimum optical bandgap of a perovskite top cell paired with silicon at about 1.75 eVSourced. Efficiency tables Version 68 lists 35.2% (LONGi, measured by ESTI) for a two-terminal perovskite/silicon tandem cell of about 1 cm²Sourced
- All-perovskite tandems: the bottom cell needs a narrow bandgap, and the Sn–Pb mixtures of Section 5 are candidates (our commentary). The same tables list two-terminal perovskite/perovskite tandems at 28.2% on 1.038 cm² and 30.1% on a small area of 0.0493 cm²Sourced
Tandems are covered in detail in our explainers on silicon–perovskite tandems and on all-perovskite tandems.
10. Strengths, weaknesses and open issues
| Aspect | Strength (confirmed in primary sources) | Weakness or issue |
|---|---|---|
| Tuning range | Continuous tuning up to roughly 1.48 to 2.3 eV via the halide ratio (Eperon et al., Hoke et al.) | Light-induced segregation on the bromine-rich side (Hoke et al.) |
| Narrow side | Sn–Pb mixing goes below 1.3 eV, absorbing to about 1,050 nm (Hao et al.) | Sn oxidation readily makes the material p-type (Stoumpos et al.) |
| Wide side | Photostable about 1.74 eV with FA–Cs mixing (McMeekin et al.) | Open-circuit voltage about 82% of the ideal modelOur calculation |
| Absorption edge | Sharp, with an absorption coefficient above 1×10⁴ cm⁻¹ at 0.1 eV above the bandgap (Hoke et al.) | At x = 0.5 the absorption onset is more gradual (Hoke et al.) |
Each item is Sourced (source in brackets), except “about 82%”, which is our calculation. Sorting them into strengths and weaknesses is this article's own framing.
(1) Long-term compositional stability is not assessed in this article
The segregation reports described here are observations over minutes to tens of minutes. How the composition changes after years of illumination outdoors could not be established from generalisable primary sources within the scope of this article.
(2) Composition and colour do not map one to one
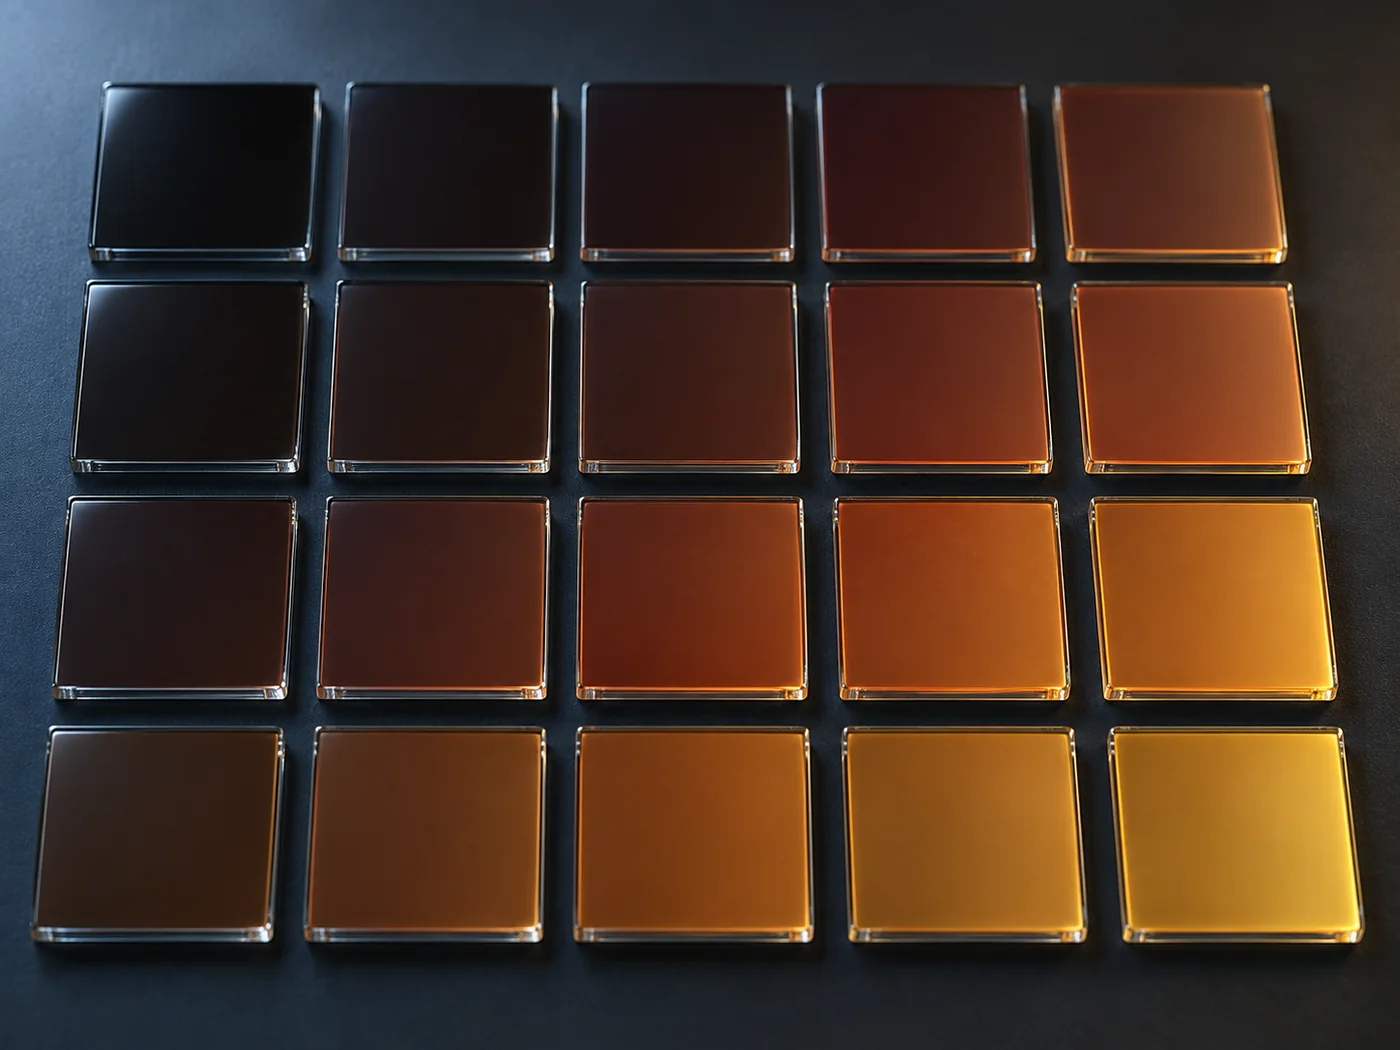
The colour of a film depends not only on the bandgap but also on thickness and scattering. Composition or bandgap cannot be judged from the colour of a film (our commentary).
- The theoretical single-junction optimum is about 1.34 eV, at about 33.7%Our calculation
- The band edges are built from lead and halide orbitals, so changing X and B moves the bandgapSourced
- Mixing Sn and Pb gives a gap below 1.3 eV, narrower than either endSourced
- With bromine mixed in, light separates the halides within a minute and pins the emission at 1.68 eVSourced
- The 1.2 V open-circuit voltage of a 1.74 eV cell is about 82% of the idealOur calculation
- Composition design has two stages: making the value and keeping it (our commentary)
11. Glossary
- Bandgap (Eg)
- The energy difference between the top of the valence band and the bottom of the conduction band. Light with less energy is not absorbed.
- Shockley–Queisser limit
- The upper efficiency limit of a single-junction solar cell under ideal conditions allowing only radiative recombination. A function of the bandgap.
- AM1.5G
- The standard spectrum (global) of sunlight that has passed through 1.5 times the thickness of the atmosphere. Defined in ASTM G173.
- Short-circuit current density (Jsc)
- The current that flows when the electrodes are shorted. Its ceiling is set by the number of photons that can be absorbed.
- Open-circuit voltage (Voc)
- The voltage when no current flows. The less recombination, the higher it is.
- Vegard's law
- The rule of thumb that properties of a solid solution, such as the lattice constant, change linearly with composition.
- Bowing
- A bandgap in a solid solution that sags away from the straight line. In Sn–Pb systems it falls below both ends.
- Halide segregation
- In mixed halides, the separation into iodide-rich and bromide-rich regions under illumination or other stimuli.
- Optical bandgap
- A bandgap determined from the onset of the absorption spectrum.
- σ-antibonding state
- A high-energy orbital state formed when two atomic orbitals overlap out of phase.
- Tandem
- A structure that stacks cells of different bandgap so that short- and long-wavelength light are converted by different cells.
- Two-terminal
- A tandem format in which the upper and lower cells are connected in series and the device has only two electrodes.
12. References (primary sources)
- Shockley, Queisser “Detailed Balance Limit of Efficiency of p-n Junction Solar Cells”, J. Appl. Phys. 32, 510 (1961) https://doi.org/10.1063/1.1736034
- NLR (National Laboratory of the Rockies, formerly NREL) “Reference Air Mass 1.5 Spectra” (distributes the ASTM G173-03 tables) https://www.nlr.gov/grid/solar-resource/spectra-am1.5
- Umebayashi et al. “Electronic structures of lead iodide based low-dimensional crystals”, Phys. Rev. B 67, 155405 (2003) https://doi.org/10.1103/PhysRevB.67.155405
- Stoumpos, Malliakas, Kanatzidis “Semiconducting Tin and Lead Iodide Perovskites with Organic Cations: Phase Transitions, High Mobilities, and Near-Infrared Photoluminescent Properties”, Inorg. Chem. 52, 9019 (2013) https://doi.org/10.1021/ic401215x
- Eperon et al. “Formamidinium lead trihalide: a broadly tunable perovskite for efficient planar heterojunction solar cells”, Energy Environ. Sci. 7, 982 (2014) https://doi.org/10.1039/C3EE43822H
- Hoke et al. “Reversible photo-induced trap formation in mixed-halide hybrid perovskites for photovoltaics”, Chem. Sci. 6, 613 (2015) https://doi.org/10.1039/C4SC03141E
- Hao et al. “Anomalous Band Gap Behavior in Mixed Sn and Pb Perovskites Enables Broadening of Absorption Spectrum in Solar Cells”, J. Am. Chem. Soc. 136, 8094 (2014) https://doi.org/10.1021/ja5033259
- McMeekin et al. “A mixed-cation lead mixed-halide perovskite absorber for tandem solar cells”, Science 351, 151 (2016) https://doi.org/10.1126/science.aad5845
- Noh et al. “Chemical Management for Colorful, Efficient, and Stable Inorganic–Organic Hybrid Nanostructured Solar Cells”, Nano Lett. 13, 1764 (2013) https://doi.org/10.1021/nl400349b
- Green et al. “Solar cell efficiency tables (Version 68)”, Joule 10, 102494 (2026) https://doi.org/10.1016/j.joule.2026.102494
13. Claim-to-source audit
| Claim in the text | Basis | Label |
|---|---|---|
| That the limiting efficiency under ideal conditions allowing only radiative recombination (the detailed-balance limit) was derived as a function of bandgap. That treating the sun and the cell as blackbodies at 6000 K and 300 K gave a maximum of 30% at 1.1 eV | J. Appl. Phys. paper (abstract). Reference 1 https://doi.org/10.1063/1.1736034 | Sourced |
| That the ASTM G173-03 AM1.5G spectrum (global, 37° tilted surface) is distributed by NLR. The renaming of NREL as NLR | NLR “Reference Air Mass 1.5 Spectra” page and data. Reference 2 https://www.nlr.gov/grid/solar-resource/spectra-am1.5 | Sourced |
| That in CH3NH3PbI3 the top of the valence band consists mainly of σ-antibonding states of Pb 6s and I 5p, and the bottom of the conduction band mainly of σ-antibonding states of Pb 6p and I 5s | Phys. Rev. B paper (abstract). Reference 3 https://doi.org/10.1103/PhysRevB.67.155405 | Sourced |
| That four iodides of MA or FA with Sn or Pb are direct-gap semiconductors with bandgaps between 1.25 and 1.75 eV. That Sn–Pb solid solutions form across the whole composition range. That Sn compounds oxidise readily, becoming p-type through Sn⁴⁺ doping and showing metallic conductivity | Inorg. Chem. paper (abstract). Reference 4 https://doi.org/10.1021/ic401215x | Sourced |
| That the bandgap of FA lead trihalides can be tuned from 1.48 to 2.23 eV. A planar cell of 14.2% with the 1.48 eV material. That MA-based bandgaps are about 1.55 eV or higher | Energy Environ. Sci. paper (abstract). Reference 5 https://doi.org/10.1039/C3EE43822H | Sourced |
| That the bandgap of MAPb(BrxI1−x)3 can be tuned from 1.6 to 2.3 eV. Earlier reports of a voltage drop for x > 0.25. That for 0.2 < x < 1 an emission peak at about 1.68 eV appears within a minute under illumination, independent of composition. The splitting of X-ray diffraction peaks and the suggested iodide-rich (x ≈ 0.2) regions. Reversible recovery after a few minutes in the dark. The hypothesis that iodide-rich regions pin the emission and open-circuit voltage. An absorption coefficient above 1×10⁴ cm⁻¹ at 0.1 eV above the bandgap, with a more gradual onset at x = 0.5. The hypothesis that holes collecting in iodide-rich regions drive segregation | Chem. Sci. paper (full text). Reference 6 https://doi.org/10.1039/C4SC03141E | Sourced |
| That the bandgap of CH3NH3Sn1−xPbxI3 does not follow Vegard's law between the end members (1.55 eV and 1.35 eV) and falls below 1.3 eV for mixtures. That absorption extends to about 1,050 nm. The broadest absorption and a short-circuit current of about 20 mA/cm² for Sn0.5Pb0.5 | J. Am. Chem. Soc. paper (abstract). Reference 7 https://doi.org/10.1021/ja5033259 | Sourced |
| That the optimum optical bandgap of a top cell for a tandem with silicon is about 1.75 eV. That FA0.83Cs0.17Pb(I0.6Br0.4)3 is highly crystalline and compositionally photostable, with an optical bandgap of about 1.74 eV, an open-circuit voltage of 1.2 V, over 17% on a small area and 14.7% on 0.715 cm² | Science paper (abstract). Reference 8 https://doi.org/10.1126/science.aad5845 | Sourced |
| That compositional control of MAPb(I1−xBrx)3 gave colour changes covering almost the whole visible range, and that the most efficient cell reached 12.3% | Nano Lett. paper (abstract). Reference 9 https://doi.org/10.1021/nl400349b | Sourced |
| Two-terminal perovskite/silicon tandem at 35.2% (0.9994 cm², LONGi, measured by ESTI). Two-terminal perovskite/perovskite tandems at 28.2% (1.038 cm²) and 30.1% on a small area (0.0493 cm²) | “Solar cell efficiency tables (Version 68)”, Joule. Reference 10 https://doi.org/10.1016/j.joule.2026.102494 | Sourced |
| Limiting efficiencies for AM1.5G, 25 °C and radiative recombination only (maximum about 33.7% at 1.34 eV; 33.1% at 1.25 eV; 32.4% at 1.48 eV; 31.5% at 1.55 eV; 28.4% at 1.74 eV; 22.9% at 2.00 eV), the current ceilings and the absorption-edge wavelengths. The ideal open-circuit voltage of about 1.46 V at 1.74 eV, the gap of about 0.26 V and ratio of about 82% to the reported 1.2 V, and the 0.54 V gap to the bandgap | Our calculation, using the ASTM G173 AM1.5G spectrum (Reference 2) and assuming step-function absorption, radiative recombination only and a dark current from 298.15 K blackbody radiation. Includes the numerical parts of Figs. 1 and 5 and the Section 2 table | Our calculation |
| The framing that, because the band edges are built from B and X orbitals, A does not contribute directly. Reading the breakdown of Vegard's law as a design tool. The two stages of making the value and keeping it. The reading that at the same bromine fraction behaviour can change with crystal quality and the A site. The idea of including stability under illumination in incoming inspection. That composition cannot be judged from colour. The sorting into strengths and weaknesses | Our summary and commentary based on published content. Not views expressed by the authors of the papers | Commentary |
| Compositional stability under long-term outdoor illumination. The share of the open-circuit voltage gap due to halide segregation | No generalisable primary source could be confirmed within the scope of this article, and our calculation cannot separate it out, so nothing is stated (our note) | Commentary |
| That Figs. 1 to 5 are explanatory drawings, not real measured data, energy levels or micrographs. That the hero image and Fig. 6 are AI-generated images | Our note | Commentary |
Last updated 25 September 2026. Sources are limited to primary material (peer-reviewed papers, the standard spectrum distributed by NLR, and the efficiency tables). The theoretical efficiency limits and the open-circuit voltage comparison are our own calculations on stated assumptions. Long-term outdoor compositional stability, and the share of the open-circuit voltage loss due to halide segregation, are not stated because no primary source could be confirmed. The content of papers is limited to what could be confirmed in the abstract or the openly available full text. All figures are explanatory concept graphics. Figs. 1 to 5 are vector drawings; the hero image and Fig. 6 are AI-generated images, and none of them shows real measured data or the appearance of real samples.