TECHNOLOGY EXPLAINER
Glass Transition and Creep
— Tg is a value that comes with how it was measured; creep is a property that comes with time
ISO 6721-11 describes the glass transition temperature as an indicator of the transition from a hard, relatively brittle glassy state to a rubbery or viscous-liquid state. The same standard also says that measured values may vary with the properties of the material and the configuration of the test. For one copper-clad laminate, Tg is published as 260 to 290 °C by the TMA method and 315 to 345 °C by the DMA method. A Tg figure is something to be read together with how it was measured.
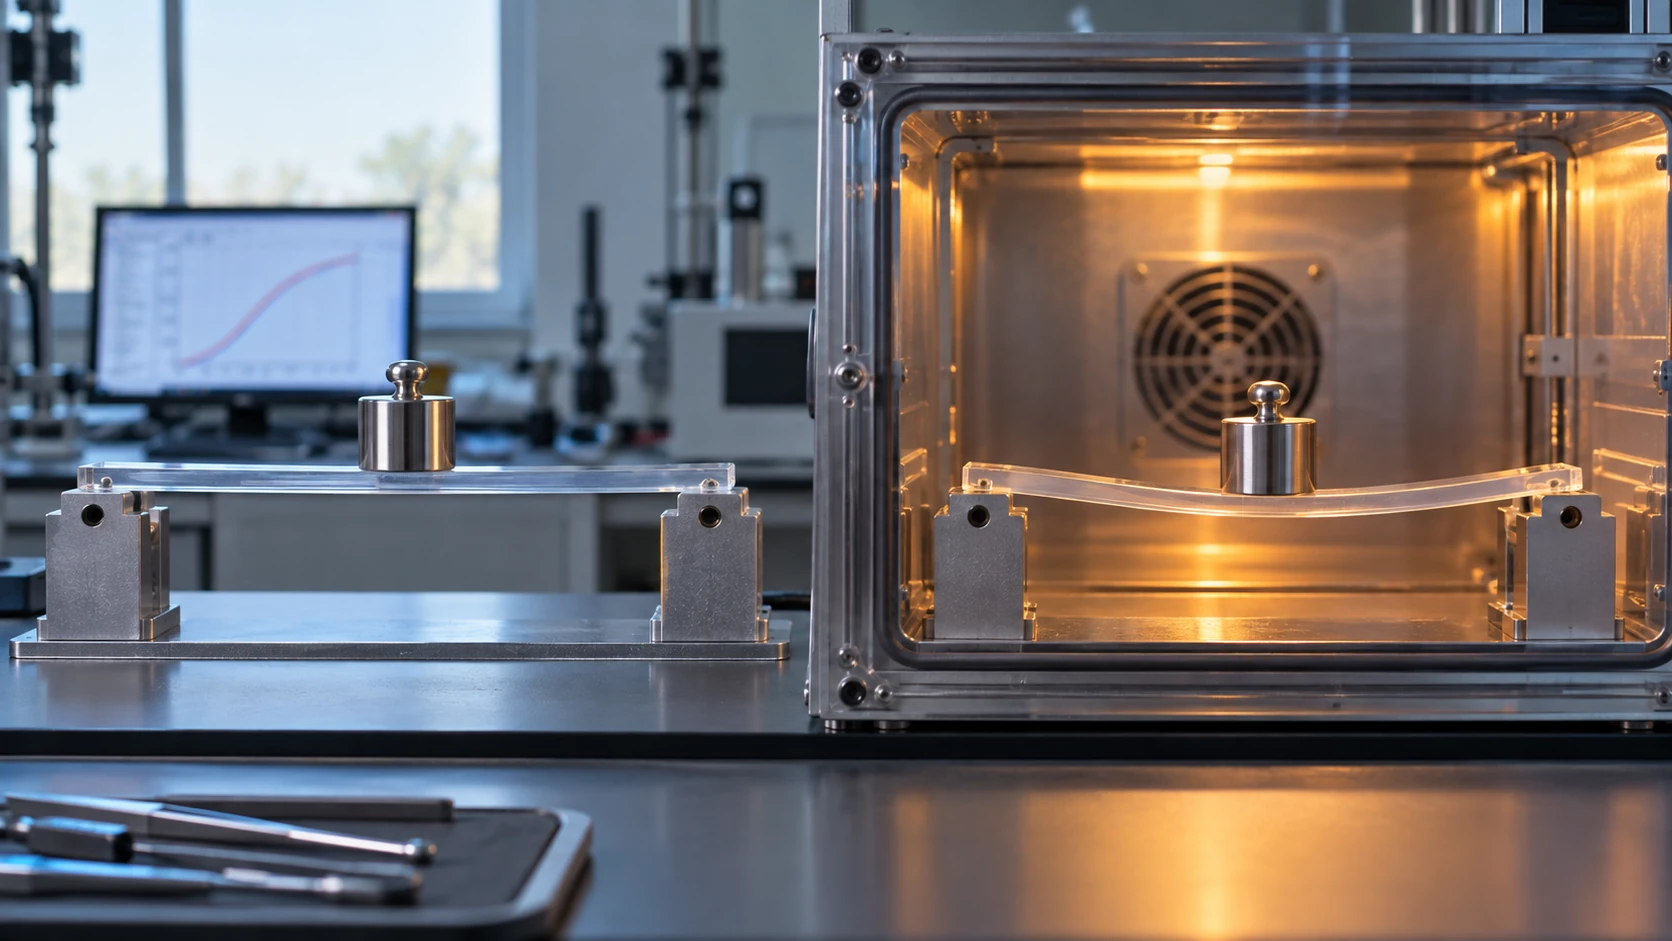
- What glass transition and creep are (the short version)
- How glass transition differs from melting and crystallization
- A materials engineer's view (1): Tg is a value that comes with how it was measured
- Our calculation: how far Tg moves with method, frequency and moisture
- Viscoelasticity: elastic and viscous behaviour side by side
- Creep and stress relaxation: two time-dependent phenomena
- A materials engineer's view (2): time-temperature superposition, buying time with temperature
- Our calculation: how many years is one hour at Tg + 20 K, using the WLF equation
- A materials engineer's view (3): how to use these in design
- Challenges and limits / Glossary / References / Claim-to-source audit
Sourced = a statement found in published material (link given)
Our calculation = a figure this article derived from stated assumptions
Not yet confirmed = a plan or outlook for which a track record has not been confirmed
Summaries and design-oriented readings are marked separately as commentary.
Property values are given together with the test method, conditions and source, and manufacturers' stated values are distinguished from values in papers.
1. What glass transition and creep are (the short version)
- Glass transition temperature (Tg): ISO 6721-11 treats it as an indicator of the transition in an amorphous polymer, or the amorphous part of a semicrystalline polymer, from a hard, relatively brittle glassy state to a rubbery or viscous-liquid stateSourced [Reference 1].
- A range, not a point: ASTM E1640 says that the glass transition takes place over a range of temperature, that the standard is a method of assigning one temperature (Tg) to represent that range, and that Tg can differ from one technique to anotherSourced [Reference 10].
- Creep and stress relaxation: ASTM D2990 says that creep test data are needed to predict creep modulus and strength under long-term loading, and the resulting dimensional changeSourced [Reference 12]. ASTM E328 says stress relaxation data are needed in the design of bolted joints and the loss of clamping force in gaskets [Reference 13].
Tg is not a material constant but a value that carries "how it was measured." Creep is a property that carries three things: load, temperature and time. The catalogue Tg and the temperature and time conditions used in design must not be read separately (our summary).
2. How glass transition differs from melting and crystallization
A polymer heated through a range of temperature shows two transitions of different character.
| Transition | What happens | How it appears in measurement | Related standards |
|---|---|---|---|
| Glass transition | The amorphous part changes from glassy (hard) to rubbery (soft). It spans a range of temperature | DSC: a step in specific heat. DMA: a fall in storage modulus. TMA: a change in the slope of dimensional change | ISO 11357-2, ASTM E1356 (DSC) / ISO 6721-11, ASTM E1640 (DMA) / ISO 11359-2, ASTM E1545 (TMA) |
| Melting / crystallization | The crystalline part melts (melting) or forms crystals on cooling (crystallization) | DSC: an endothermic peak (melting) or an exothermic peak (crystallization), and the enthalpy | ISO 11357-3, ASTM D3418 |
All Sourced (organised from the statements of scope in each standard [References 1 to 3 and 7 to 11]). ISO 11357-3 is a method for determining the temperature and enthalpy of melting and crystallization of crystalline or semicrystalline plastics.
ISO 11357-2 and ASTM E1356 state that the glass transition applies to amorphous materials and to semicrystalline materials with an amorphous regionSourced [References 2 and 8]. So a fully crystalline material has no glass transition, and in a semicrystalline material the "part held by crystals" and the "part where the amorphous phase moves" coexist (our commentary).
The Arkema technical data sheet for PVDF (Kynar 740) gives a glass transition temperature of −40 °C (ISO 11357-1/-2), a melting point of 168 °C (ISO 11357-1/-3, 10 °C/min) and a deflection temperature under load of 105 °C (1.8 MPa, ISO 75-1/-2)Sourced [Reference 19]. Although Tg is far below room temperature, the material holds its shape under load up to 105 °C because the crystalline parts act as a skeleton (our commentary). The deflection temperature under load is a test that finds the temperature at which a specimen deflects under a three-point bending load (ISO 75-1) [Reference 6]; it is not Tg itself.
Stiffness also falls sharply well short of the melting point. In the Chemours PFA 340 material, against a melting point of 305 °C, the flexural modulus at 250 °C is 55 MPa, about 9.3% of the 590 MPa at 23 °C (ISO 178 / ASTM D790)Sourced [Reference 20]. The same material defines the continuous service temperature as the temperature at which tensile strength and elongation at break retain 50% of their original values after 20,000 hours of thermal aging. Tg, melting point, deflection temperature under load and continuous service temperature are four separate yardsticks (our commentary). Specific examples by material are in our explainers on fluoropolymers and PFAS and on polyimide.
3. A materials engineer's view (1): Tg is a value that comes with how it was measured
There are three families of standard for measuring Tg: DSC, TMA and DMA. Each one looks at something different.
| Method | Standard | What the standard says (key points) |
|---|---|---|
| DSC (differential scanning calorimetry) | ISO 11357-2:2020, ASTM E1356-25 | The glass transition appears as a step in specific heat. Applies to amorphous materials or semicrystalline materials with an amorphous region. The usual temperature range of use is −120 to 500 °C (ASTM E1356) |
| TMA (thermomechanical analysis) | ISO 11359-2:2021, ASTM E1545-22 | ISO 11359-2 is a method of determining both the coefficient of linear thermal expansion and the glass transition temperature by TMA. ASTM E1545 covers compression conditions, says that the glass transition depends on the thermal history of the material, and applies to materials rigid enough to resist penetration by the probe |
| DMA (dynamic mechanical analysis) | ISO 6721-11:2019, ASTM E1640-23 | Ideally, the onset of the fall in storage modulus indicates the glass transition (ASTM E1640). ISO 6721-11 says that the temperature sensor is not in contact with the specimen and measures the surrounding temperature, so the data change with the heating rate, and it includes a procedure that takes thermal lag into account |
All Sourced (statements on the official page for each standard [References 1 to 3 and 8 to 10]).
Fig. 2 shows examples of published Tg. Even for the same product, the method of measurement makes a difference of tens of kelvin.
- Copper-clad laminate (Resonac MCL-E-795G): Tg is 260 to 290 °C by the TMA method and 315 to 345 °C by the DMA method. The heating rate is 10 °C/min, and the page notes that the values above are measured values, not guaranteed valuesSourced [Reference 17].
- Kapton HN: the DuPont datasheet states that a second-order transition occurs between 360 and 410 °C, which is assumed to be the Tg, and that different measurement techniques give different results within this rangeSourced [Reference 18].
- An example where the manufacturer's table does not state the method: in the table for Resonac's epoxy encapsulant for organic substrates, CEL-9700 HF10, Tg 125 °C, α1 6 ppm/°C and α2 27 ppm/°C are listed, but we could find no statement of the method or conditionsSourced [Reference 23].
Before setting the Tg values from different documents side by side, check the following five points (our summary; the basis for each is shown on the right).
| What to check | Supporting statement |
|---|---|
| 1. Measurement method (DSC, TMA, DMA) | MCL-E-795G differs by about 55 K between TMA and DMA [Reference 17] |
| 2. Heating rate | ISO 6721-11: DMA data change with heating rate. There is a procedure to take thermal lag into account [Reference 1] |
| 3. Frequency, and which heating run | Polymers 2019: Tg rises as frequency rises (dry, 82 to 84 °C) [Reference 14]. Polymers 2025: first run 69.7 °C, second run 76.6 °C [Reference 21] |
| 4. How Tg is read off (onset / midpoint / peak) | ASTM E1640: Tg is a single value representing a range and differs by technique [Reference 10]. Polymers 2019 took the intersection of tangents at the lower inflection point of the storage modulus [Reference 14] |
| 5. State of the specimen (degree of cure, moisture, thermal history) | ASTM E1545: the glass transition depends on thermal history [Reference 9]. Polymers 2019: saturation with water takes 82 to 57 °C (0.1 Hz) [Reference 14] |
Hasegawa et al. write the target for a heat-resistant plastic substrate as a Tg above 350 °C, ideally above 400 °C, or no clear Tg detected by DMASourced [Reference 22]. In other words, for some materials "having no Tg" becomes the way the target is written (we cover this in our explainer on polyimide).
4. Our calculation: how far Tg moves with method, frequency and moisture
From the published values in Fig. 2, we calculate the differencesOur calculation.
- TMA versus DMA (MCL-E-795G): at the midpoint of each range, TMA = (260 + 290) ÷ 2 = 275 °C and DMA = (315 + 345) ÷ 2 = 330 °C. The difference is 55 K (between the ends of the ranges, a minimum of 25 K and a maximum of 85 K)
- Effect of frequency (amine-cured epoxy, DMTA): when the frequency rises by two orders of magnitude, from 0.1 Hz to 10 Hz, the Tg of the dry specimen goes from 82 to 84 °C (+2 K) and that of the water-saturated specimen from 57 to 62 °C (+5 K)
- Effect of moisture (the same epoxy, 0.1 Hz): 82 °C to 57 °C, a change of −25 K (after absorbing 3.44 wt% of water)
- First and second heating (degradable epoxy, DSC at 20 °C/min): 69.7 to 76.6 °C, a change of +6.9 K
Assumptions and limits: each is a published value for a different material and a different method, and none is a "general difference." The dry and wet specimens in Polymers 2019 are a same-batch comparison, but the frequency effect rests on only three points between 0.1 and 10 Hz. The uncertainty given by the authors is ±2 °C.
5. Viscoelasticity: elastic and viscous behaviour side by side
A polymer has both the elastic property of springing back like a spring and the viscous property of flowing like a liquid. This is viscoelasticity. DMA measures it as a function of temperature and frequency, and ASTM E1640 describes DMA as a means of monitoring and quantifying how viscoelastic properties change with temperature and frequencySourced [Reference 10].
- Storage modulus (E′): the elastic component, "how stiff it is." It falls sharply above Tg.
- Loss modulus (E″): the viscous component, the amount of energy lost as heat.
- Loss tangent (tan δ): E″ ÷ E′. The ratio showing how readily vibrational energy is lost.
These definitions are our summary of the general definitions used in DMA. Because a measurement can vary both frequency and temperature, "lowering the frequency has an effect similar to raising the temperature" is the starting point of the time-temperature superposition described below (our commentary).
6. Creep and stress relaxation: two time-dependent phenomena
| Phenomenon | What stays constant and what changes | Where it matters in design | Standards |
|---|---|---|---|
| Creep | The load (stress) is constant and the strain (deformation) grows with time | Dimensional change under long-term load; rupture (creep rupture) | ISO 899-1 (tensile), ISO 899-2 (three-point bending), ASTM D2990 |
| Stress relaxation | The strain is constant and the stress falls with time | Fastening by bolts and rivets, press fits, gasket clamping | ASTM E328 |
All Sourced (organised from the statements in each standard [References 4, 5, 12 and 13]).
ISO 899-1 says that a tensile creep test for design data needs an extensometer, and that specimen preparation, dimensions, environment and thermal history strongly influence creep behaviourSourced [Reference 4]. ISO 899-2 likewise presents three-point flexural creep as a method of obtaining data for design, quality control and research and development [Reference 5].
The Polymers 2019 paper says that a thermosetting resin is not in thermodynamic equilibrium even below Tg and moves gradually towards it (physical aging), and that the region below Tg is the normal service temperature range for thermoset fibre-reinforced plastics, where creep still has to be consideredSourced [Reference 14]. The amine-cured epoxy in that paper (Hexion's Epikote RIMR135 / Epikure RIMH137, 100:30, cured for 24 hours at room temperature plus 16 hours at 80 °C) was examined in creep tests at a constant stress of 10 MPa for 3 hours at each temperature. The water-saturated specimen (3.44 wt%) ruptured during the test at 60 °C, whereas the dry specimen did not rupture at the same temperature and stressSourced. Tensile strength was also 60.5 ± 2.7 MPa dry and 48.5 ± 3.3 MPa wet. The difference in Tg (82 °C against 57 °C, at 0.1 Hz) thus moved the boundary between usable and not usable at the same stress (our commentary).
7. A materials engineer's view (2): time-temperature superposition, buying time with temperature
Creep cannot be measured for years on end. What is used instead is time-temperature superposition (TTS). The Heliyon 2023 paper describes TTS as a physical principle by which data curves obtained at other temperatures are shifted relative to a reference temperature, so that mechanical properties beyond the experimental range of time or frequency can be estimatedSourced [Reference 15]. Fig. 3 is a worked example.
- The shift factors log aT, which move the creep curves of the amine-cured epoxy (Polymers 2019) to a reference temperature of 26 °C (dry), are +1.98 at 15 °C, −2.09 at 40 °C and −4.82 at 60 °C. For the wet specimen (reference 25 to 26 °C) they are +1.51, −2.47 and −5.72Sourced [Reference 14].
- Because the shift factors are close to linear against 1/T, the authors conclude that Arrhenius behaviour holds in the region below Tg, and report activation energies of 277 kJ/mol dry and 297 kJ/mol wet (the same within the scatter)Sourced.
- The paper says the master curve is valid only below Tg for this epoxy, and, since the wet specimen ruptured near Tg, that the method does not apply where nonlinear effects become importantSourced.
Using the activation energy of 277 kJ/mol for the dry epoxy, we calculate the shift factors from a reference temperature of 26 °C (299.15 K)Our calculation. The equation is log aT = (Ea ÷ 2.303R) × (1/T − 1/Tref), with R = 8.314 J/(mol·K) [Reference 15].
- 15 °C: calculated +1.85 (paper: +1.98)
- 40 °C: calculated −2.16 (paper: −2.09)
- 60 °C: calculated −4.94 (paper: −4.82)
Assumptions and limits: the activation energy is an average over three temperatures, and the values at individual temperatures scatter from 268 to 297 kJ/mol (Table 1 of the paper). The calculation matches the paper's values to within 0.07 to 0.13, but this applies to a dry epoxy well below Tg and cannot be used to extrapolate to other materials. A log aT of −4.82 at 60 °C means that, at only 34 K above the reference temperature, the creep time axis shrinks by 10−4.82, about 1/66,000.
8. Our calculation: how many years is one hour at Tg + 20 K, using the WLF equation
Near and above Tg, the WLF equation is used in place of the Arrhenius equation. According to the Heliyon 2023 paper, the WLF equation is log10 aT = −C1 (T − Tg) ÷ (C2 + (T − Tg)), and C1 = 17.44 and C2 = 51.6 can be used for many amorphous polymers from Tg to Tg + 100 K, but should be treated as adjustable parametersSourced [Reference 15]. The original source is the 1955 paper by Williams, Landel and Ferry (J. Am. Chem. Soc. 77, 3701; the bibliographic details were checked in Crossref) [Reference 16].
We calculate using the constants aboveOur calculation.
| T − Tg | log10 aT | aT | One hour at that temperature corresponds to how many hours at Tg |
|---|---|---|---|
| +10 K | −2.83 | 1.48×10⁻³ | about 678 hours (about 28 days) |
| +20 K | −4.87 | 1.34×10⁻⁵ | about 74,000 hours (about 8.5 years) |
| +50 K | −8.58 | 2.61×10⁻⁹ | about 380 million hours (about 44,000 years) |
Assumptions and limits: these values use universal constants with Tg as the reference temperature, and are not predictions for any real material. For semicrystalline polymers, highly crosslinked thermosets and materials containing fillers or fibres, the constants may change or the equation may not apply. The equation is limited to the range up to Tg + 100 K.
One hour at Tg + 20 K corresponds to about 8.5 years at Tg. This calculation shows that for a material used near Tg, controlling temperature is controlling time. Conversely, even well below Tg (the Arrhenius region), Fig. 3 shows a change of about 104.8-fold over 34 K. If you judge "Tg is so many °C, so it is fine" without being aware of how many kelvin the service temperature sits below Tg, you can no longer treat long-term creep and a short, high-temperature excursion such as solder reflow (260 °C) on the same scale (our commentary). The change in thermal expansion coefficient at Tg (α1 / α2) is covered, with manufacturers' published values, in our explainers on the coefficient of thermal expansion and on underfill.
9. A materials engineer's view (3): how to use these in design
Here we reorganize the materials covered in other explainers in this series from the point of view of Tg and creep (our summary, based on the sourced facts in each explainer).
| Material | How Tg appears | Design caution |
|---|---|---|
| Polyimide (Kapton HN) | A second-order transition between 360 and 410 °C is assumed to be Tg. It depends on the measurement technique. No melting point (DuPont) [Reference 18] | "High Tg" and "usable for a long time" are different things (UL RTI, thermal life and so on). There is also shrinkage on first heating |
| Fluoropolymers (PFA 340, PVDF Kynar 740) | PVDF has a Tg of −40 °C but a melting point of 168 °C and a deflection temperature under load of 105 °C [Reference 19]. PFA has a melting point of 305 °C, and its flexural modulus at 250 °C is about 9.3% of that at 23 °C [Reference 20] | For semicrystalline materials, read not only Tg but the modulus at the service temperature and the definition of continuous service temperature |
| Epoxy (degradable formulation and others) | 69.7 to 76.6 °C between the first and second DSC runs. About 25 K lower after post-cure at 140 °C [Reference 21]. 82 to 57 °C on absorbing water [Reference 14] | Tg moves with degree of cure, moisture and thermal history. Evaluate including the humidity of the service environment |
| Copper-clad laminate (MCL-E-795G) | 260 to 290 °C by TMA, 315 to 345 °C by DMA [Reference 17] | Compare values from the same measurement method. That the Z-direction CTE changes greatly around Tg (10 to 15 to 70 to 100 ppm/°C) is a Resonac published value introduced in our explainer on the coefficient of thermal expansion |
A checklist for using these in design
- Record Tg together with how it was measured: the standard number (DSC / TMA / DMA), heating rate, frequency, which heating run, and how Tg was read (onset, midpoint or peak).
- Check Tg under service conditions: measure specimens whose degree of cure, moisture uptake and thermal history match the state in use (in one example moisture moved Tg by 25 K).
- Measure the modulus and creep at the temperature of use: ISO 899-1 / 899-2, ASTM D2990. Use an extensometer for design data.
- Consider stress relaxation separately: for bolts, gaskets and press fits, the thinking of ASTM E328 is needed apart from creep.
- When extrapolating, state the range: Arrhenius type below Tg, WLF type near and above Tg. Do not extrapolate under conditions where nonlinearity or rupture appears.
- Do not use deflection temperature under load or continuous service temperature in place of Tg: they are separate yardsticks (Section 2).
10. Challenges and limits
- Corresponding Japanese standards: Japanese Industrial Standards (JIS) also have test methods for Tg and creep, but we could not confirm their numbers and content on official pages, so this article cites only ISO and ASTM.
- Range of applicability of TTS: superposition holds only under limited conditions, such as amorphous materials with a single transition. For semicrystalline polymers, strongly crosslinked thermosets and composites, whether it applies has to be verified.
- Limits of generalizing the constants: the universal values of the WLF constants C1 and C2 are a guide, and need to be adjusted for each material. The calculations in this article are for explanation.
- Comparing published values: the examples in Fig. 2 and the table in Section 9 are of different materials and do not generalize the differences between measurement methods.
- Not covered here: quantifying physical aging, theories of the glass transition (free volume, cooperative motion), the difference between the dynamic and static glass transitions, and creep design for fibre-reinforced composites.
11. Glossary
- Glass transition temperature (Tg)
- A value representing the temperature range over which the amorphous part moves from a hard glassy state to a rubbery one. It varies with the method of measurement.
- DSC
- Differential scanning calorimetry. The glass transition appears as a step in specific heat, and melting as an endothermic peak.
- TMA
- Thermomechanical analysis. It measures dimensional change as temperature rises, giving the coefficient of linear thermal expansion and Tg.
- DMA
- Dynamic mechanical analysis. It measures modulus and related quantities as a function of temperature and frequency.
- Storage modulus (E′)
- The elastic component of viscoelasticity. It falls sharply above Tg.
- tan δ
- The ratio of loss modulus to storage modulus. Its peak is sometimes taken as Tg.
- Creep
- The phenomenon in which deformation grows with time under a constant load.
- Stress relaxation
- The phenomenon in which stress falls with time under a constant strain.
- Time-temperature superposition (TTS)
- A method of estimating long-term behaviour by shifting data from different temperatures horizontally.
- WLF equation
- An equation for the shift factor in the region from near Tg upwards. It uses C1 and C2.
- Arrhenius type
- A form that expresses temperature dependence through an activation energy. Used in the region below Tg.
- Deflection temperature under load
- The temperature at which a specimen deflects under load (ISO 75). A separate indicator from Tg.
12. References
- ISO "ISO 6721-11:2019 Plastics — Determination of dynamic mechanical properties — Part 11: Glass transition temperature" — https://www.iso.org/standard/74988.html
- ISO "ISO 11357-2:2020 Plastics — Differential scanning calorimetry (DSC) — Part 2: Determination of glass transition temperature and step height" — https://www.iso.org/standard/77310.html
- ISO "ISO 11359-2:2021 Plastics — Thermomechanical analysis (TMA) — Part 2: Determination of coefficient of linear thermal expansion and glass transition temperature" — https://www.iso.org/standard/81835.html
- ISO "ISO 899-1:2017 Plastics — Determination of creep behaviour — Part 1: Tensile creep" — https://www.iso.org/standard/72819.html
- ISO "ISO 899-2:2024 Plastics — Determination of creep behaviour — Part 2: Flexural creep by three-point loading" — https://www.iso.org/standard/84391.html
- ISO "ISO 75-1:2020 Plastics — Determination of temperature of deflection under load — Part 1: General test method" — https://www.iso.org/standard/77576.html
- ISO "ISO 11357-3:2025 Plastics — Differential scanning calorimetry (DSC) — Part 3: Determination of temperature and enthalpy of melting and crystallization" — https://www.iso.org/standard/11357-3
- ASTM International "ASTM E1356-25 Standard Test Method for Assignment of the Glass Transition Temperatures by Differential Scanning Calorimetry" — https://store.astm.org/e1356-25.html
- ASTM International "ASTM E1545-22 Standard Test Method for Assignment of the Glass Transition Temperature by Thermomechanical Analysis" — https://store.astm.org/e1545-22.html
- ASTM International "ASTM E1640-23 Standard Test Method for Assignment of the Glass Transition Temperature By Dynamic Mechanical Analysis" — https://store.astm.org/e1640-23.html
- ASTM International "ASTM D3418-21 Standard Test Method for Transition Temperatures and Enthalpies of Fusion and Crystallization of Polymers by Differential Scanning Calorimetry" — https://store.astm.org/d3418-21.html
- ASTM International "ASTM D2990 Standard Test Methods for Tensile, Compressive, and Flexural Creep and Creep-Rupture of Plastics" — https://store.astm.org/d2990-17r25.html
- ASTM International "ASTM E328 Standard Test Methods for Stress Relaxation for Materials and Structures" — https://store.astm.org/e0328-26.html
- Polymers 2019, 11(11), 1848 "Time–Temperature–Plasticization Superposition Principle: Predicting Creep of a Plasticized Epoxy" (DOI: 10.3390/polym11111848, open access) — https://pmc.ncbi.nlm.nih.gov/articles/PMC6918382/
- Heliyon 2023, 9, e15816 "TTS package: Computational tools for the application of the Time Temperature Superposition principle" (DOI: 10.1016/j.heliyon.2023.e15816, open access) — https://pmc.ncbi.nlm.nih.gov/articles/PMC10192834/
- M. L. Williams, R. F. Landel, J. D. Ferry "The Temperature Dependence of Relaxation Mechanisms in Amorphous Polymers and Other Glass-forming Liquids", J. Am. Chem. Soc. 1955;77:3701-3707 (DOI: 10.1021/ja01619a008; bibliographic details checked in Crossref) — https://doi.org/10.1021/ja01619a008
- Resonac "MCL-E-795G" product page (in Japanese) — https://www.resonac.com/jp/products/pwb-materials/base/005.html
- DuPont "DuPont™ Kapton® HN Polyimide Film" datasheet K-15345-2 (December 2016 edition). A copy hosted on a distributor's site — https://www.epectec.com/downloads/DuPont-Kapton-HN-Polyimide-Film.pdf
- Arkema "KYNAR® 740" technical data sheet (PDF) — https://hpp.arkema.com/assets/arkema/TDS_KYNAR%C2%AE%20740_en_WW.pdf
- Chemours "Teflon™ PFA 340" product information (PDF) — https://www.teflon.com/en/-/media/files/teflon/teflon-pfa-340-product-info.pdf?rev=82238a0cd6af4b1dbd58e991fd8cc86d&hash=0055785638604E72525F1DB841F28F11
- Polymers 2025, 17(1), 88 "Cleavable Bio-Based Epoxy Matrix for More Eco-Sustainable Thermoset Composite Components" (DOI: 10.3390/polym17010088, open access) — https://pmc.ncbi.nlm.nih.gov/articles/PMC11723220/
- M. Hasegawa "Development of Solution-Processable, Optically Transparent Polyimides with Ultra-Low Linear Coefficients of Thermal Expansion", Polymers 2017, 9(10), 520 (DOI: 10.3390/polym9100520, open access) — https://pmc.ncbi.nlm.nih.gov/articles/PMC6418549/
- Resonac "Epoxy molding compounds for organic substrates" product page (in Japanese) — https://www.resonac.com/jp/products/semi-backend-process/76/012.html
13. Claim-to-source audit
| Claim in the text | Basis | Label |
|---|---|---|
| ISO 6721-11:2019: how to determine Tg by DMA. Tg is an indicator of the transition from a glassy state to a rubbery or viscous-liquid state in an amorphous polymer or in the amorphous part of a semicrystalline polymer. Measured values may vary with the properties of the material and the test configuration. The DMA temperature sensor is not in contact with the specimen and measures the surrounding temperature, so the data vary with heating rate. It includes a procedure that takes thermal lag into account | ISO 6721-11Reference 1 https://www.iso.org/standard/74988.html | Sourced |
| ISO 11357-2:2020: how to determine Tg and step height by DSC. Applies to amorphous and semicrystalline plastics | ISO 11357-2Reference 2 https://www.iso.org/standard/77310.html | Sourced |
| ISO 11359-2:2021: how to determine the coefficient of linear thermal expansion and Tg by TMA | ISO 11359-2Reference 3 https://www.iso.org/standard/81835.html | Sourced |
| ISO 899-1:2017: tensile creep. An extensometer is needed for design data. Specimen preparation, dimensions, environment and thermal history affect creep behaviour | ISO 899-1Reference 4 https://www.iso.org/standard/72819.html | Sourced |
| ISO 899-2:2024: flexural creep by three-point bending. A method for obtaining data for design, quality control and research and development | ISO 899-2Reference 5 https://www.iso.org/standard/84391.html | Sourced |
| ISO 75-1:2020: the general test method for deflection temperature under load (three-point bending load) | ISO 75-1Reference 6 https://www.iso.org/standard/77576.html | Sourced |
| ISO 11357-3:2025: how to determine the temperature and enthalpy of melting and crystallization of crystalline and semicrystalline plastics (the 2018 edition has been withdrawn on revision) | ISO 11357-3Reference 7 https://www.iso.org/standard/11357-3 | Sourced |
| ASTM E1356-25: assigning Tg by DSC. The glass transition appears as a step in specific heat. Applies to amorphous materials or semicrystalline materials with an amorphous region. Temperature range of use −120 to 500 °C | ASTM E1356Reference 8 https://store.astm.org/e1356-25.html | Sourced |
| ASTM E1545-22: assigning Tg by TMA (compression). That the glass transition depends on the thermal history of the material. Applies to materials rigid enough to resist penetration by the probe. Temperature range of use −100 to 600 °C | ASTM E1545Reference 9 https://store.astm.org/e1545-22.html | Sourced |
| ASTM E1640-23: assigning Tg by DMA. Ideally the onset of the fall in storage modulus indicates the glass transition. That the glass transition takes place over a range of temperature, that the standard assigns one temperature to represent it, and that Tg can differ by technique. That DMA is a means of monitoring and quantifying how viscoelastic properties change with temperature and frequency. Covers materials with a modulus of 0.5 MPa to 100 GPa | ASTM E1640Reference 10 https://store.astm.org/e1640-23.html | Sourced |
| ASTM D3418-21: the DSC test method for transition temperatures and enthalpies of fusion and crystallization of polymers | ASTM D3418Reference 11 https://store.astm.org/d3418-21.html | Sourced |
| ASTM D2990: that creep and creep-rupture data are needed to predict creep modulus, strength and dimensional change under long-term load | ASTM D2990Reference 12 https://store.astm.org/d2990-17r25.html | Sourced |
| ASTM E328: that stress relaxation data are needed for designs such as bolt and rivet fastening, press fits and gasket clamping | ASTM E328Reference 13 https://store.astm.org/e0328-26.html | Sourced |
| Tg of the amine-cured epoxy (Hexion Epikote RIMR135 / Epikure RIMH137, 100:30) (DMTA, ISO 6721; dry 82 / 83 / 84 °C, wet 57 / 60 / 62 °C at 0.1 / 1 / 10 Hz, ±2 °C), water saturation of 3.44 wt% (60 °C, two months), creep tests at 10 MPa for 3 h at each temperature, shift factors log aT (dry: +1.98 at 15 °C, −2.09 at 40 °C, −4.82 at 60 °C; wet: +1.51, −2.47, −5.72), activation energies (dry 277 kJ/mol, wet 297 kJ/mol), tensile strength (dry 60.5 MPa, wet 48.5 MPa), rupture of the wet specimen at 60 °C, physical aging, and that the master curve is valid only below Tg | Polymers 2019, 11, 1848Reference 14 https://pmc.ncbi.nlm.nih.gov/articles/PMC6918382/ | Sourced |
| The explanation of TTS; the WLF equation log10 aT = −C1(T − Tg)/(C2 + (T − Tg)); that C1 = 17.44 and C2 = 51.6 are constants usable from Tg to Tg + 100 K for many amorphous polymers and should be treated as adjustable parameters; the Arrhenius equation | Heliyon 2023Reference 15 https://pmc.ncbi.nlm.nih.gov/articles/PMC10192834/ | Sourced |
| That the original source of the WLF equation (Williams, Landel and Ferry, J. Am. Chem. Soc. 1955, 77, 3701-3707) exists (the bibliographic details were checked in Crossref; we have not consulted the text, and the values of the constants are from the description in Heliyon 2023) | Williams et al. (1955)Reference 16 https://doi.org/10.1021/ja01619a008 | Sourced |
| Resonac MCL-E-795G: Tg of 260 to 290 °C by TMA and 315 to 345 °C by DMA, heating rate 10 °C/min, and a note that the values are measured values, not guaranteed values | Resonac product pageReference 17 https://www.resonac.com/jp/products/pwb-materials/base/005.html | Sourced |
| Kapton HN: a second-order transition between 360 and 410 °C is assumed to be Tg, and results differ by measurement technique. No melting point | DuPont datasheetReference 18 https://www.epectec.com/downloads/DuPont-Kapton-HN-Polyimide-Film.pdf | Sourced |
| Kynar 740: Tg −40 °C (ISO 11357-1/-2), melting point 168 °C (ISO 11357-1/-3, 10 °C/min), deflection temperature under load 105 °C (1.8 MPa, ISO 75-1/-2) | Arkema Kynar 740Reference 19 https://hpp.arkema.com/assets/arkema/TDS_KYNAR%C2%AE%20740_en_WW.pdf | Sourced |
| PFA 340: melting point 305 °C, flexural modulus of 590 MPa (23 °C) and 55 MPa (250 °C), and the definition of continuous service temperature | Chemours PFA 340Reference 20 https://www.teflon.com/en/-/media/files/teflon/teflon-pfa-340-product-info.pdf?rev=82238a0cd6af4b1dbd58e991fd8cc86d&hash=0055785638604E72525F1DB841F28F11 | Sourced |
| Tg of the degradable bio-based epoxy (DSC, 20 °C/min; first run 69.7 / 68.0 / 51.7 °C, second run 76.6 / 72.7 / 50.9 °C), and a fall of about 25 K after post-cure at 140 °C | Polymers 2025, 17, 88Reference 21 https://pmc.ncbi.nlm.nih.gov/articles/PMC11723220/ | Sourced |
| The target for a heat-resistant plastic substrate (Tg above 350 °C, ideally above 400 °C, or no clear Tg detected by DMA) | Hasegawa (2017)Reference 22 https://pmc.ncbi.nlm.nih.gov/articles/PMC6418549/ | Sourced |
| That the table for the organic-substrate encapsulant CEL-9700 HF10 lists Tg 125 °C, α1 6 and α2 27 ppm/°C, and that we could find no statement of the method or conditions | Resonac encapsulant pageReference 23 https://www.resonac.com/jp/products/semi-backend-process/76/012.html | Sourced |
| The 55 K difference between the TMA and DMA midpoints for MCL-E-795G (minimum 25 K to maximum 85 K), the Tg change for 0.1 to 10 Hz (+2 K and +5 K), the change with moisture (−25 K), and the DSC first to second run change (+6.9 K). The reproduction of log aT by the Arrhenius equation (+1.85, −2.16, −4.94). The conversion factors from the WLF equation (Tg + 10 K: −2.83, Tg + 20 K: −4.87, Tg + 50 K: −8.58), and how many hours at Tg correspond to one hour (about 678 hours, about 74,000 hours = about 8.5 years, about 380 million hours) | Our calculation. Differences between published values, and calculations with the Arrhenius equation (Ea = 277 kJ/mol, R = 8.314) and the WLF equation (C1 = 17.44, C2 = 51.6); the assumptions are given in each section. Not predictions for any real material | Our calculation |
| The explanation of E′, E″ and tan δ; the framing of Tg as a change over a range rather than a point, and of the difference between melting point and Tg; the shape of the curves in Fig. 1; the checklist; the "Tg story" for each material; and the separation of deflection temperature under load and continuous service temperature as different yardsticks | Our summary and commentary based on published content. Fig. 1 is a schematic, not a measurement. The definitions of E′, E″ and tan δ follow the general definitions used in DMA | Commentary |
| The numbers and content of JIS test methods for Tg and creep, the quantification of physical aging, and whether TTS applies to semicrystalline polymers and composites | Not stated, because they could not be confirmed on official pages within the scope of this article, or are not covered | Not yet confirmed |
| That Figs. 1, 2, 3, 4 and 5 are explanatory drawings, and that the hero image is an AI-generated image. That Figs. 2 and 3 are this article's own drawings of published values | Note by this article | Commentary |
Last updated 2 October 2026. Sources are limited to primary material (the official pages of standards bodies, manufacturers' product pages and datasheets, and peer-reviewed papers). The values of Tg, creep and conversion factors are published values for specific materials and test conditions, or calculations for explanation, and are not generalized to other materials. Corresponding JIS standards, the quantification of physical aging, and whether time-temperature superposition applies to semicrystalline polymers and composites are not stated here because they could not be confirmed within the scope of this article. Figs. 1, 2, 3, 4 and 5 are vector drawings; the hero image is an AI-generated image, and none of them shows a real measured curve or test apparatus.