TECHNOLOGY EXPLAINER
Polyolefins
— chains made only of carbon and hydrogen make up 45% of the world's plastics
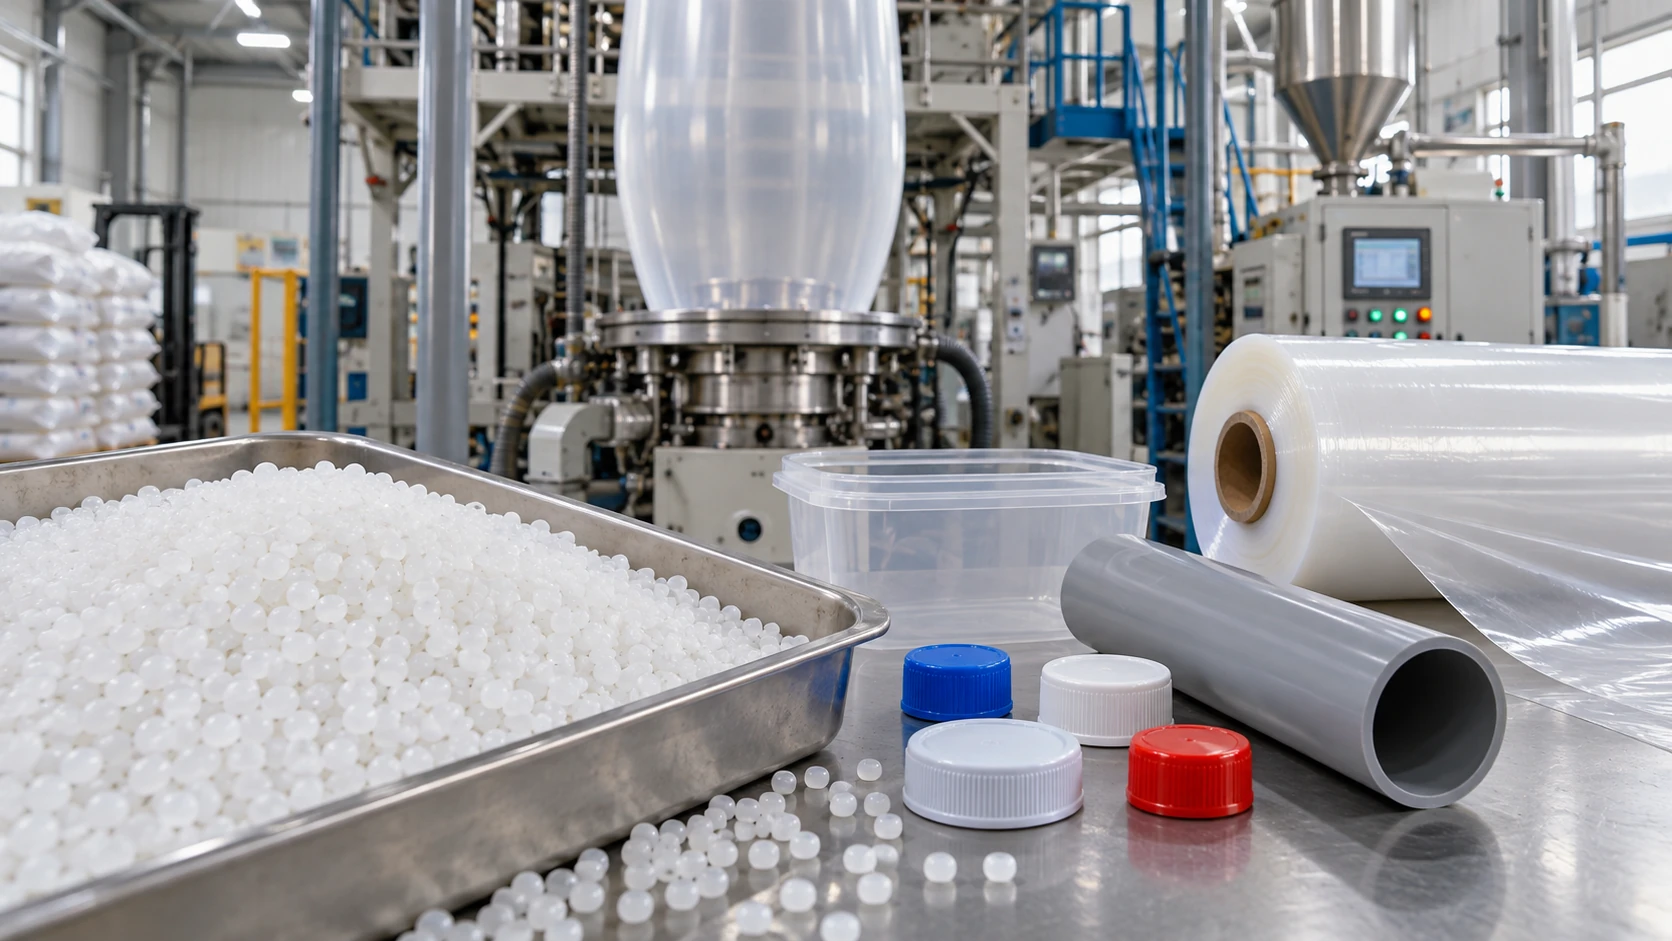
Polyolefins, polyethylene (PE) and polypropylene (PP) taken together, account for roughly 45% of world plastics production, and for about the same share in Japan. Their only elements are carbon and hydrogen. Yet differences in branching, catalyst and the way crystals form alone turn them into cling film, pipe or medical containers. This article, written from a materials engineer's standpoint, sets out how HDPE, LDPE, LLDPE and PP differ in structure, Ziegler–Natta and metallocene catalysts, applications, and where recycling stands today.
- What polyolefins are (the short version)
- How much is made — worldwide and in Japan
- Four faces — HDPE, LDPE, LLDPE and PP
- Our calculation: estimating crystallinity from density
- A materials engineer's view (1): the "amount" and the "thickness" of crystals are different quantities
- Catalysts — from Ziegler–Natta to metallocene
- A materials engineer's view (2): melting point and heat resistance under load are different things
- Applications — how manufacturers say the grades are used
- Where recycling stands
- A materials engineer's view (3): three problems facing polyolefin recycling
- Open issues, and what this article could not confirm
- Glossary / References / Claim-to-source audit
Sourced = content stated in published material, peer-reviewed papers, standards or legislation (link given)
Our calculation = a value this article derived from explicitly stated assumptions
Not yet confirmed = a plan, target or outlook with no confirmed track record
Textbook-style summaries of polymer science and readings for materials design are marked separately as Commentary. Property values are given together with the test method, conditions and origin. Manufacturers' values are given as "manufacturer's stated value (typical)", and the value of one grade is not ranked against another.
1. What polyolefins are (the short version)
- What they are made of: polymers of olefins (hydrocarbons with a carbon double bond), that is, of ethylene and propylene. The main chain consists only of carbon–carbon single bonds and has no functional groups (Commentary)
- Why they are so varied: changing the branching of the chain, the arrangement of methyl groups (tacticity), the molecular weight and its distribution, and the amount of comonomer moves density, crystallinity, melting point, transparency and toughness greatly. That tuning is done mainly by the catalyst (Section 6) (Commentary)
- What is hard: because they are chemically stable and made in huge volumes with similar properties, sorting and recovery after use is the problem. That the main chain is hard to cut is an advantage for durability, but a disadvantage for chemical decomposition (Commentary)
PE and PP are not "one material" but families of materials with different chain blueprints. Even when made from the same ethylene, LDPE (density 0.923 g/cm³) and HDPE (0.965 g/cm³) differ greatly: about half of the material is crystalline in one and about 80% in the other (our calculation in Section 4Our calculation). The single word "PE" in a catalogue does not specify a material. It takes four items together — density, melt flow rate, type of catalyst and comonomer — to pin it down.
2. How much is made — worldwide and in Japan
Plastics Europe's "Plastics the Fast Facts 2025" puts world plastics production in 2024 at 430.9 Mt. By type, the shares include polypropylene 19.0%, PE-LD and LLD 13.9% and PE-HD and MD 12.1%Sourced. The three PE and PP items add up to 45.0%, which times 430.9 Mt is about 193.9 MtOur calculation. The scope here is the raw material for plastic products, excluding adhesives, paints and some fibres (PA, PET and PBT fibres and so on)Sourced.
In Japan, the Plastic Waste Management Institute (PWMI) publishes, out of 8.53 million t of resin production in 2024, 1.94 million t (22.7%) of polyethylene and 1.93 million t (22.7%) of polypropyleneSourced. The total is 3.87 million t, which is about 45.4% of 8.53 million tOur calculation. Japan and the world show nearly the same share. Because the scope of the tallies differs (the treatment of synthetic rubber, synthetic fibres and liquid resins, for example), however, the shares cannot be compared strictly.
Polyolefins are often called "commodity resins" and treated as technically mature, easy materials. But large volume also means that a small difference in performance carries large economic value. World PE and PP production is about 193.9 Mt, so a mere 1% cut in the amount used corresponds to about 1.9 MtOur calculation. This is why long-running research on the control of catalysts, copolymerisation and molecular weight distribution has continued in this field.
3. Four faces — HDPE, LDPE, LLDPE and PP
Polyolefins can be sorted into four broad groups by the shape of the chain (Commentary).
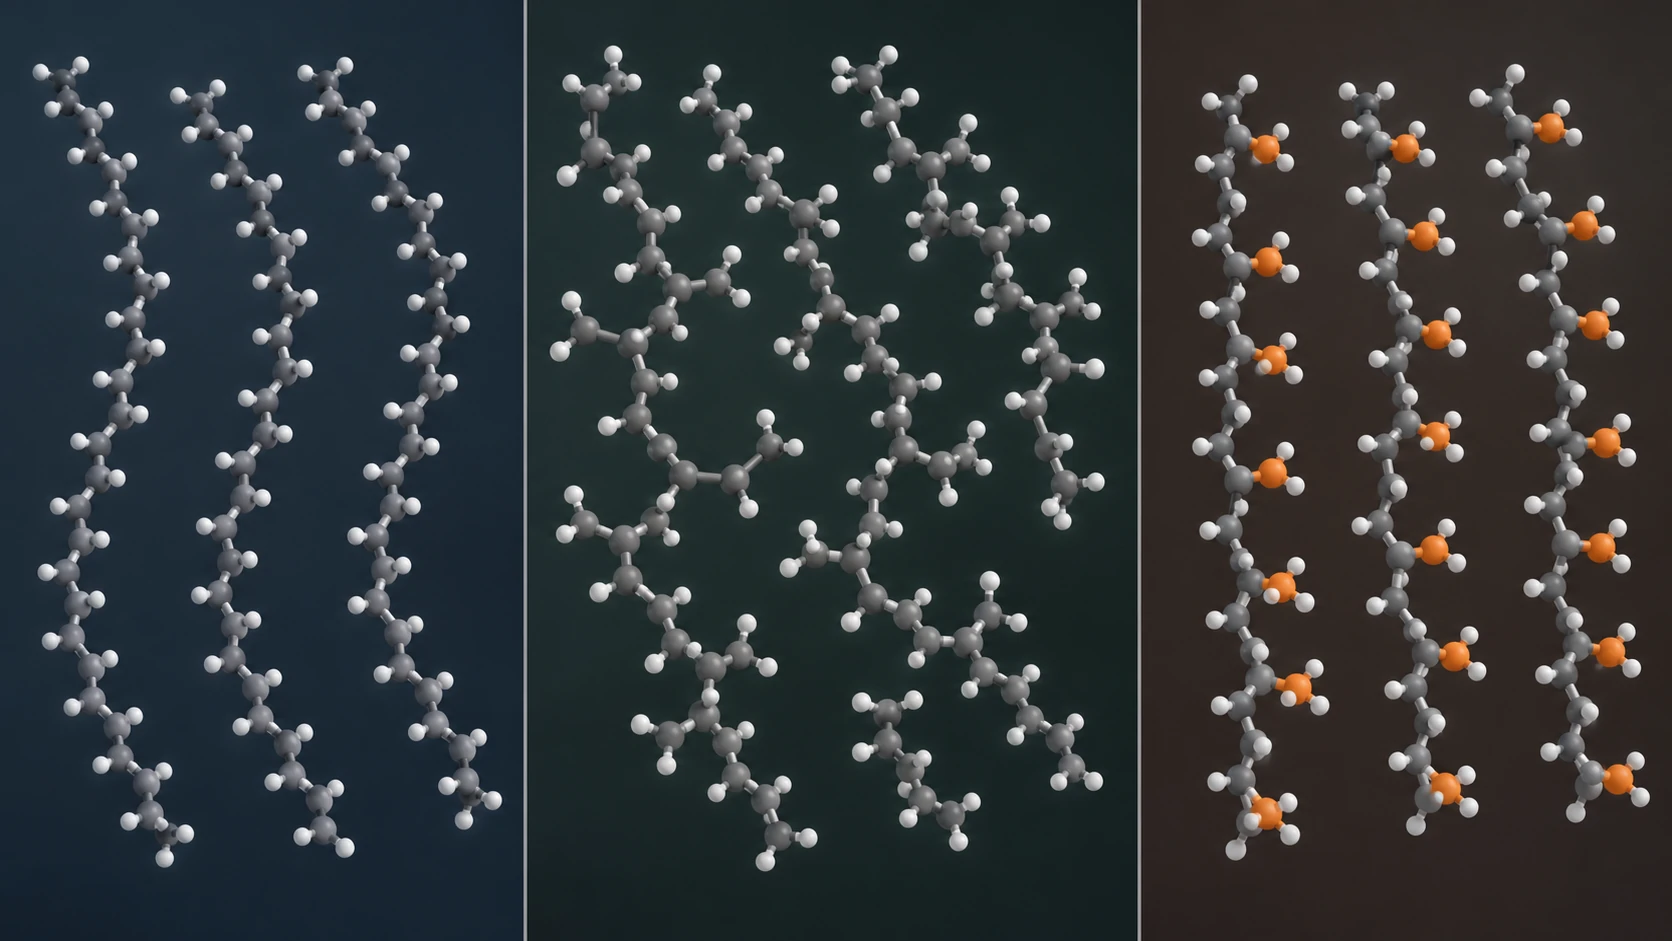
ImageGen conceptual illustration (not a real photograph or measurement). See the original diagram for exact values, names and structure.
Show original diagram with exact annotations and values
| Type | Chain shape | Crystals formed and character | Main route of manufacture (Commentary) |
|---|---|---|---|
| HDPE (high-density polyethylene) | Nearly linear | Crystallises readily and is dense. High stiffness and chemical resistance | Coordination polymerisation (Ziegler–Natta, Phillips-type chromium oxide catalyst, metallocene) |
| LDPE (low-density polyethylene) | Long-chain branches plus short-chain branches | Crystallises with difficulty; transparent and flexible. High melt tension | High-pressure radical polymerisation |
| LLDPE (linear low-density PE) | Linear chain with short branches (from the comonomer) | Density can be designed through the amount of branching. High puncture strength and toughness | Coordination polymerisation (copolymerisation of ethylene and an α-olefin) |
| PP (polypropylene) | Linear chain with aligned methyl groups | Isotactic PP is crystalline and has a higher melting point than PE | Coordination polymerisation (Ziegler–Natta, metallocene) |
This is a general summary of polymer chemistry (Commentary). That isotactic polypropylene is crystalline was reported by Natta et al. in J. Am. Chem. Soc. in 1955Sourced [Reference 7].
Looking at the values of real grades (manufacturer's stated typical values)
Taking technical data sheets published by ExxonMobil, here are typical values for grades matching the four types. These are grades for different applications placed side by side, and no ranking is implied. Test methods differ by grade, and the data sheets state that the values are typical and "not to be construed as specifications"Sourced.
| Grade (type) | Density | MFR / MI | Melting temperature | Data sheet date |
|---|---|---|---|---|
| HD 6582 Series (HDPE homopolymer) | 0.965 g/cm³ (ASTM D1505) | MI 8.2 g/10 min (190 °C / 2.16 kg, ASTM D1238) | Peak 135 °C (ExxonMobil Method) | 13 March 2015 |
| LD 2023 Series (LDPE) | 0.923 g/cm³ (ASTM D1505) | MI 2.0 g/10 min (190 °C / 2.16 kg, ASTM D1238) | Peak 110 °C (ExxonMobil Method) | 18 August 2022 |
| Exceed m 1018.RJ (metallocene LLDPE, ethylene / 1-hexene copolymer) | 0.918 g/cm³ (ASTM D792) | MI 1.0 g/10 min (190 °C / 2.16 kg, ASTM D1238) | Peak 118 °C (ExxonMobil Method) | 19 April 2024 |
| PP1013H1 (PP homopolymer) | 0.900 g/cm³ (ExxonMobil Method) | MFR 7.5 g/10 min (230 °C / 2.16 kg, ISO 1133) | 164 °C (ISO 11357-3) | 11 June 2026 |
All of this is Sourced (manufacturer's stated typical values from the ExxonMobil technical data sheets [References 10 to 13]). MFR is conventionally measured at 190 °C for PE and 230 °C for PP, but values measured at different temperatures and loads cannot be compared. The melting temperature uses a proprietary method for PE and ISO 11357-3 for PP, so the methods differ.
For specifying materials, the standards provide designation systems. ISO 17855-1:2014 defines a designation system for PE applying to ethylene homopolymers and to ethylene copolymers with less than 50% by mass of other 1-olefins (with up to 3% by mass of monomers carrying non-olefinic functional groups)Sourced. ISO 19069-1:2015 defines for PP a classification system that uses tensile modulus, impact strength and melt mass-flow rate (MFR) as the specifying indicatorsSourced. The way to measure MFR is specified in ISO 1133-1:2022Sourced. All of these are frameworks for specifying a material by numbers, in the same spirit as the "set of four" in Section 1.
4. Our calculation: estimating crystallinity from density
The density of a semicrystalline polymer lies between the densities of its crystalline and amorphous parts. So if we assume that the crystalline and amorphous parts each have a fixed density (a two-phase model), the crystallinity (as a mass fraction) can be estimated from the overall density. ISO 1183-1:2025 specifies methods for measuring the density of non-cellular plastics by immersion, pycnometer and titrationSourced.
Estimating crystallinity from densityOur calculation.
- Equation: crystallinity = (1/ρa − 1/ρ) / (1/ρa − 1/ρc) (ρ: density of the sample, ρa: density of the amorphous part, ρc: density of the crystalline part)
- Assumptions: ρc = 1.00 g/cm³ and ρa = 0.855 g/cm³. For ρc, a report from the NBS (now NIST) [Reference 14] mentions that the crystallographic density of polyethylene is close to 1.00 g/cm³Sourced. ρa is an assumption set by this article, and the literature gives a range of roughly 0.85 to 0.86 g/cm³
- HD 6582 (ρ = 0.965) → about 79% (78.6%)
- LD 2023 (ρ = 0.923) → about 51% (50.8%)
- Exceed m 1018.RJ (ρ = 0.918) → about 47% (47.3%)
Assumptions and limits: in reality there is an interfacial phase between crystal and amorphous, and the two-phase model is an approximation. The NBS report also shows that measurements on polyethylene crystals grown from solution came out near 0.98 g/cm³, lower than 1.00 g/cm³, so the result also moves with the choice of ρc. It does not agree with crystallinity found by DSC or X-ray methods. The calculation is to catch the trend.
5. A materials engineer's view (1): the "amount" and the "thickness" of crystals are different quantities
Fig. 3 raises a question. LDPE (density 0.923) is denser than metallocene LLDPE (density 0.918), so it should have more crystal. Yet the manufacturer's stated melting peaks are the other way round: 110 °C for LDPE and 118 °C for metallocene LLDPESourced (ExxonMobil Method; conditions differ by grade, so these are reference values).
This is because the amount of crystal (seen in density) and the thickness and perfection of the crystals (seen in melting point) are different quantities (our commentary).
- Crystallinity (density) is the fraction of chains that are crystalline. More branching or comonomer leaves more chains unable to crystallise and lowers it
- Melting point depends strongly on the thickness of the crystal lamellae. The thicker and more perfect the lamella, the higher the temperature up to which it survives
- In LDPE, long-chain branches get in the way of crystallisation, and the lamellae tend to be thin. In metallocene LLDPE, the short branches enter the chain uniformly, so the linear segments that crystallise readily are relatively uniform — that is one possible explanation (Commentary; the structure of the individual grades was not checked)
In terms of metal microstructure, it is close to looking separately at "the volume fraction of precipitates" and "the stability of the grain boundaries". Do not infer the melting point from the datasheet density alone, or the density from the melting point alone; that is the basic rule when comparing PE materials.
6. Catalysts — from Ziegler–Natta to metallocene
The design of polyolefins is also a history of catalysts.
- 1950s: Ziegler–Natta catalysts. Ziegler et al. reported the polymerisation of ethylene and other olefins in Angewandte Chemie in 1955Sourced, and Natta et al. reported crystalline polymers of α-olefins in J. Am. Chem. Soc. the same yearSourced. The 1963 Nobel Prize in Chemistry was awarded to Ziegler and Natta for their discoveries in the field of the chemistry and technology of high polymersSourced
- 1980: much higher activity from homogeneous catalysts. Sinn, Kaminsky and co-workers reported that a Ziegler-type catalyst made of Cp₂ZrMe₂ and an aluminoxane ([Al(Me)O]n) gave at least 10,000 polyethylene molecules per zirconium atom, with molecular weights in the range of 100,000 to 200,000 depending on conditionsSourced
- 1995: a review. Brintzinger et al. summarise that, unlike heterogeneous Ziegler–Natta catalysts, homogeneous metallocene catalysts polymerise mainly at one kind of metal centre, so the structure of the catalyst can be related to polymer properties such as molecular weight, stereochemistry, crystallisation behaviour and mechanical properties. They add that regioselectivity, tacticity, molecular weight, molecular weight distribution and comonomer incorporation can be controlled efficiently, and that this also opens the way to copolymers of cyclic olefins and to functionalised polyolefinsSourced
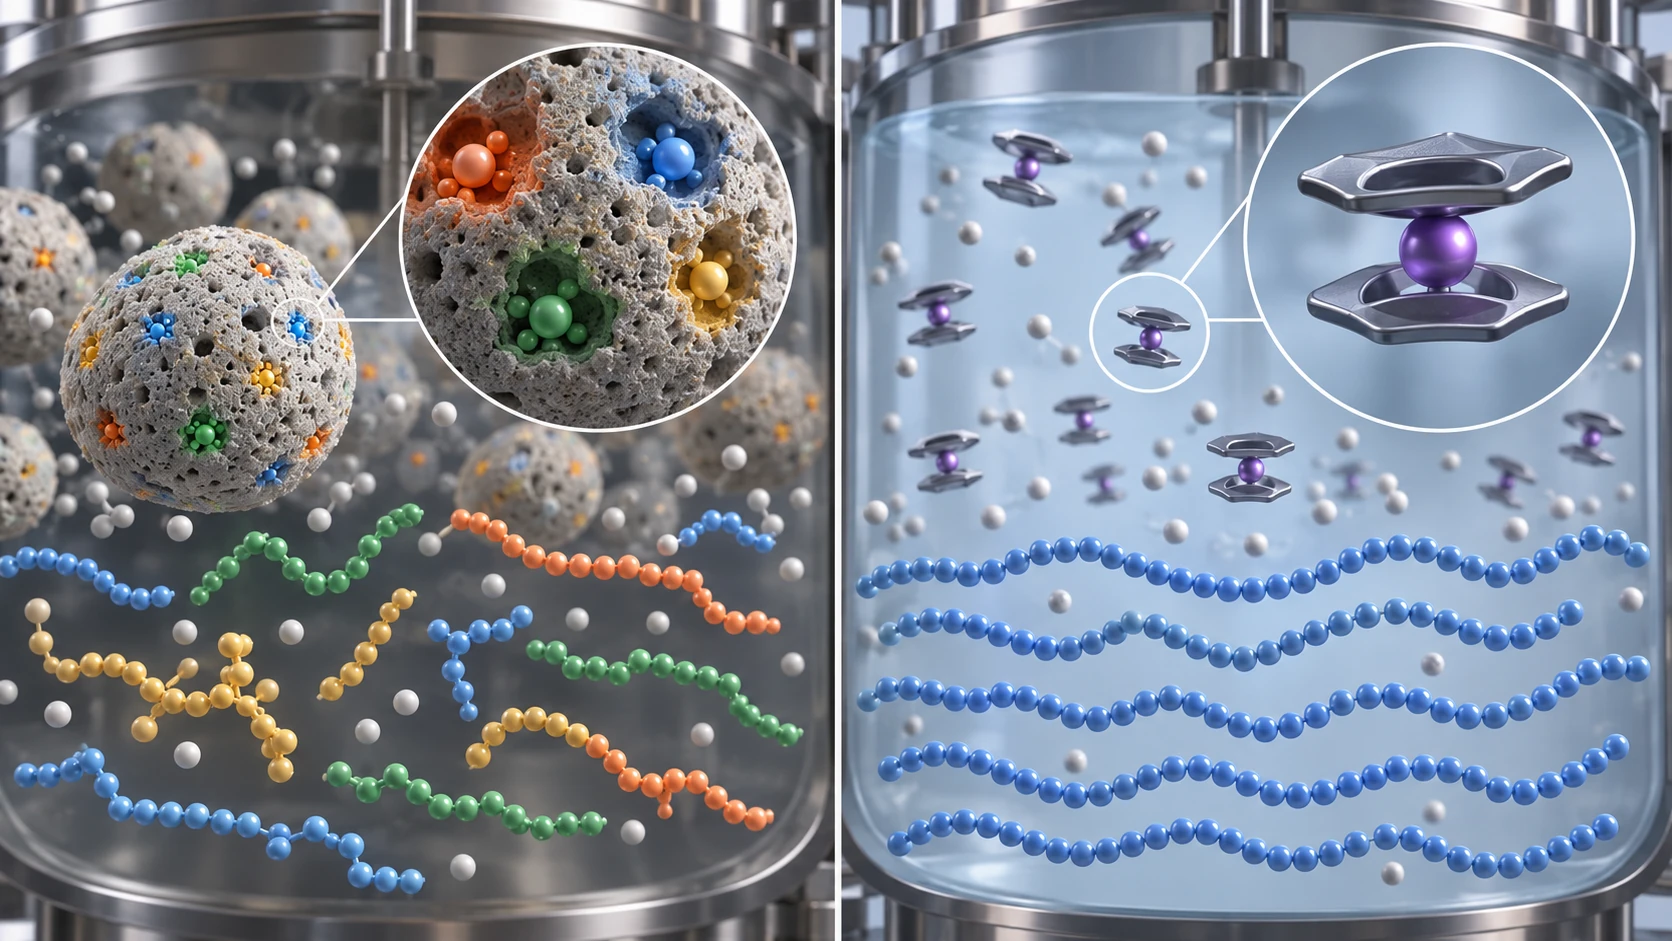
ImageGen conceptual illustration (not a real photograph or measurement). See the original diagram for exact values, names and structure.
Show original diagram with exact annotations and values
| Type of catalyst | Active sites | Molecular weight distribution and comonomer distribution obtained (Commentary) | Freedom of design |
|---|---|---|---|
| Ziegler–Natta (heterogeneous) | Active sites of differing character coexist on a solid surface | Broad molecular weight distribution. Comonomer tends to enter unevenly, depending on molecular weight and chain | Much is tuned through process and catalyst improvements. The mainstay of mass production |
| Metallocene (homogeneous, single-site) | Almost one kind of metal centre | Narrow molecular weight distribution; comonomer tends to enter the chain uniformly | Tacticity, molecular weight and comonomer incorporation are designed through the ligand structure [Reference 9] |
| High-pressure radical (LDPE) | No concept of an active site; free radicals | Many long-chain branches form; broad distribution | Tuned through temperature, pressure and initiator |
The grouping of catalyst types is textbook content (Commentary). What the review by Brintzinger et al. [Reference 9] supports is the single-site character and controllability of metallocenes; the properties of the other types are a general summary.
The point about metallocenes is that because there is one kind of active site, designing the molecular structure of the catalyst is directly designing the polymer structure. In battery materials, it is close to being able to control crystal structure and particle size one at a time (our commentary).
- PE: if a comonomer (hexene and the like) can be placed uniformly in the chain, the distribution of crystal thickness and toughness changes even at the same density. That the Exceed in Fig. 3 shows a higher melting peak than the LDPE is thought to be a result of this (Commentary)
- PP: tacticity can be controlled through the ligand structure (the control of tacticity mentioned in the abstract of Brintzinger et al.). Tacticity decides crystallinity (Section 3)
- The price: if the molecular weight distribution is too narrow, melt viscosity falls less in the high-shear range and processing can be harder. That is why designs that deliberately broaden the distribution (bimodal and so on) are also used (Commentary)
7. A materials engineer's view (2): melting point and heat resistance under load are different things
The data sheet for PP1013H1 (manufacturer's stated values) gives a melting temperature of 164 °C (ISO 11357-3). The same sheet, however, gives a deflection temperature under load of 80.5 °C at 0.45 MPa (ISO 75-2/B) and 53.6 °C at 1.80 MPa (ISO 75-2/A). The Vicat softening temperature is 154 °C (ISO 306/A50)Sourced.
The same is true of HDPE (HD 6582): against a melting peak of 135 °C, the deflection temperature under load is 87 °C at 66 psi (about 0.455 MPa) and 49 °C at 264 psi (about 1.82 MPa) (ASTM D648)Sourced. Because the test standards differ, no numerical comparison with PP is made.
The reason lies in the semicrystalline structure, with crystalline and amorphous regions mixed, that we saw in Sections 3 to 5 (our commentary). Crystals survive up to the melting point, but the amorphous regions between the crystals soften once past the glass transition temperature. When a load is applied, the amorphous regions deform first. Reading "usable up to that temperature" from the melting point in a catalogue leads to design errors. This is the same view as the discussion of deflection temperature under load in the series article on thermoplastics and thermosets.
Countermeasures include reinforcing with glass fibre or the like, nucleating to increase the crystals, and, for PP, choosing a grade with a higher melting point (Commentary).
8. Applications — how manufacturers say the grades are used
The applications the ExxonMobil data sheets list for each grade are as follows. They show clearly how use differs by typeSourced.
| Grade (type) | Applications listed in the data sheet | Data sheet description (summary) |
|---|---|---|
| LD 2023 Series (LDPE) | Coextrusion film, laminating film, food packaging, display packaging, form-fill-seal bags | Good optical properties and sealability. Made to a narrow specification suited to the high consistency needed in laminating films |
| Exceed m 1018.RJ (metallocene LLDPE) | Blown film, stretch film, heavy-duty bags, refuse sacks, freezer film, stand-up pouches and others | Excellent tensile, impact and puncture performance, supporting downgauging (thinner walls). Fluoropolymer and TNPP are not intentionally added |
| HD 6582 Series (HDPE) | Cases, crates, hot-fill pallets, logistics goods, tote boxes, structural foam products | Very high stiffness. A good balance of processability and low-temperature impact |
| PP1013H1 (PP homopolymer) | Laboratory ware, medical packaging, medical and healthcare. Injection moulding | Meets the certification requirements for medical and pharmaceutical uses. Low extractables; can be autoclaved and sterilised with EtO or steam |
All of this is Sourced (summarising the ExxonMobil data sheets; sources are References 10 to 13). Grade names are the manufacturer's trademarks.
Rereading the uses of the four types in terms of properties gives the following (our commentary).
- Film is the world of PE: flexibility, puncture strength, sealability and optical properties overlap. The melt tension of LDPE and the toughness of LLDPE are often combined
- Rigid mouldings are HDPE and PP: a balance of stiffness, chemical resistance and heat resistance. In medical uses that need sterilisation, the heat resistance of PP matters
- The language of "safety": data sheets say "low extractables" or "sterilisable", but these are assessments of individual products and not a guarantee of the safety of polyolefins in general. Food-contact and medical uses are decided by regulation and by conformity checks on individual products
9. Where recycling stands
Recycling figures for polyolefins differ by statistic in "what is being counted". First, here they are with their definitions.
| Source | Figure | Definition and scope |
|---|---|---|
| Plastic Waste Management Institute (Japan, 2024) | Of total waste plastic discharge of 9.11 million t, polyethylene 2.77 million t (30.4%) and polypropylene 2.04 million t (22.4%). Together 4.81 million t (about 52.8%) | Breakdown of waste plastics by resin, in five categories (PE, PP, PVC, polystyrenes, other). The sum is our addition |
| Same | For waste plastics as a whole: material recycling 20%, chemical recycling 3%, thermal recycling 67%, effective utilisation rate 89% | A figure for the whole, not by resin. Thermal recycling includes incineration with power generation and conversion to solid fuel or cement raw material/fuel. Effective utilisation rate = effective utilisation volume / total waste plastic discharge |
| Eurostat (EU, 2023) | 42.1% of plastic packaging waste was recycled. Generated 35.3 kg per person, recycled 14.8 kg | Calculated under Article 6(1)(g) of the Packaging Directive. Covers packaging waste generated across the whole economy, including households, business and government. Not a figure by resin |
| Plastics Europe (world, 2024) | 9.5% of world production of 430.9 Mt comes from mechanical recycling (post-consumer) and 0.1% from chemical recycling | The share of recycled material in production. A note says mechanical and chemical cannot be shown separately |
All of this is Sourced (PWMI [Reference 2], Eurostat [Reference 3], Plastics Europe [Reference 1]). Because the definitions of the statistics differ, the figures cannot be compared directly or combined into a single "recycling rate".
In the EU, the Packaging and Packaging Waste Regulation (Regulation (EU) 2025/40, PPWR) applies from 12 August 2026Sourced. Article 7 sets the minimum share of recycled content derived from post-consumer plastic waste that the plastic part of plastic packaging must contain, as an average per manufacturing plant per year. From 1 January 2030 (or three years after the entry into force of the implementing act, whichever is later), the shares are 30% for contact-sensitive packaging made of PET, 10% for contact-sensitive packaging made of materials other than PET, 30% for single-use plastic beverage bottles, and 35% for all other plastic packaging. By 1 January 2040 they rise to 50%, 25%, 65% and 65% respectivelySourced.
The technical points about the quality of recycled material are as follows.
- Schyns and Shaver review the mechanical recycling of five major packaging plastics — PET, polyethylene, polypropylene, polystyrene and vinyl chloride resin — and state that cost, degradation of mechanical properties and non-uniform quality are the present constraints. They also touch on methods to improve polymer blends in mixed waste and on uses for low-quality recycled materialSourced
- Patel et al. show that in reprocessing high-density polyethylene, main-chain scission dominates at first and long-chain branching dominates as exposure to oxygen increases, and, through rheological simulation, show the possibility of a method for assessing the quality of post-consumer recycled materialSourced
- ISO 18263-1:2015 sets the basis of a designation system and specifications for mixtures of PP and PE recyclate used for flexible and rigid consumer packagingSourced. It is a standard that presupposes that recyclate in which PE and PP are mixed is actually in circulation (Commentary)
10. A materials engineer's view (3): three problems facing polyolefin recycling
Compared with a resin like PET, which has a clear route to recycling (bottle to bottle and so on), the problems of polyolefins are of a different character (our commentary).
- (1) Similar things get mixed: PE and PP are close in appearance and specific gravity and hard to separate even with sorting machines. They also mix poorly with each other, and mixed recyclate tends to lose mechanical properties. That ISO 18263-1 provides a standard for mixtures is because mixing is the reality
- (2) Degradation does not go in one direction: the results of Patel et al. show that even in the same HDPE, early scission (molecular weight falls) competes with long-chain branching in the presence of oxygen (viscosity and elasticity rise). The quality of recyclate cannot be explained by "molecular weight fell" alone. Judging quality by MFR (flow at a single point) alone misses the difference between scission and branching (the same pattern as "MFR does not show the shape of the distribution" in the series article on polymer basics)
- (3) The wall of contact-sensitive uses: that the PPWR sets the recycled share required for contact-sensitive packaging other than PET at 10% in 2030, lower than the 35% for other packaging, can be read as reflecting the difficulty of using recycled polyolefins in food contact and similar uses (Commentary; the regulation does not give the reason in the numbers of the text itself)
Chemical recycling (returning the material to feedstock by pyrolysis and similar methods) does not proceed under the mild conditions possible for PET depolymerisation, because the main chain consists only of carbon–carbon single bonds. This point is covered in detail in the series article on chemical recycling.
11. Open issues, and what this article could not confirm
(1) Japanese production of PE by type
Japanese domestic production of HDPE, LDPE and LLDPE by type could not be confirmed in public statistics within the scope of this article. The Plastic Waste Management Institute presents polyethylene as a single category.
(2) Recycling rates by resin
Japanese statistics give the breakdown of waste plastics by resin, but do not give recycling rates for polyethylene and polypropylene separately. EU statistics are rates for packaging as a whole, not by resin. This article does not manufacture a figure such as "the recycling rate of polyolefins is X%".
(3) Comparison of grade values
The table in Section 3 gives typical values for grades with different test methods and different applications, so the performance of the types cannot be compared with one another. The test method for the melting peak (a proprietary ExxonMobil method) is also not a standard method.
(4) The text of the original catalyst papers
For Ziegler (1955), Natta (1955), Sinn and Kaminsky (1980) and Brintzinger (1995), bibliographic details and abstracts (where available) were checked. The text of the original papers was not read. In particular, no abstract of the paper by Ziegler et al. could be found, so only the title and the fact of publication are given.
(5) Applying the PPWR categories
Which packaging counts as "contact-sensitive" and similar definitions are fixed by the text and annexes of the regulation and by implementing acts. This article limits itself to transcribing the numbers in the text and does not apply them to individual products.
- PE and PP make up 45.0% of world plastics production (about 193.9 Mt). In Japan it is about 45.4%SourcedOur calculation
- The single word "PE" does not specify a material. It is set by density, MFR, type of catalyst and comonomer. Crystallinity estimated from density was about 79% for HDPE and about 51% for LDPEOur calculation
- The amount of crystal (density) and its thickness (melting point) are different quantities. There is an LDPE grade with a higher density but a lower melting peakSourced
- The point about metallocene is that there is one kind of active site. Designing the catalyst becomes designing the polymer structureSourced
- Melting point is not heat resistance under load. PP1013H1 melts at 164 °C, yet its deflection temperature under load is 80.5 °C (0.45 MPa)Sourced
- Read recycling figures by their definitions. For plastic packaging in the EU it is 42.1% (2023), and most of Japan's 89% effective utilisation rate is heat recoverySourced. The PPWR asks for 35% recycled content in other packaging in 2030Sourced
12. Glossary
- Olefin
- A hydrocarbon with a carbon double bond, such as ethylene and propylene.
- HDPE / LDPE / LLDPE
- High-density / low-density / linear low-density polyethylene, distinguished by type of branching.
- Long-chain / short-chain branch
- A long / short branch on the main chain (from a comonomer, for example).
- Comonomer
- A second monomer polymerised together with the main monomer, such as the hexene in LLDPE.
- Tacticity
- The regularity of the arrangement of side groups. Isotactic means they all lie on the same side.
- Ziegler–Natta catalyst
- A coordination polymerisation catalyst made of a transition metal compound and an organoaluminium compound. Discovered in the 1950s.
- Metallocene catalyst
- A metal complex with cyclopentadienyl-type ligands. Single-site, so the structure is easy to design.
- MAO (methylaluminoxane)
- A co-catalyst that activates metallocenes. Combined with Cp₂ZrMe₂ it showed high activity.
- MI / MFR
- Melt index / melt mass-flow rate. Ease of flow at a fixed temperature and load.
- Two-phase model
- An approximation that treats the crystalline and amorphous parts as each having a fixed density, in order to estimate the overall crystallinity.
- Deflection temperature under load (HDT / DTUL)
- The temperature at which a specimen deflects by a set amount under a fixed load and fixed heating rate. Not the maximum service temperature.
- PPWR
- The EU Packaging and Packaging Waste Regulation (Regulation (EU) 2025/40).
- Contact-sensitive packaging
- A PPWR term. Packaging that comes into contact with food and the like and is subject to limits on recycled content (the definition is in the text of the regulation).
- Mechanical recycling
- Recycling that makes resin again by grinding, washing and remelting.
13. References (primary sources)
- Plastics Europe "Plastics the Fast Facts 2025", October 2025 (provisional figures for 2024, PDF) — https://plasticseurope.org/wp-content/uploads/2025/09/PE_TheFacts_25_digital-1pager-scrollable.pdf
- Plastic Waste Management Institute (PWMI, Japan) "Material flow diagram 2024: production, disposal, recycling and treatment of plastic products" (in Japanese), December 2025 (PDF) — https://www.pwmi.or.jp/pdf/panf2.pdf
- Eurostat "Plastic packaging waste in the EU: 35.3 kg per person", 22 October 2025 — https://ec.europa.eu/eurostat/web/products-eurostat-news/w/ddn-20251022-1
- European Union Regulation (EU) 2025/40 on packaging and packaging waste (19 December 2024; Official Journal 22 January 2025) — https://eur-lex.europa.eu/legal-content/EN/TXT/HTML/?uri=OJ:L_202500040
- Nobel Prize "The Nobel Prize in Chemistry 1963" — https://www.nobelprize.org/prizes/chemistry/1963/summary/
- Ziegler et al. "Polymerisation von Äthylen und anderen Olefinen", Angew. Chem. 67, 426 (1955) — https://doi.org/10.1002/ange.19550671610
- Natta et al. "Crystalline high polymers of α-olefins", J. Am. Chem. Soc. 77, 1708–1710 (1955) — https://doi.org/10.1021/ja01611a109
- Sinn, Kaminsky, Vollmer "“Living polymers” on polymerization with extremely productive Ziegler catalysts", Angew. Chem. Int. Ed. Engl. 19, 390–392 (1980) — https://doi.org/10.1002/anie.198003901
- Brintzinger, Fischer, Mülhaupt, Rieger, Waymouth "Stereospecific olefin polymerization with chiral metallocene catalysts", Angew. Chem. Int. Ed. Engl. 34, 1143–1170 (1995) — https://doi.org/10.1002/anie.199511431
- ExxonMobil Chemical Product Datasheet "ExxonMobil™ LD 2023 Series" (revision date 18 August 2022, manufacturer's stated typical values) — https://www.exxonmobilchemical.com/en/chemicals/webapi/dps/v1/datasheets/150000000512/0/en
- ExxonMobil Chemical Product Datasheet "Exceed™ m 1018.RJ" (revision date 19 April 2024, manufacturer's stated typical values) — https://www.exxonmobilchemical.com/en/chemicals/webapi/dps/v1/datasheets/150000104563/0/en
- ExxonMobil Chemical Product Datasheet "ExxonMobil™ HD 6582 Series" (revision date 13 March 2015, manufacturer's stated typical values) — https://www.exxonmobilchemical.com/en/chemicals/webapi/dps/v1/datasheets/150000000413/0/en
- ExxonMobil Chemical Product Datasheet "ExxonMobil™ PP1013H1" (revision date 11 June 2026, manufacturer's stated typical values) — https://www.exxonmobilchemical.com/en/chemicals/webapi/dps/v1/datasheets/150000000280/0/en
- NBS (now NIST) Martin, Passaglia, "Density of polyethylene crystals grown from solution", J. Res. Natl. Bur. Stand. 70A, 3 (1966) — https://nvlpubs.nist.gov/nistpubs/jres/070/3/V70.N03.A02.pdf
- ISO ISO 1183-1:2025 "Plastics — Methods for determining the density of non-cellular plastics — Part 1" — https://www.iso.org/standard/85977.html
- ISO ISO 17855-1:2014 "Plastics — Polyethylene (PE) moulding and extrusion materials — Part 1" — https://www.iso.org/standard/60831.html
- ISO ISO 19069-1:2015 "Plastics — Polypropylene (PP) moulding and extrusion materials — Part 1" — https://www.iso.org/standard/63872.html
- ISO ISO 11357-3:2025 "Plastics — Differential scanning calorimetry (DSC) — Part 3" — https://www.iso.org/standard/11357-3
- ISO ISO 18263-1:2015 "Plastics — Mixtures of polypropylene (PP) and polyethylene (PE) recyclate derived from PP and PE used for flexible and rigid consumer packaging — Part 1" — https://www.iso.org/standard/61908.html
- Schyns, Shaver "Mechanical recycling of packaging plastics: a review", Macromol. Rapid Commun. 42(3), 2000415 (published online 2020) — https://doi.org/10.1002/marc.202000415
- Patel et al. "Defining quality by quantifying degradation in the mechanical recycling of polyethylene", Nat. Commun. 15, 8733 (2024) — https://doi.org/10.1038/s41467-024-52856-8
- ISO ISO 1133-1:2022 "Plastics — Determination of the melt mass-flow rate (MFR) and melt volume-flow rate (MVR) of thermoplastics — Part 1" — https://www.iso.org/standard/83905.html
14. Claim-to-source audit
| Claim in the text | Basis | Type |
|---|---|---|
| World plastics production of 430.9 Mt (2024). PP 19.0%, PE-LD and LLD 13.9%, PE-HD and MD 12.1%, PVC 12.8%, recycled (post-consumer, mechanical) 9.5%, other thermosets 8.3%, other thermoplastics 7.1%, PET 6.2%, PUR 5.3%, PS 5.1%. 0.1% from chemical recycling. That adhesives, paints and some fibres are excluded from the scope | Plastics Europe, "Plastics the Fast Facts 2025"Reference 1 https://plasticseurope.org/wp-content/uploads/2025/09/PE_TheFacts_25_digital-1pager-scrollable.pdf | Sourced |
| Of Japan's 8.53 million t of resin production in 2024, polyethylene 1.94 million t (22.7%) and polypropylene 1.93 million t (22.7%). Of 9.11 million t of total waste plastic discharge, polyethylene 2.77 million t (30.4%) and polypropylene 2.04 million t (22.4%). Material 20%, chemical 3%, thermal 67%, effective utilisation rate 89% | PWMI material flow diagram 2024Reference 2 https://www.pwmi.or.jp/pdf/panf2.pdf | Sourced |
| In the EU in 2023, 42.1% of plastic packaging waste was recycled. Generated 35.3 kg per person, recycled 14.8 kg. Calculated under Article 6(1)(g) of the Packaging Directive, covering packaging waste across the whole economy | Eurostat news articleReference 3 https://ec.europa.eu/eurostat/web/products-eurostat-news/w/ddn-20251022-1 | Sourced |
| Regulation (EU) 2025/40, Article 7: in 2030 (1 January 2030 or three years after the entry into force of the implementing act, whichever is later) 30% for PET contact-sensitive, 10% for non-PET contact-sensitive, 30% for single-use beverage bottles, 35% for others. In 2040, 50%, 25%, 65% and 65%. Averages per manufacturing plant per year. Applies from 12 August 2026 | Text of the regulation on EUR-Lex (Article 7(1) and (2), Article 71), checked by opening it in a browserReference 4 https://eur-lex.europa.eu/legal-content/EN/TXT/HTML/?uri=OJ:L_202500040 | Sourced |
| That the 1963 Nobel Prize in Chemistry was awarded to Ziegler and Natta for discoveries in the field of the chemistry and technology of high polymers | Official Nobel Prize pageReference 5 https://www.nobelprize.org/prizes/chemistry/1963/summary/ | Sourced |
| That Ziegler et al. published "Polymerisation von Äthylen und anderen Olefinen" in Angewandte Chemie in 1955 (abstract not checked) | Bibliographic details (Crossref and publisher page)Reference 6 https://doi.org/10.1002/ange.19550671610 | Sourced |
| That Natta et al. reported crystalline polymers of α-olefins in J. Am. Chem. Soc. in 1955. That isotactic PP is crystalline | Title and bibliographic details (Crossref). The text was not checkedReference 7 https://doi.org/10.1021/ja01611a109 | Sourced |
| That with a catalyst of Cp₂ZrMe₂ and aluminoxane at least 10,000 PE molecules were obtained per Zr atom, with molecular weights of 100,000 to 200,000 | Abstract of the paper by Sinn et al.Reference 8 https://doi.org/10.1002/anie.198003901 | Sourced |
| That with homogeneous metallocene catalysts polymerisation occurs mainly at one kind of metal centre. That catalyst structure can be related to molecular weight, stereochemistry, crystallisation behaviour and mechanical properties. That regioselectivity, tacticity, molecular weight, molecular weight distribution and comonomer incorporation can be controlled | Abstract of the review by Brintzinger et al.Reference 9 https://doi.org/10.1002/anie.199511431 | Sourced |
| LD 2023 Series: density 0.923 g/cm³ (ASTM D1505), MI 2.0 g/10 min (190 °C / 2.16 kg, ASTM D1238), peak melting temperature 110 °C (ExxonMobil Method). Applications and description. The data sheet's statement that the values are typical and not specifications | ExxonMobil data sheet (18 August 2022)Reference 10 https://www.exxonmobilchemical.com/en/chemicals/webapi/dps/v1/datasheets/150000000512/0/en | Sourced |
| Exceed m 1018.RJ: ethylene / 1-hexene copolymer, density 0.918 g/cm³ (ASTM D792), MI 1.0 g/10 min, peak melting temperature 118 °C (ExxonMobil Method). Applications. That fluoropolymer and TNPP are not intentionally added | ExxonMobil data sheet (19 April 2024)Reference 11 https://www.exxonmobilchemical.com/en/chemicals/webapi/dps/v1/datasheets/150000104563/0/en | Sourced |
| HD 6582 Series: density 0.965 g/cm³ (ASTM D1505), MI 8.2 g/10 min, peak melting temperature 135 °C (ExxonMobil Method), DTUL 87 °C at 66 psi and 49 °C at 264 psi (ASTM D648). Applications | ExxonMobil data sheet (13 March 2015)Reference 12 https://www.exxonmobilchemical.com/en/chemicals/webapi/dps/v1/datasheets/150000000413/0/en | Sourced |
| PP1013H1: MFR 7.5 g/10 min (230 °C / 2.16 kg, ISO 1133), density 0.900 g/cm³, melting temperature 164 °C (ISO 11357-3), deflection temperature under load 80.5 °C (0.45 MPa, ISO 75-2/B) and 53.6 °C (1.80 MPa, ISO 75-2/A), Vicat 154 °C (ISO 306/A50). Applications | ExxonMobil data sheet (11 June 2026)Reference 13 https://www.exxonmobilchemical.com/en/chemicals/webapi/dps/v1/datasheets/150000000280/0/en | Sourced |
| That the crystallographic density of polyethylene is close to 1.00 g/cm³. That measurement on crystals grown from solution came out near 0.98 g/cm³ | Report by Martin and Passaglia, NBS (now NIST)Reference 14 https://nvlpubs.nist.gov/nistpubs/jres/070/3/V70.N03.A02.pdf | Sourced |
| That ISO 1183-1:2025 specifies methods of measuring density by immersion, pycnometer and titration | Title and scopeReference 15 https://www.iso.org/standard/85977.html | Sourced |
| The scope of the PE designation system in ISO 17855-1:2014 (homopolymers and copolymers with less than 50% by mass of other 1-olefins, with up to 3% by mass of monomers with non-olefinic functional groups) | Title and scopeReference 16 https://www.iso.org/standard/60831.html | Sourced |
| That ISO 19069-1:2015 classifies PP by tensile modulus, impact strength and MFR | Title and scopeReference 17 https://www.iso.org/standard/63872.html | Sourced |
| That ISO 11357-3:2025 specifies the DSC method for the temperature and enthalpy of melting and crystallisation | Title and scopeReference 18 https://www.iso.org/standard/11357-3 | Sourced |
| That ISO 18263-1:2015 sets the basis of a designation system and specifications for mixtures of PP and PE recyclate | TitleReference 19 https://www.iso.org/standard/61908.html | Sourced |
| The constraints on mechanical recycling of five major packaging plastics (cost, degradation of mechanical properties, non-uniform quality). That it also touches on improving blends of mixed waste and on uses for low-quality recycled material | Abstract of the review by Schyns and ShaverReference 20 https://doi.org/10.1002/marc.202000415 | Sourced |
| In reprocessing HDPE, main-chain scission dominates at first and long-chain branching dominates as oxygen increases. The possibility of assessing recyclate quality by rheological simulation | Abstract of Patel et al.Reference 21 https://doi.org/10.1038/s41467-024-52856-8 | Sourced |
| That ISO 1133-1:2022 specifies the measurement of MFR and MVR at a fixed temperature and load | Title and scopeReference 22 https://www.iso.org/standard/83905.html | Sourced |
| The PE and PP total of 45.0% and about 193.9 Mt; Japan's 3.87 million t and about 45.4%; the PE plus PP total of 4.81 million t and about 52.8% of waste plastics; a 1% cut equal to about 1.9 Mt; crystallinity from density (about 79%, 51% and 47%) | Our calculation. Assumptions: addition and multiplication of published shares and quantities; the two-phase equation; ρc = 1.00 and ρa = 0.855 g/cm³ (ρa is this article's assumption) | Our calculation |
| The summary of the branching structures of the four types, the properties of each type of catalyst in molecular weight distribution and comonomer distribution, that the amount and thickness of crystals are different quantities, the inference about why the melting points of LDPE and metallocene LLDPE are reversed, the correspondence of PP and PE applications to properties, the summary of three problems in recycling, and the reading of the PPWR numbers | Our commentary, based on the general summary of polymer science and on published values. These are not views expressed by any institution | Commentary |
| Japanese production of HDPE, LDPE and LLDPE by type; recycling rates of PE and PP separately; the text of the original papers of Ziegler, Natta, Sinn and Brintzinger | Not confirmed within the scope of this article | Not yet confirmed |
| That Figs. 1 to 5 are explanatory drawings, data charts or our own calculations, and that the hero image is an AI-generated image | Our note | Commentary |
Last updated 2 October 2026. Sources are limited to primary material (statistics from Plastics Europe, the Plastic Waste Management Institute and Eurostat; the text of EU regulation; manufacturers' technical data sheets; the titles and scopes of standards; and bibliographic details and abstracts of peer-reviewed papers). Because the article includes structural readings and materials-design interpretations, those are marked as Commentary and kept separate from sourced fact. Japanese production of PE by type, recycling rates of PE and PP separately, and the text of the original catalyst papers could not be confirmed and are therefore not stated. The crystallinity in Fig. 3 is a calculation based on the assumption ρa = 0.855 g/cm³. The manufacturers' values are typical values for grades with different applications, and no ranking is implied. All figures are explanatory concept graphics, data charts or our own calculations. Figs. 1 to 5 are vector drawings and the hero image is AI-generated; none of them shows a real molecular structure, measured data or a physical product.