TECHNOLOGY EXPLAINER
Label-Free Detection and the Limit of Detection
— What "No Label" Means, and How to Read a Small Number
Papers and data sheets on biosensors often say things like "label-free detection down to X fM". This article, written for materials engineers, sets out the idea behind label-free detection and where SPR, FETs, impedance and optical sensors sit within it, the definitions of the limit of blank, limit of detection and limit of quantitation (LoB, LoD, LoQ), and what to check when reading such numbers (conditions, sample, statistical definition). It also separates sensitivity from selectivity. It is not medical advice.

- What label-free detection and the limit of detection are, in three lines
- The idea of label-free detection: where SPR, FETs, impedance and optics sit
- Sensitivity and selectivity are different things: three meanings of "sensitivity"
- Definitions of LoB, LoD and LoQ
- Our calculation: the same data give different limits of detection under different conventions
- How to read a limit-of-detection number: conditions, sample, statistics and units
- Our calculation: how many molecules are in a drop?
- A materials engineer's view: the floor of the limit of detection is set by blank variability
- Standards and regulation / strengths and challenges / what we could not confirm
- Glossary / References / Claim-to-source audit
Sourced = stated in published material (source linked)
Our calculation = a value this article derived from explicitly stated assumptions
Not yet confirmed = a plan or target with no confirmed outcome
Materials-design readings are marked Commentary; weakly grounded guesses are marked Inference.
Performance values such as detection limits are given together with what they were compared against, what sample was used, under what conditions and with what statistical definition. Please do not read in vitro results as clinical performance in everyday life. The example numbers in this article (hypothetical data) are not measurements from any real sensor.
1. What label-free detection and the limit of detection are, in three lines
Label-free detection is a method that, without attaching a marker such as a fluorophore or enzyme (a label) to the target, reads the physical change at a surface caused by target binding (refractive index, mass, charge, impedance and so on) directly. The limit of detection is the smallest amount that can be distinguished from "nothing", but there are many ways to define it.
- What label-free means: the review by Fan et al. describes label-free optical biosensors as detecting biomolecules in their natural forms, unlabelled or unmodified, and lists the SPR, interferometer, waveguide, fibre-grating, ring-resonator and photonic-crystal platforms that use refractive-index change as the signalSourced (abstract)
- The reference standard: in clinical laboratory work, CLSI EP17 (second edition, issued 18 June 2012) gives guidance on evaluating detection capability (LoB, LoD, LoQ), verifying manufacturers' claims, and the proper use and interpretation of the estimatesSourced (the CLSI official page)
- The biggest trap: even for the same "label-free, X fM", numbers cannot be compared if the sample (buffer or serum), statistical definition or units differ. Wang et al. say that because the response of a gated semiconductor is nonlinear they cannot state a detection limit in the conventional sense, and give a dynamic range insteadSourced
This article explains how to think about evaluation. It gives no advice to individual readers about diagnosis, treatment or how to read a measured value. It does not rank any particular product or company.
2. The idea of label-free detection: where SPR, FETs, impedance and optics sit
Labelled methods (such as ELISA) read the signal of a label (an enzyme or dye) attached to the target. Label-free methods read the binding of the target to the surface itself as a change in surface properties. Teles' review names as an advantage of label-free formats that they avoid the usual drawback of signal lost through gradual leakage of the labelSourced.
| Format | Origin of the signal | Reported features | Points of care |
|---|---|---|---|
| SPR (surface plasmon resonance) | Change in refractive index near a metal film (the evanescent field extends about 200 nm from the surface) | Used for protein adsorption, antigen-antibody binding, DNA/RNA hybridisation, and measuring binding kinetics and affinity constantsSourced (Grieshaber et al.) | Anything that changes refractive index gives a signal (commentary). See our explainer on SPR in this series |
| Other optical (interferometers, waveguides, fibre gratings, ring resonators, photonic crystals) | Change in refractive index | A review compares the sensitivity and detection limit of each structureSourced (Fan et al.) | The definitions of sensitivity and detection limit may differ between structures (commentary) |
| QCM (quartz crystal microbalance) | A fall in resonant frequency and rise in dissipation on adsorption | Works with virtually any surface coating and gives viscoelastic information about the layer. No label neededSourced (Grieshaber et al.) | The mass measured includes water that moves with the layer, such as the hydration layer of proteinsSourced |
| FET | Change in charge at the gate surface | Small and integrable with electronics | Debye screening. Teles says FET sensors usually achieve only moderate sensitivity because of large fluctuations of the interface potential in waterSourced. See our explainer on FET sensors in this series |
| Impedance | Change in interfacial resistance and capacitance | Low cost, easy to miniaturiseSourced (Daniels and Pourmand) | Slow to measure and hard to interpret. Teles says there may be a market where low cost, portability and speed matter and moderate sensitivity sufficesSourced. See our explainer on impedance measurement in this series |
Grieshaber et al. [Ref. 7], Fan et al. [Ref. 5], Teles [Ref. 8], Daniels and Pourmand (abstract) [Ref. 9]. The parts of "Points of care" marked (commentary) are this article's own grouping.
A label-free method uses as its signal any change that occurs at the surface, not a marker attached to the target. As a result, molecules other than the target also give a signal if they stick (commentary). Daniels and Pourmand state that challenges originating in the affinity-capture step are shared by all label-free affinity biosensorsSourced. Likewise, Lazanas and Prodromidis [Ref. 17] note for impedance-type sensors that non-specific signal changes easily mistaken for specific interactions can occurSourced. Labelled methods, by contrast, can add a second layer of specificity through the label (for example a secondary antibody) (commentary).
3. Sensitivity and selectivity are different things: three meanings of "sensitivity"
IUPAC's recommendation lists the performance criteria for biosensors as including sensitivity, operational and linear range, detection and quantification limits, selectivity, response times, sample throughput, reproducibility, stability and lifetimeSourced (Thévenot et al., abstract). "Sensitivity" and "selectivity" are separate items. And the word "sensitivity" is used in at least three senses.
| Term | Meaning | Typical unit | Source and caution |
|---|---|---|---|
| Sensitivity (analytical) | The slope of the calibration curve: how much the signal changes per unit change of concentration | Signal unit per concentration unit (for example nA/µM) | In the IUPAC terminology, "the slope of the calibration curve"; for a curved calibration it becomes a function of concentrationSourced (IUPAC Gold Book) |
| Limit of detection (LoD) | The smallest amount that can be distinguished from "nothing". A different quantity from sensitivity | Concentration (or amount) | Even with high sensitivity, a large variability of the blank gives a large detection limit (commentary) |
| Selectivity (analytical) | The degree to which a method responds only to what is to be measured and not to other substances | — (for example a ratio of responses to interferents) | The IUPAC terminology has an entry "analytical selectivity"Sourced. For electrochemical interference see our explainer on electrochemical sensors in this series |
| Diagnostic sensitivity and specificity | The proportion of people with a condition for whom the test is positive (sensitivity), and of people without it for whom the test is negative (specificity) | Proportion (%) | A separate concept for evaluating a test in a population (commentary based on the title of the statistics note by Altman and Bland). Not the same as analytical sensitivity |
Thévenot et al. [Ref. 1], IUPAC Gold Book "sensitivity" [Ref. 4] and "analytical selectivity" [Ref. 12], Altman and Bland (bibliographic record) [Ref. 13]. The definition in the last row is this article's commentary; we did not check the original text.
For example, raising the analytical sensitivity (slope) does not improve the detection limit if the variability of the blank rises with it. Conversely, even a small slope can give a low detection limit if the blank is extremely stable (commentary, readable from the formulas in the next section). When a paper says "highly sensitive", one has to check whether that means the slope, the detection limit or diagnostic sensitivity.
4. Definitions of LoB, LoD and LoQ
The widely referenced framework in clinical laboratory work is three limits. The summary by Armbruster and Pry puts them as followsSourced.
- LoB (limit of blank): the highest apparent concentration expected when replicates of a blank sample containing no analyte are tested. LoB = mean(blank) + 1.645 × SD(blank)
- LoD (limit of detection): the lowest concentration likely to be reliably distinguished from the LoB and at which detection is feasible; determined from the measured LoB and replicates of a sample with a low concentration of analyte. LoD = LoB + 1.645 × SD(low-concentration sample)
- LoQ (limit of quantitation): the lowest concentration at which the analyte can not only be reliably detected but at which predefined goals for bias and imprecision are met. It may equal the LoD or be much higher
The value 1.645 is the one-sided 5% point (95th percentile) of the normal distribution (commentary). So LoB is set so that 5% of blanks exceed it (the false-positive probability), and LoD so that 5% of low-concentration samples fall below the LoB (the false-negative probability) (Fig. 2). CLSI EP17 (second edition) is the document that gives guidance on evaluating and documenting this detection capability, verifying detection-capability claims made by manufacturers, and the proper use and interpretation of the estimatesSourced. EP17-A2 was issued on 18 June 2012 and reaffirmed without revision in June 2017Sourced (the CLSI official page).
Conventions differ: neither the formulas nor the name "detection limit" is unique
| Convention | Formula (or criterion) | What it uses | Source |
|---|---|---|---|
| CLSI EP17 type (LoB / LoD) | LoB = mean(blank) + 1.645 SD(blank), LoD = LoB + 1.645 SD(low-level sample) | Blank samples, and replicate measurements of low-level samples | Armbruster and PrySourced. The study design in the EP17 text (number of replicates, days, reagent lots) is paid, and we could not confirm it |
| ICH Q2(R2) (validation of analytical procedures for pharmaceuticals) | DL = 3.3σ/S, QL = 10σ/S (σ = standard deviation of the response, S = slope of the calibration curve). Or by signal-to-noise: 3:1 for DL and at least 10:1 for QL. Or visual evaluation | σ from the SD of the blank, or the residual SD or intercept SD of a calibration curve | ICH Q2(R2) 3.2.3 (adopted 1 November 2023)Sourced. Q2(R2) treats the detection and quantitation limits under "lower range limits" |
| IUPAC (the Currie line) | The detection limit is the minimum single result which, with a stated probability, can be distinguished from a suitable blank value. The detection limit as a concentration is derived from x_L = mean of blanks + k × SD of blanks, with k chosen for the confidence level | Mean and SD of blanks | The IUPAC Gold Book entry for "limit of detection" (checked through search results)Sourced. The original recommendation is Currie 1995 (Pure Appl Chem 67:1699) |
Armbruster and Pry [Ref. 2], CLSI [Ref. 3], ICH Q2(R2) [Ref. 6], IUPAC Gold Book [Ref. 14], Currie 1995 [Ref. 15]. IUPAC's official site could not be retrieved automatically, so the Gold Book statements are limited to what could be confirmed from search-result displays.
5. Our calculation: the same data give different limits of detection under different conventions
Suppose a hypothetical sensor gives a blank signal with mean 0.50 (arbitrary units) and SD 0.10, a calibration slope S of 0.20 per (ng/mL), and an SD of 0.15 for a low-level sample near the LoDOur calculation.
- 3σ/S: 3 × 0.10 / 0.20 = 1.50 ng/mL
- ICH-type 3.3σ/S: 3.3 × 0.10 / 0.20 = 1.65 ng/mL (limit of quantitation 10σ/S = 5.0 ng/mL)
- EP17 type: LoB = 0.50 + 1.645 × 0.10 = 0.6645. LoD = 0.6645 + 1.645 × 0.15 = 0.911 (signal). Converted to concentration, (0.911 − 0.50)/0.20 ≈ 2.06 ng/mL (the LoB in concentration is about 0.82 ng/mL)
From the same data come 1.5, 1.65 and 2.06 ng/mL, a spread of about 40%Our calculation. None of them is "correct"; the definitions simply differ.
- When the sample changes: suppose that in a complex sample such as serum, non-specific adsorption and the like make the SD of the blank three times larger, 0.30. Then 3.3σ/S = 3.3 × 0.30 / 0.20 = 4.95 ng/mL. If protein fouling then halves the slope (0.10), it becomes 9.9 ng/mL, six times the 1.65 in bufferOur calculation. This is because the detection limit is proportional to σ and inversely proportional to S
Assumptions and limits: tripling the blank SD and halving the slope are illustrative; real changes depend on the system. The signal is assumed normal and the calibration linear. In real evaluations there are also methods that set the LoB from rank order without assuming a normal distribution (we have not confirmed the details of EP17).
6. How to read a limit-of-detection number: conditions, sample, statistics and units
When you see a "detection limit" in a paper or document, check the following five things (this article's grouping). The IUPAC recommendation likewise points out that the rapid proliferation and diversity of biosensors has led to a lack of rigour in defining their performance criteria, and recommends that authors, referees and educators present them according to standard definitionsSourced (Thévenot et al., abstract).
| What to check | Why it matters | Example |
|---|---|---|
| 1. What statistical definition? | 3σ/S, 3.3σ/S and LoB + 1.645 SD change the number by about 40% for the same data (the calculation above) | ICH Q2(R2): DL = 3.3σ/S; the EP17 type: LoB/LoD |
| 2. What is the blank, and how many times was it measured? | The value changes with how σ is obtained (SD of the blank or residuals of the calibration). ICH Q2(R2) also allows several ways: from "an appropriate number of blank samples", or the residual SD or intercept SD of a calibration curveSourced | An SD from a few measurements is unstable (commentary) |
| 3. What sample (medium)? | In buffer, diluted sample or serum, both the variability of the blank and the slope change (the calculation above). In FETs in particular the signal itself changes with ionic strength | Table below |
| 4. What units? | Molar concentration, mass concentration, counts, dilution factors and infectious units are mixed. Comparison needs conversion, and conversion needs the molecular weight | Table below, calculation in the next section |
| 5. What is the dynamic range? | For a nonlinear response, a detection limit in the conventional sense may not be definable. Wang et al. gave a dynamic range (1 pM to 1 µM)Sourced | See our explainer on FET sensors in this series |
Thévenot et al. [Ref. 1], ICH Q2(R2) [Ref. 6], Wang et al. [Ref. 11]. The "Why it matters" column includes the calculation above and this article's commentary.
Even for "label-free", the units of detection limits differ this much
Teles' review tabulates reports aimed at diagnosing dengue, by transduction method. The units of the detection limits are not uniformSourced.
| Transduction (from the review's table) | Target | Reported detection limit | Assay time |
|---|---|---|---|
| Piezoelectric | NS1 protein and glycoprotein E | 0.05 µg/mL | 30–60 min |
| Optical | IgM and IgG | 21 pg (mass) | 30 min |
| Optical | RNA | 1 nM | — |
| Optical | RNA (DENV2) | 50 molecules | 25 min |
| Electrochemical | cDNA | 10 fM | 30 min |
All Sourced (excerpted from the table in Teles [Ref. 8]). Because the targets, samples and statistical definitions differ, the numbers in this table cannot be ranked against one another.
Even within one field, the detection limit changes greatly with the medium
The review by Vu and Chen tabulates detection limits from notable FET biosensor papers of 2016–2019. Targets and media differ, so lining up the numbers alone is not a comparison.
| Channel | Target | Medium (as in the table) | Reported detection limit |
|---|---|---|---|
| Nickel oxide | HIV DNA | 0.01 M PBS | 0.3 aM |
| Molybdenum disulfide | DNA | 0.1 × PBS | 100 aM |
| Graphene | DNA | 10 mM phosphate buffer, 150 mM NaCl, 50 mM MgCl₂ | 25 aM |
| Metal oxide | TSH (F(ab′)₂) | Serum | 500 fM |
| Graphene | TSH (F(ab′)₂) | Serum | 10 fM |
All Sourced (excerpted from Table 1 of Vu and Chen [Ref. 10]). DNA and proteins are different kinds of target, and the salt concentration and co-existing substances of the media differ, so please do not rank by the size of the numbers. We have not checked the statistical definition in each paper.
7. Our calculation: how many molecules are in a drop?
- Concentration and count: when 1 µL of liquid contains a molecule at 1 fM (10⁻¹⁵ mol/L), the number of molecules is 10⁻¹⁵ × 10⁻⁶ × 6.022×10²³ ≈ about 600. In 10 µL it is about 6,000. At 1 aM (10⁻¹⁸ mol/L), 1 µL holds 0.6 molecules and even 10 µL only about 6Our calculation
- Fluctuation at small counts: if molecules enter the sample at random (assuming a Poisson distribution), the relative spread of an expected count N is 1/√N. For N = 6,000 it is about 1.3%, for N = 600 about 4.1%, and for N = 6 about 41%Our calculation. Detection at the attomolar level runs not only into ingenuity of measurement but also into the statistical wall of "how many molecules are in the sample at all" (commentary)
- Conversion to mass concentration: 1 pM of a molecule of molecular weight 150,000 (about that of an IgG antibody) is 1×10⁻¹² mol/L × 150,000 g/mol = 1.5×10⁻⁷ g/L = 0.15 ng/mL. For a small protein of molecular weight 20,000, 1 pM is 0.02 ng/mL (20 pg/mL)Our calculation
Assumptions and limits: the Poisson distribution is an idealisation in which molecules are independent and randomly distributed in the liquid. In practice the count actually detected changes greatly with diffusion to the surface (mass transport) and adsorption efficiency. The numbers are illustrative orders of magnitude.
8. A materials engineer's view: the floor of the limit of detection is set by blank variability
The detection limit is roughly proportional to σ/S (the calculation above). So materials design that raises the slope S and materials design that lowers the variability σ both lower the detection limit.
- The sources of σ are non-specific adsorption and drift: in label-free formats, sticking of non-target molecules, changes in the environment and baseline drift become the variability of the blank directly (commentary). In impedance, non-specific signal changes and too little or too much BSA blocking have been pointed outSourced (Lazanas et al.), and for FETs it is said that blocking alone sometimes cannot cope with the many proteins in serumSourced (Vu and Chen). The design of antifouling and blocking materials decides σ. Hydrogels and adhesion to skin are covered in other explainers in this series
- Subtract σ with a reference channel: designs put a reference that does not respond to the target on the same chip and subtract the non-specific response: for FETs, a reference FET carrying a scrambled sequence instead of the aptamerSourced (Wang et al.); for electrochemistry, an electrode without enzymeSourced (Weltin et al.)
- Raising S narrows the range: Weltin et al. say that highly sensitive sensors have a linear range limited to a few hundred micromolar and that widening the linear range means limiting diffusion at the cost of sensitivitySourced. Lazanas et al. also say a bulky redox probe raises sensitivity but narrows the detection rangeSourced. Lowering the detection limit and keeping the usable concentration range wide are a trade-off (commentary)
- Surface area and mass transport: as the calculation above shows, at the attomolar level the sample holds few molecules and mass transport to the surface can dominate (commentary). Flow-channel design and concentration by magnetic beads and the like are covered in our explainer on Lab-on-a-Chip in this series
9. Standards and regulation / strengths and challenges / what we could not confirm
Standards and regulation
- In vitro diagnostics and clinical laboratory work: CLSI EP17 covers evaluating the detection capability (LoB, LoD, LoQ) of measurement procedures, verifying claims made by manufacturers and the proper use of the estimates, and is described as applicable to both commercial products and laboratory-developed testsSourced (the CLSI official page). The standard's text is paid, and we could not confirm the details of its study design (such as the number of replicates)
- Analytical procedures for pharmaceuticals: ICH Q2(R2) is a guideline for validating analytical procedures for pharmaceuticals and describes estimating detection and quantitation limits by SD and slope, by signal-to-noise or visually. It is the final version, adopted on 1 November 2023Sourced. It is not a document that applies directly to medical devices or biosensors
- Which document to use depends on the use: whichever is used, the premise is to state "by which definition, on which sample" (commentary). The regulatory position of individual products is covered in our explainer on regulatory pathways for medical devices and home use in this series.
Strengths and challenges
- Strengths of label-free detection: no labelling step is needed, and loss of signal through label leakage is avoidedSourced (Teles). Many formats can follow binding in real time (commentary)
- Challenges: non-specific adhesion mixes into the signal; the definition, sample and unit of detection limits differ between papers, making comparison difficult; and at the attomolar level there is a statistical wall in the number of molecules in the sample (above)
What we could not confirm
- The details of the CLSI EP17 study design: the standard's text is paid. All we could confirm on the official page were the title, edition, issue date and abstract.
- The IUPAC recommendation (Currie 1995) and the Gold Book: IUPAC's official site could not be retrieved automatically, so the Gold Book statements are limited to what could be confirmed from search-result displays.
- The original text of the definitions by Altman and Bland: only the bibliographic record was checked and not the text (the definitions of diagnostic sensitivity and specificity are this article's commentary).
- The statistical definition and sample of each paper's detection limit: the numbers in the tables of Teles and of Vu and Chen are transcribed; the definitions in the original papers were not checked.
- A performance comparison with labelled methods: this article does not compare label-free and labelled formats, and we did not confirm primary sources for such a comparison.
- Label-free detection reads the surface change caused by binding (refractive index, mass, charge, impedance) directly. The shared weakness is that non-target adhesion also gives a signalSourced
- Sensitivity is the slope of the calibration curve, the limit of detection is the smallest amount distinguishable from the blank, and selectivity is the degree to which a method ignores other substances; they are separate concepts, and diagnostic sensitivity and specificity are a further, different matterSourced
- LoB = mean(blank) + 1.645 SD, LoD = LoB + 1.645 SD(low-level sample). ICH Q2(R2) gives DL = 3.3σ/S and QL = 10σ/SSourced
- With hypothetical data, differences of convention alone change the detection limit between 1.5 and 2.06 ng/mL, and if serum is assumed (blank three times larger, slope halved) it is 9.9 ng/mL (six times)Our calculation
- 1 µL at 1 fM holds about 600 molecules, and 10 µL at 1 aM about 6Our calculation. Do not compare numbers without checking units, medium and statistical definition
- The detection limit is proportional to σ/S, so both raising the slope and lowering the variability are materials work, and they trade off against the usable rangeSourced
10. Glossary
- Label-free detection
- Reading the surface change caused by binding directly, without attaching a marker such as a fluorophore or enzyme to the target.
- LoB
- Limit of blank. The upper limit of the apparent concentration seen when blanks are measured repeatedly.
- LoD
- Limit of detection. The lowest concentration reliably distinguished from the LoB.
- LoQ
- Limit of quantitation. The lowest concentration that can be quantified while meeting goals for bias and imprecision.
- Sensitivity (analytical)
- The slope of the calibration curve.
- Selectivity (analytical)
- The degree to which a method responds only to what is to be measured and not to other substances.
- Diagnostic sensitivity / specificity
- The proportion of people with a condition who test positive / of people without it who test negative. A concept distinct from analytical sensitivity.
- Blank
- A sample that does not contain the substance to be measured.
- σ (standard deviation)
- The size of the variability of measured values.
- S/N ratio
- The ratio of signal to noise. In ICH Q2(R2) a guide of 3:1 for the detection limit and at least 10:1 for the quantitation limit.
- Dynamic range
- The range of concentration over which a sensor responds.
- EP17
- The CLSI document on evaluating detection capability.
- ICH Q2(R2)
- The international guideline for validating analytical procedures for pharmaceuticals (adopted 2023).
- SPR
- Surface plasmon resonance. A format that reads changes in refractive index near a metal film.
- QCM
- Quartz crystal microbalance. A format that reads mass from the fall in frequency on adsorption.
- Poisson distribution
- The probability distribution of the count of rare events occurring at random. The relative spread of an expected count N is 1/√N.
11. References
- Thévenot DR, Toth K, Durst RA, Wilson GS (IUPAC) "Electrochemical biosensors: recommended definitions and classification" Biosens Bioelectron 2001;16:121–131 (abstract) — https://pubmed.ncbi.nlm.nih.gov/11261847/
- Armbruster DA, Pry T "Limit of blank, limit of detection and limit of quantitation" Clin Biochem Rev 2008;29 Suppl 1:S49–S52 (summary) — https://pubmed.ncbi.nlm.nih.gov/18852857/
- CLSI "EP17 Evaluation of Detection Capability for Clinical Laboratory Measurement Procedures" (second edition, issued 18 June 2012, official page) — https://clsi.org/standards/products/method-evaluation/documents/ep17/
- IUPAC Gold Book "sensitivity" (sensitivity in analytical chemistry: the slope of the calibration curve) — https://goldbook.iupac.org/terms/view/S05606
- Fan X, White IM, Shopova SI, Zhu H, Suter JD, Sun Y "Sensitive optical biosensors for unlabeled targets: A review" Anal Chim Acta 2008;620:8–26 (abstract) — https://pubmed.ncbi.nlm.nih.gov/18558119/
- ICH "ICH Harmonised Guideline Validation of Analytical Procedures Q2(R2)" (final version, adopted 1 November 2023) — https://database.ich.org/sites/default/files/ICH_Q2%28R2%29_Guideline_2023_1130.pdf
- Grieshaber D, MacKenzie R, Vörös J, Reimhult E "Electrochemical Biosensors – Sensor Principles and Architectures" Sensors 2008;8:1400–1458 — https://pmc.ncbi.nlm.nih.gov/articles/PMC3663003/
- Teles FSRR "Biosensors and rapid diagnostic tests on the frontier between analytical and clinical chemistry for biomolecular diagnosis of dengue disease: a review" Anal Chim Acta 2011;687:28–42 — https://pmc.ncbi.nlm.nih.gov/articles/PMC7094386/
- Daniels JS, Pourmand N "Label-Free Impedance Biosensors: Opportunities and Challenges" Electroanalysis 2007;19:1239–1257 (abstract) — https://pubmed.ncbi.nlm.nih.gov/18176631/
- Vu CA, Chen WY "Field-Effect Transistor Biosensors for Biomedical Applications: Recent Advances and Future Prospects" Sensors 2019;19:4214 — https://pmc.ncbi.nlm.nih.gov/articles/PMC6806101/
- Wang B, Zhao C, Wang Z, et al. "Wearable aptamer-field-effect transistor sensing system for noninvasive cortisol monitoring" Sci Adv 2022;8:eabk0967 — https://pmc.ncbi.nlm.nih.gov/articles/PMC8730602/
- IUPAC Gold Book "analytical selectivity" (PAC 2021, 93, 997) — https://goldbook.iupac.org/terms/view/08055
- Altman DG, Bland JM "Diagnostic tests. 1: sensitivity and specificity" BMJ 1994;308:1552 (bibliographic record) — https://doi.org/10.1136/bmj.308.6943.1552
- IUPAC Gold Book "limit of detection" — https://goldbook.iupac.org/terms/view/L03540
- Currie LA (IUPAC) "Nomenclature in evaluation of analytical methods including detection and quantification capabilities (IUPAC Recommendations 1995)" Pure Appl Chem 1995;67:1699–1723 (bibliographic record) — https://doi.org/10.1351/pac199567101699
- Weltin A, Kieninger J, Urban GA "Microfabricated, amperometric, enzyme-based biosensors for in vivo applications" Anal Bioanal Chem 2016;408:4503–4521 — https://pmc.ncbi.nlm.nih.gov/articles/PMC4909808/
- Lazanas AC, Prodromidis MI "Electrochemical Impedance Spectroscopy—A Tutorial" ACS Meas Sci Au 2023;3:162–193 — https://pmc.ncbi.nlm.nih.gov/articles/PMC10288619/
12. Claim-to-source audit
| Claim in the text | Basis | Label |
|---|---|---|
| The performance criteria listed in IUPAC's recommendation (sensitivity, operational and linear range, detection and quantification limits, selectivity, response times, sample throughput, reproducibility, stability, lifetime); the remark that the proliferation and diversity of biosensors has led to a lack of rigour in defining performance criteria; and the recommendation to present them by standard definitions | Abstract of Thévenot et al. (IUPAC) Reference 1 https://pubmed.ncbi.nlm.nih.gov/11261847/ | Sourced |
| The definitions and formulas of LoB, LoD and LoQ (LoB = mean(blank) + 1.645 SD(blank); LoD = LoB + 1.645 SD(low-level sample); LoQ being the lowest concentration meeting goals for bias and imprecision, which may equal the LoD) | Summary by Armbruster and Pry Reference 2 https://pubmed.ncbi.nlm.nih.gov/18852857/ | Sourced |
| The title of CLSI EP17, the second edition (issued 18 June 2012, reaffirmed June 2017), its being guidance on evaluating detection capability, verifying manufacturers' claims and using the estimates, and its applicability to both commercial products and laboratory-developed tests | The CLSI official page Reference 3 https://clsi.org/standards/products/method-evaluation/documents/ep17/ | Sourced |
| That sensitivity in analytical chemistry is the slope of the calibration curve (a function of concentration if the curve is curved) | IUPAC Gold Book Reference 4 https://goldbook.iupac.org/terms/view/S05606 | Sourced |
| That label-free optical biosensors detect biomolecules unlabelled or unmodified, that platforms using refractive-index change include SPR, interferometers, waveguides, fibre gratings, ring resonators and photonic crystals, and that they are compared in sensitivity and detection limit | Abstract of Fan et al. Reference 5 https://pubmed.ncbi.nlm.nih.gov/18558119/ | Sourced |
| That ICH Q2(R2) is a final version adopted on 1 November 2023; DL = 3.3σ/S and QL = 10σ/S; σ from the SD of the blank or the residual SD or intercept SD of a calibration curve; the signal-to-noise guides (DL 3:1, QL at least 10:1); visual evaluation; and the treatment under "lower range limits" | ICH Q2(R2) 3.2.3 Reference 6 https://database.ich.org/sites/default/files/ICH_Q2%28R2%29_Guideline_2023_1130.pdf | Sourced |
| That the SPR evanescent field extends about 200 nm and reads refractive-index change; what SPR can measure (protein adsorption, antigen-antibody binding, DNA/RNA hybridisation, binding kinetics); the principle of QCM-D; that the mass measured includes bound water; that it works with any surface coating; and that no label is needed | Grieshaber et al. Reference 7 https://pmc.ncbi.nlm.nih.gov/articles/PMC3663003/ | Sourced |
| That label-free formats avoid loss of signal through label leakage; that FET sensor sensitivity is usually moderate because of interface-potential fluctuations; that impedance spectroscopy is slow and may have a market where low cost, portability and speed matter; and the table of detection limits by transduction (0.05 µg/mL, 21 pg, 1 nM, 50 molecules, 10 fM) | Teles Reference 8 https://pmc.ncbi.nlm.nih.gov/articles/PMC7094386/ | Sourced |
| That challenges from the affinity-capture step are shared by all label-free affinity biosensors, and that impedance biosensors are low cost, easy to miniaturise and label-free | Abstract of Daniels and Pourmand Reference 9 https://pubmed.ncbi.nlm.nih.gov/18176631/ | Sourced |
| Examples of FET biosensor detection limits (nickel oxide 0.3 aM, molybdenum disulfide 100 aM, graphene 25 aM, TSH 500 fM and 10 fM) with their media, and that blocking alone cannot cope with proteins in serum | Table 1 and text of Vu and Chen Reference 10 https://pmc.ncbi.nlm.nih.gov/articles/PMC6806101/ | Sourced |
| That the response of an aptamer FET is nonlinear so sensitivity and detection limit cannot be given in the conventional sense, and that a dynamic range (1 pM to 1 µM) was given; and the scrambled-sequence reference FET | Wang et al. Reference 11 https://pmc.ncbi.nlm.nih.gov/articles/PMC8730602/ | Sourced |
| That the IUPAC terminology has an entry "analytical selectivity" (PAC 2021, 93, 997) | IUPAC Gold Book Reference 12 https://goldbook.iupac.org/terms/view/08055 | Sourced |
| That the statistics note by Altman and Bland, "Diagnostic tests. 1: sensitivity and specificity" (1994), exists (title and bibliographic record) | Bibliographic record Reference 13 https://doi.org/10.1136/bmj.308.6943.1552 | Sourced |
| That the detection limit is the minimum single result which, with a stated probability, can be distinguished from a suitable blank value, and that the detection limit as a concentration is derived from the mean and SD of blanks multiplied by a factor k | The IUPAC Gold Book statement (checked through search-result displays) Reference 14 https://goldbook.iupac.org/terms/view/L03540 | Sourced |
| That the IUPAC recommendation of 1995 by Currie, "Nomenclature in evaluation of analytical methods including detection and quantification capabilities" (Pure Appl Chem 67:1699–1723), exists | Bibliographic record Reference 15 https://doi.org/10.1351/pac199567101699 | Sourced |
| That highly sensitive sensors have a linear range limited to a few hundred micromolar, that widening the linear range means limiting diffusion at the cost of sensitivity, and the subtraction of background with an enzyme-free electrode | Weltin et al. Reference 16 https://pmc.ncbi.nlm.nih.gov/articles/PMC4909808/ | Sourced |
| That EIS biosensors can show non-specific signal changes easily mistaken for specific interactions; too little or too much BSA blocking; and that bulky redox probes raise sensitivity but narrow the detection range | Lazanas and Prodromidis Reference 17 https://pmc.ncbi.nlm.nih.gov/articles/PMC10288619/ | Sourced |
| From hypothetical data (blank mean 0.50, SD 0.10; low-sample SD 0.15; slope 0.20), LoB 0.6645, LoD 0.911 (about 2.06 ng/mL), 3σ/S = 1.50, 3.3σ/S = 1.65, 10σ/S = 5.0, 4.95 with serum assumed (σ x3) and 9.9 ng/mL with the slope halved; 1 fM in 1 µL ≈ 600 molecules, 1 aM in 1 µL ≈ 0.6, in 10 µL ≈ 6; relative spread 1/√N (1.3%, 4.1%, 41%); and 1 pM of an IgG (molecular weight 150,000) being 0.15 ng/mL | Our calculation. Assumes hypothetical data, a normal distribution, a linear calibration, a Poisson distribution and the Avogadro constant of 6.022×10²³ /mol | Our calculation |
| The reading of the shared weakness of label-free methods, the four-way grouping of formats, the explanation of diagnostic sensitivity and specificity, the five things to check, the grouping of moving σ and S with materials, and the trade-off with usable range | Commentary by this article. A rearrangement of the sources | Commentary |
| The details of the CLSI EP17 study design, confirmation of the IUPAC recommendation and Gold Book on the official site, the original text of the definitions by Altman and Bland, the statistical definition and sample of each paper's detection limit, and a performance comparison with labelled methods | Not confirmable from published primary sources within the scope of this survey, so not stated | Commentary |
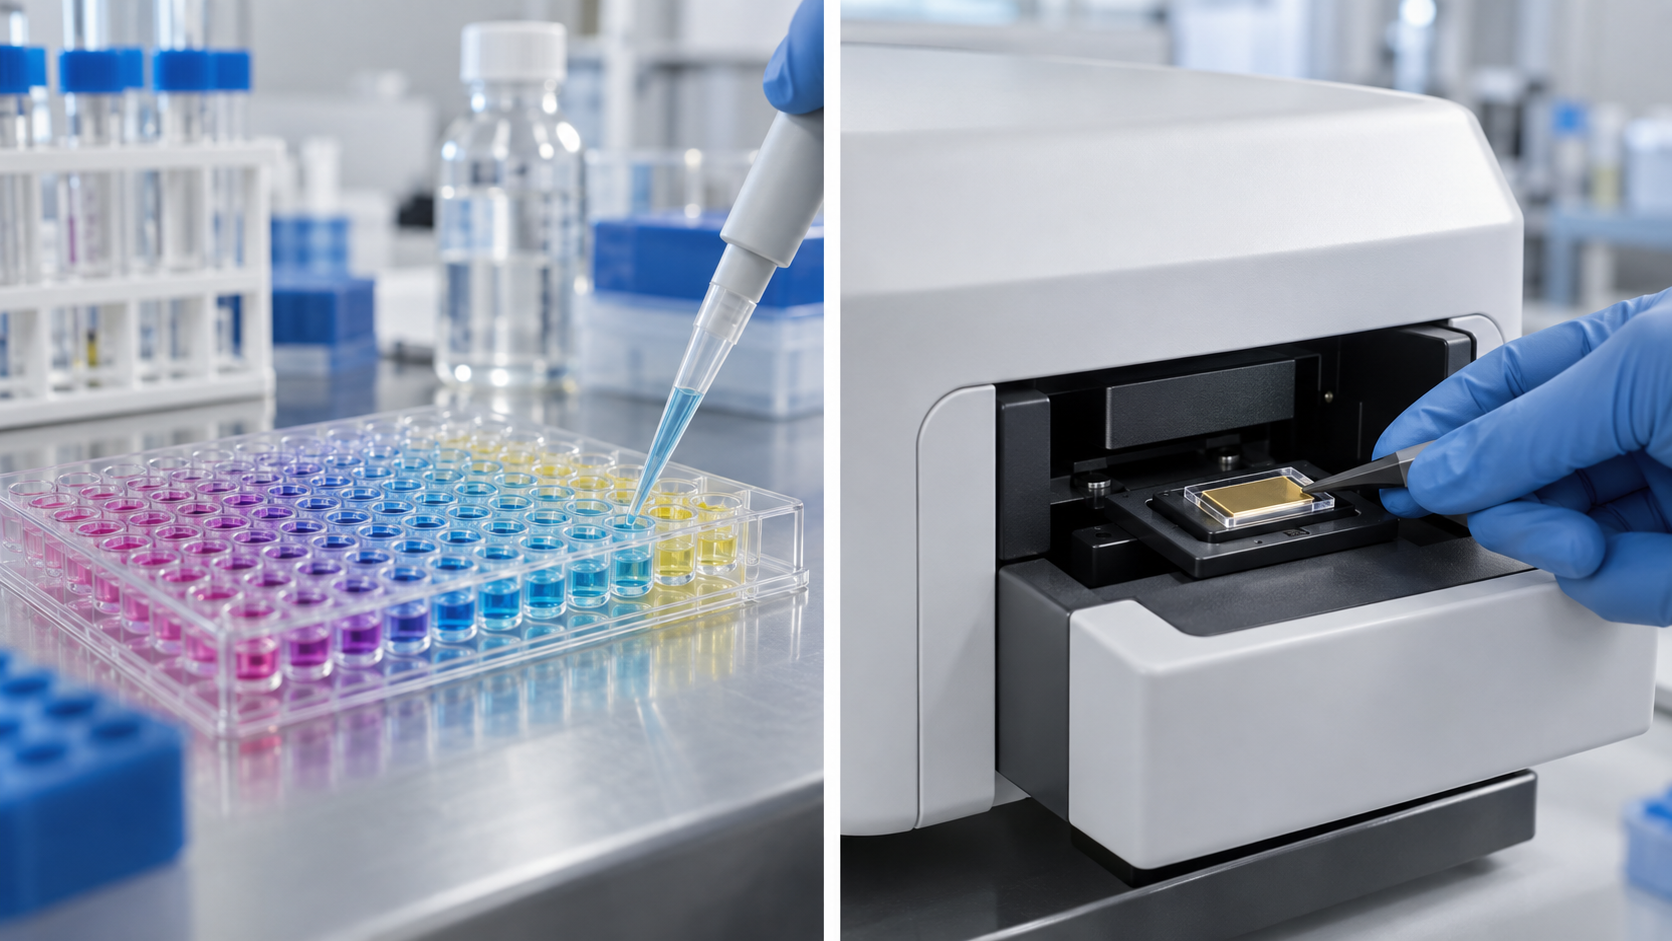
| That Figs. 1, 2, 3 and 4 are explanatory drawings and not real measurement data or product structures, and that the hero image and Fig. 5 are AI-generated images | Note by this article | Commentary |
Last updated October 2026. Sources are limited to primary material (abstracts of IUPAC recommendation papers, official CLSI and ICH documents, and peer-reviewed reviews). Because the article includes interpretation and materials-design readings, those are marked as Commentary and kept separate from sourced fact. The details of the CLSI EP17 study design, confirmation on IUPAC's official site, and the definitions and samples behind each paper's detection limit are not stated here because no published primary source could be confirmed. The calculations in this article are derived from hypothetical data and idealised assumptions and are not measurements from real sensors. Reported detection limits differ between papers in sample, conditions and statistical definition, and are not a ranking. All figures are explanatory concept graphics. Figs. 1, 2, 3 and 4 are vector drawings; the hero image and Fig. 5 are AI-generated images, and none of them shows a real cross-section, micrograph or physical product. This article explains how to think about evaluation and is not medical advice.