TECHNOLOGY EXPLAINER
Raman Spectroscopy and SERS
— the molecular “fingerprint”, amplified by orders of magnitude on gold and silver nanostructures
Raman spectroscopy reads the vibrations of a molecule from slightly shifted colours in the scattered light when light is shone on it. It can tell molecules apart without labels, but the signal is extremely weak. SERS (surface-enhanced Raman scattering) strengthens that signal greatly by bringing the molecule close to a gold or silver nanostructure. The enhancement is concentrated almost entirely in nanometre-scale gaps (hot spots). So from a materials point of view, SERS performance comes down to whether the nanostructure can be made in the same shape, again and again. This article covers the principle of Raman scattering, how the enhancement works, substrate materials and reproducibility, and what goes wrong with biological samples such as blood, based on international review and recommendation papers.

- What Raman spectroscopy and SERS are, in three lines
- The principle of Raman scattering: molecular vibration becomes a colour shift
- How surface enhancement works: field enhancement and hot spots
- Our calculation: the enhancement factor depends on how many molecules you assume are contributing
- Materials and fabrication of enhancing substrates
- A materials engineer's view 1: enhancement is set by the shape of the nanogap, not by the kind of material
- Reproducibility: how to measure and report so that results can be compared
- A materials engineer's view 2: if the substrate cannot be made uniform, compensate with an internal standard
- Challenges with biological samples
- Reference materials, regulatory position, and what we could not confirm
- Glossary / References / Claim-to-source audit
Sourced = stated in published material or a paper (link given)
Our calculation = a figure this article derived, with the assumptions spelled out
Not yet confirmed = at the research stage or an outlook, with no confirmed practical record
Structural readings and materials-design interpretations are marked separately as Commentary.
This article explains materials, principles and evaluation. It is not medical advice on diagnosis, treatment or how to read test results, and it does not recommend any product.
1. What Raman spectroscopy and SERS are, in three lines
- Raman spectroscopy: of the light scattered by a molecule, a tiny fraction has a different colour (energy) from the incident light. The size of the shift is set by the molecule's vibrations, so the spectrum acts as a molecular “fingerprint”. Raman and Krishnan reported the phenomenon in 1928 as “a new type of secondary radiation” Sourced
- SERS: a review describes SERS as a sensing technique in which the inelastic light scattering of molecules adsorbed on corrugated metal surfaces, such as silver or gold nanoparticles, is greatly enhanced, by factors up to 108 or even larger, enabling single-molecule SERS in some cases Sourced
- Where it is hard: most of the enhancement comes from a handful of molecules in nanometre-scale gaps (hot spots). A slightly different gap shape changes the signal, so results do not line up between laboratories or production lots. An international team writes that SERS results from different laboratories “can differ significantly” Sourced
A SERS “enhancement factor” is not a property of the substrate alone; it is a number that embeds assumptions about how many molecules are contributing, where, and how strongly. From the same measurement, changing the assumptions moves the enhancement factor by orders of magnitude (our calculation, Chapter 4). So figures such as “108-fold” or “detected down to ppb” have to be read together with the molecule, substrate, instrument and sample (commentary).
2. The principle of Raman scattering: molecular vibration becomes a colour shift
When light hits a molecule, most of it is scattered with the same colour (energy) (Rayleigh scattering). Only a very small fraction comes out in a slightly different colour, because it gave energy to a molecular vibration or took energy from one (Raman scattering). Scattering in which energy was given to the molecule is Stokes scattering; scattering in which energy was received from the molecule is anti-Stokes scattering. The size of the shift (the Raman shift) is set by the kind of vibration, so the positions of the peaks reveal the type of molecule and the state of its bonds (this is a general optics and spectroscopy explanation: our commentary).
The weakness of the Raman signal is the central difficulty. A recommendations paper by an international team notes that the cross-sections of normal Raman scattering are very low, so reference measurements need a highly concentrated solution or a crystal Sourced. On the other hand, a review lists as reasons for hopes in bio-measurement that Raman spectra show sharp, clearly discernible fingerprint peaks, do not photobleach as fluorescence does, and make it easy to tell several labels apart Sourced.
3. How surface enhancement works: field enhancement and hot spots
SERS was discovered by accident. According to the review, in 1974 Fleischmann and co-workers found a strong signal while measuring Raman scattering of pyridine on a roughened silver electrode; at first the effect was attributed to the increased surface area Sourced. In 1977 Jeanmaire and Van Duyne, and Albrecht and Creighton, independently identified the phenomenon and estimated enhancement factors (EF) of 105–106 Sourced. A link was then pointed out between SERS intensity and the enhanced fields produced by the localized surface plasmons of metal nanostructures, and in 1997 an intrinsic enhancement factor of 1014–1015 was reported for single rhodamine 6G molecules on silver colloidal particles that had been screened and selected Sourced.
Two contributions are described Sourced.
- Electromagnetic enhancement: the strong field created by the plasmon of the metal nanostructure strengthens both the incoming and the scattered light. The recommendations paper uses a calculation that approximates intensity as the fourth power of the field (the |E|4 approximation) in its figure.
- Chemical enhancement: contributions that do not depend on the electromagnetic environment, such as electron transfer between the molecule and the metal.
What matters is that the strong field is confined to a narrow nanometre-scale region (a hot spot). The recommendations paper says the SERS signal comes mainly from molecules in regions of extremely high local field of “a few nm3 or even less”, and gives calculated examples Sourced.
- For an elongated silver nanoparticle, 12% of the surface area accounts for 80% of the collected SERS signal
- For a dimer of two silver spheres (radius 30 nm, gap 2 nm), only 0.59% of the surface area accounts for 80% of the signal
4. Our calculation: the enhancement factor depends on how many molecules you assume are contributing
The recommendations paper defines the standard measure of substrate performance, the substrate enhancement factor (EF), as follows Sourced.
EF = (ISERS / NSERS) / (IRS / NRS)
ISERS is the SERS signal, IRS the ordinary Raman signal without the substrate, NSERS the number of molecules excited in SERS and NRS the number excited in ordinary Raman. It is thus a ratio of intensities per molecule. The paper says that ISERS is easy to measure but the other three quantities (IRS, NRS, NSERS) are hard to estimate; NSERS in particular needs the orientation and surface coverage of the molecules, and “even if 100% coverage is assumed”, the area may be hard to define or the molecule may not interact with the surface as predicted Sourced.
We substitute assumed values into the formula Our calculation.
- Measured intensity ratio ISERS / IRS = 200 (same vibrational mode, same conditions)
- Number of molecules excited in ordinary Raman NRS = 5×10¹¹
- If the number of molecules excited in SERS is estimated at NSERS = 1×10⁶: EF = 200 × (5×1011 / 1×10⁶) = 200 × 5×105 = 1×10⁸
- But if the molecules actually contributing were NSERS = 1×10⁸: EF = 200 × (5×1011 / 1×10⁸) = 200 × 5×103 = 1×10⁶
Assumptions and limits: the intensity ratio and molecule counts are all our assumptions, not measured values. The example only shows that EF is inversely proportional to NSERS, so a 100-fold difference in the estimated coverage or effective area gives a 100-fold different enhancement factor from the same measurement. The paper also points out that a molecule that adsorbs poorly gives a smaller signal, which can be misread as a different enhancement factor, and that the enhancement factor depends on the nature of the test molecule Sourced.
For that reason the paper recommends, as standard reporting molecules, strongly adsorbing, non-resonant molecules (4-mercaptobenzoic acid and adenine), and advises against dyes such as rhodamine 6G, crystal violet and methylene blue, because their resonance and fluorescence make the enhancement factor hard to determine Sourced. It also proposes that a new substrate be tested with weakly adsorbing molecules as well, because testing only with strongly binding molecules would miss a substrate whose surface is covered by something (a protein, for instance) that blocks weaker binders Sourced.
5. Materials and fabrication of enhancing substrates
The metals that produce SERS are mainly gold, silver, copper and aluminium. The recommendations paper says enhancement is governed by the interplay of the material, the morphology of the structure and the coupling of excitation photons to the surface plasmon, and that semiconductors (GaP, Si) and two-dimensional inorganic materials can also be used Sourced. Silver is generally more plasmonically active than gold, but oxidation is a problem Sourced.
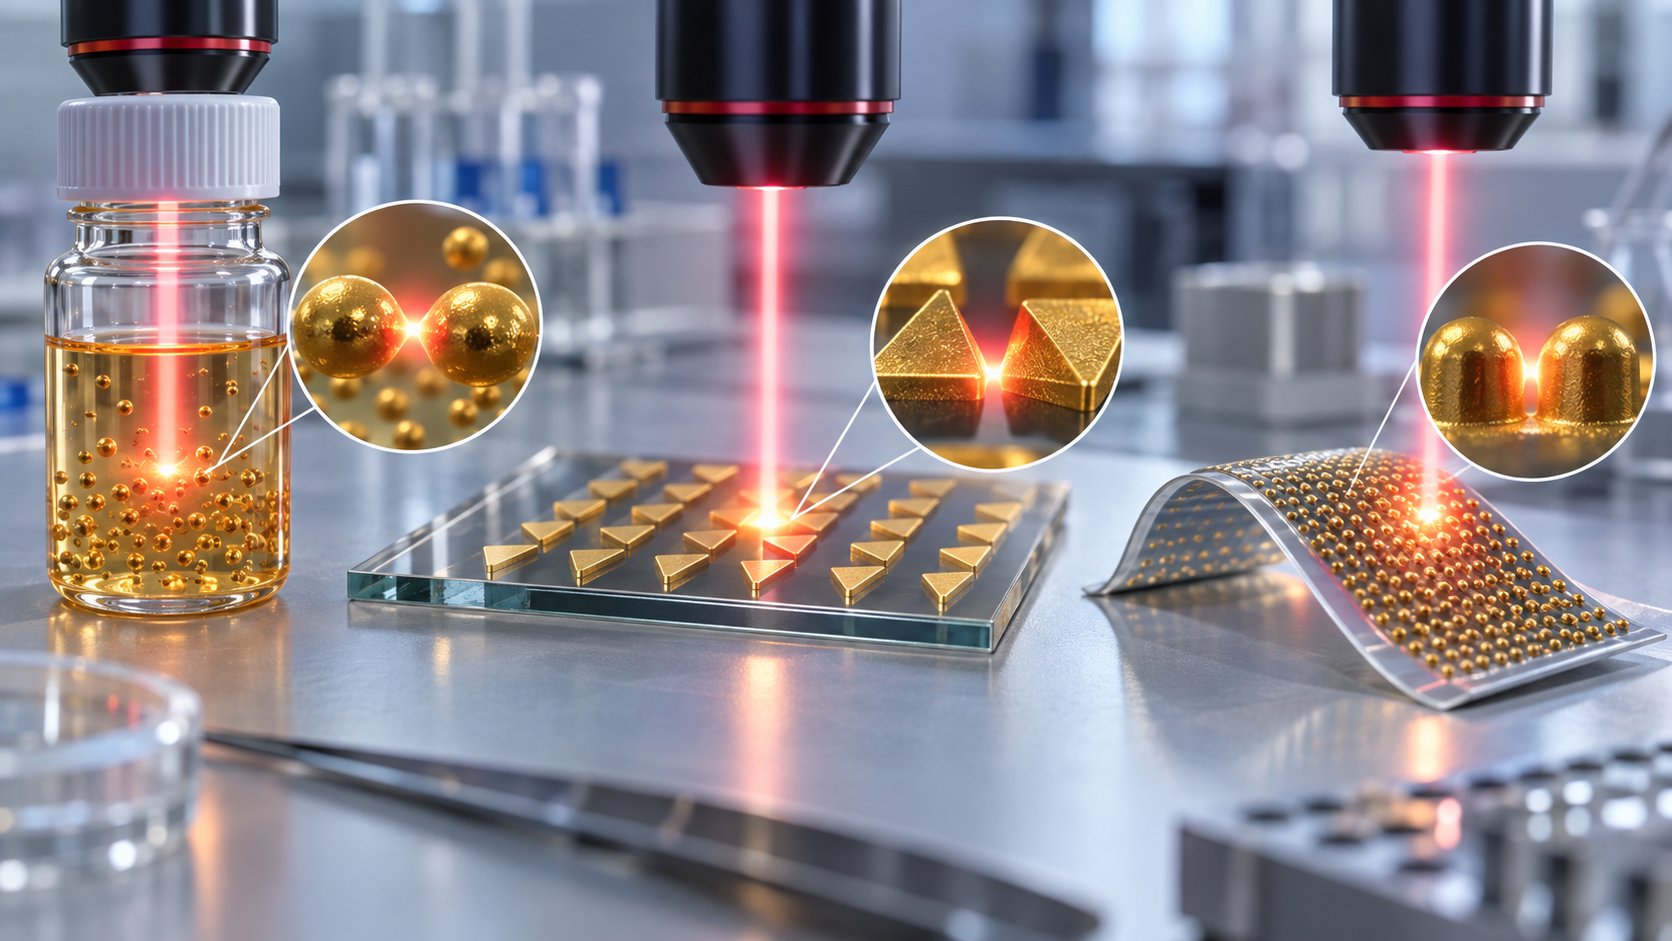
Substrates fall into three types by how they are made Sourced (the classification in the recommendations paper).
View the original SVG schematic, source notes and numerical details
The recommendations paper says these three types differ greatly in structural homogeneity, in the equipment and know-how needed, and in whether they can be scaled up Sourced. For solid substrates, the surface area is easy to count for periodic lithographic patterns, while sputtered films or disordered films of adsorbed particles are harder to characterize. For colloids, the usable area depends on particle size and concentration, so the concentration should be reported Sourced.
(1) Standard substrates and materials tricks
The performance of a new substrate is advised to be compared with commercial substrates (the paper names Silmeco, Hamamatsu and ST Japan among examples) or with standard home-made ones. Standard home-made solid substrates are nano-arrays made by nanosphere or colloidal lithography, metal film over nanospheres (MFON), and a 4 nm thin metal film on glass. The colloid standards are 20–50 nm particles made by the Turkevich method (gold, citrate) or the Leopold/Lendl method (silver, hydroxylamine) Sourced.
As an example of a commercial substrate, Silmeco describes its gold SERStrate as “designed for use at 785 nm” and its silver SERStrate as “designed for use at 532 nm to 785 nm excitation”, and offers custom versions matched to the excitation wavelength. It describes its process as excluding lithography and involving “only two simple process steps” Sourced (the manufacturer's stated description). The need to choose a substrate to match the excitation wavelength also appears in the review's calculations: one calculation shows how the enhancement from monolayers of gold nanoparticles of different shapes varies with surface coverage at each excitation wavelength (785 nm for 65×21 nm nanorods, 633 nm for 51 nm nanospheres, 900 nm for nanostars at resonance) Sourced.
As examples of materials and process ideas, the review gives the following Sourced.
- Nanopillar “leaning”: as solvent evaporates, surface tension pulls silicon nanopillars together and traps analyte at hot spots. Pillars can be replicated by injection moulding, which could make large-scale manufacture and integration with microfluidics easier
- Supports: PDMS is non-toxic, has little interfering Raman signal of its own and can be used on curved surfaces
- Surfactants: using CTAB in the synthesis of gold nanostars raises toxicity concerns; HEPES and other buffers, or a surfactant-free method stabilized only by ascorbic acid, are reported as advantageous for biocompatibility
- Lower limit on gaps: when the gap between particles goes well below 1 nm, quantum effects such as electron tunnelling appear and the electromagnetic enhancement usually falls
6. A materials engineer's view 1: enhancement is set by the shape of the nanogap, not by the kind of material
Looked at as a material, the choice of metal is only the starting point of a SERS substrate (commentary). The recommendations paper stresses the following Sourced.
- Micrographs alone do not predict performance: the local field varies drastically within a few nanometres, so enhancement depends enormously on very small structural features. Images such as SEM are often the only characterization reported for a new substrate, but the paper says they are “not sufficient to predict SERS performance” and recommends correlative electron microscopy, dark-field and SERS microspectroscopy on the same individual nanoparticles and aggregates
- What is on the surface decides how easily the analyte gets there: to reach the surface, the analyte must replace a surfactant or pass through a layer of stabilizing species. So at the same concentration, strongly and weakly adsorbing analytes have different surface coverage and give different signals
- “No signal” is usually an adsorption problem, not a plasmon problem: the paper points out that when an analyte gives no signal on a plasmonically active substrate, it is most often because the analyte has not adsorbed rather than because enhancement is lacking
So developing a SERS substrate is a job of “making a nanostructure” and, equally, “designing the surface chemistry: what to put on and what to take off”. This is related to the interface design discussed in our explainers on label-free detection and limits of detection and on enzymes and electrode interface materials (commentary).
7. Reproducibility: how to measure and report so that results can be compared
The recommendations paper proposes separating reproducibility from uniformity Sourced. For colloids, reproducibility is whether “different preparations of nominally the same particles give the same absolute SERS intensity”. For solids, it is whether different production batches give the same signal, which is distinct from whether different points on the same surface give the same signal (uniformity), and the two are often confused.
The specific numbers in the recommendations paper are as follows Sourced.
- Colloids: average the results of three different batches, with at least 10 individual measurements per batch (when long integration times of about 10 s are needed). With short integration times of about 1 s, ideally more than 100
- Solid substrates: tens of points on a surface give an approximate indication of uniformity. For statistically significant results, average data from 3–5 samples with a few hundred individual measurements per sample under short integration (<1 s)
- Comparing detection limits: the LOD depends not only on the substrate and concentration but on instrument factors such as collection efficiency, grating efficiency and detector sensitivity, so LOD comparisons should be limited to side-by-side comparisons of substrates. For inter-laboratory comparison, report the instrument's performance, for example the normal Raman spectrum of a standard solvent, together with the experimental conditions
- Recovery and RMSE: when quantifying concentration, report not only the LOD but also the recovery rate (detected concentration divided by actual concentration) and the root mean square error (RMSE) of prediction, calculated on validation samples that were not used in calibration. A detection scheme without a validation step should be questioned regarding its relevance to analytical application
- Handling: incubating the substrate in a solution containing the analyte gives lower signal variability than droplet deposition
As for the present level, the review states that substrates showing reasonable variations of less than 20% RSD in SERS intensity can be made by both top-down and bottom-up approaches, that commercial substrates with a good degree of reproducibility are available, and that this lets robust calibration curves be built for quantification in real analytical applications Sourced. As a special case, a film of metal nanoparticles at a liquid-liquid interface (MeLLFs) is reported to have a relative standard deviation of 1.1% in absolute signal over millimetre-scale areas Sourced. These figures are for combinations of a substrate and a test molecule and are not performance in biological samples (commentary).
8. A materials engineer's view 2: if the substrate cannot be made uniform, compensate with an internal standard
Making nanostructures perfectly uniform is hard. The recommendations paper therefore recommends an internal standard: a reference substance that tracks changes in the enhancement factor in the same way as the target is added, and the target signal is normalized to the standard's signal Sourced.
- The ideal internal standard is an isotopologue of the target: being chemically almost identical, it tracks variations in the enhancement factor well. The review also describes this as isotope-dilution SERS
- Standard addition or chemically similar compounds are other options
- Built-in standards: in core-molecule-shell (CMS) particles, a Raman label is embedded between the core and the shell, so the standard is part of the particle itself
The paper's conclusion is bold: “by using an appropriate internal intensity standard quantitative SERS analysis can be achieved even without very highly reproducible substrates”, and this dramatically reduces the need for rigorous batch-to-batch reproducibility of substrates and spectral acquisition Sourced. From the materials side, this is a hint for dividing the labour between “making a perfect substrate” and “compensating through measurement design” (commentary).
9. Challenges with biological samples
Taking SERS from buffers and standard solutions to real samples such as blood, urine or cell-culture media multiplies the problems. The recommendations paper says that moving from clean laboratory samples to real-world samples introduces interference from impurities in the sample matrix, and gives these examples Sourced.
- The surface of the SERS substrate is blocked, or its plasmonic properties change
- Compounds other than the target give strong SERS signals
The review also says that analysis of biofluids requires compatibility with high ionic strength environments that contain various biomolecules, easily inducing nanoparticle aggregation and severely interfering with SERS spectra Sourced.
(1) Surface fouling and aggregation: materials countermeasures
As an example of a particle designed to resist aggregation at high ionic strength, the review describes “hedgehog particles”: a polystyrene core with zinc oxide spikes, coated with gold nanoparticles in a layer-by-layer manner. The spiky surface corrugation reduces the contact area and van der Waals forces between particles, and the particles stay dispersed even in 1 M NaCl. In bacterial growth medium (tryptic soy broth with glucose) and in cell-culture medium with 5% fetal bovine serum (DMEM), two dyes could be detected with more than an order of magnitude higher intensity than with ordinary gold-coated beads Sourced. This was, however, a model measurement with dyes, not performance in real blood or the like.
Functionalizing the surface to raise selectivity is another route. The recommendations paper says that sample pre-treatment or modifying the substrate surface, for example with self-assembled monolayers, can reduce interference, but that selectivity improves at the cost of the general applicability of a SERS sensor Sourced.
(2) SERS tags, and use inside the body
A SERS nanotag is a label made from a noble-metal nanoparticle coated with a molecule that gives a strong Raman signal (a Raman reporter, for example an aromatic thiol), covered with a protective shell (PEG, bovine serum albumin, silica and others) and linked to a targeting molecule such as an antibody. The review lists advantages over fluorescent labels: narrow spectral bands that make multicolour detection easy; signal proportional to the number of tags; little photobleaching; excitation of all tags with a single laser wavelength; and, with red to near-infrared excitation, suppression of autofluorescence Sourced.
On the other hand, the review lists these challenges for use in the body Sourced.
- Tags delivered intravenously would need stability of over 24–48 h, resistance to fouling and protein-corona formation, and extremely high biocompatibility
- On average less than 5% of systemically injected nanoparticles reach the target organ, so aggregation, shape reconstruction, accumulation and toxicity become issues
- Producing probes with the same results from batch to batch while scaling up is “absolutely necessary for the clinical and commercial use” but “utterly challenging”
- Aiming a strong laser directly at cells can cause photodamage; remote excitation through a nanowire waveguide is described as research that reduces it
The toxicity of surfactants such as CTAB, and the behaviour of metal nanoparticles themselves in the body (accumulation, toxicity), need separate evaluation depending on the use. The safety assessment of medical devices and in-body diagnostics is covered in our explainers on nanoparticles and nanozymes and on medical device classification and home use. Within the scope of this article, we could not confirm any official review document showing the biocompatibility or in-body safety of SERS tags.
10. Reference materials, regulatory position, and what we could not confirm
(1) Reference material and reporting of the instrument
To calibrate the Raman instrument itself, the U.S. National Institute of Standards and Technology (NIST) issues SRM 2241, a relative intensity correction standard for 785 nm excitation. It is a small piece of chromium-doped (0.02 mole fraction as Cr2O3) sodium borosilicate glass (about 10 mm × 10 mm × 1.65 mm), and its certified values describe the shape of its broadband luminescence spectrum (200–3500 cm−1) under 785 nm excitation. Measuring that luminescence gives the intensity-response correction unique to each Raman system, which removes instrument-induced spectral artifacts. The certificate was issued on 7 January 2022 and the certified values are valid until 31 December 2026 Sourced.
Note that what this material corrects is the intensity response of the instrument; it does not certify the size of enhancement of a SERS substrate (our reading of the certificate). For comparing SERS substrates themselves, the recommendations paper advises that inter-laboratory comparisons report the instrument's performance (for example, the normal Raman spectrum of a standard solvent) together with the conditions Sourced.
(2) Regulatory position
Specific examples of in vitro diagnostic (IVD) devices based on SERS that have been reviewed by regulators such as FDA or PMDA could not be confirmed from primary sources within the scope of this article. The review says that incorporating robust, reliable and predictable SERS substrates into cartridge devices “for the near future” could become a promising strategy toward commercial SERS sensors Sourced, which shows that, at least when it was written (2019), this direction was treated as a future task. The record of current commercial analytical SERS sensors, and their regulatory status for medical use, is Not yet confirmed. Research that applies Raman spectroscopy itself to the diagnosis of body fluids exists, but it is not covered here.
(3) Other things we could not confirm
- A primary source that quantifies ageing of silver and gold nanostructures (oxidation and aggregation in storage). We confirmed the statement that silver oxidation is a problem (recommendations paper) but found no figures relating storage time to signal loss
- Measured reproducibility of commercial SERS substrates (comparisons between manufacturers). The Silmeco page stresses high reproducibility, but we could not confirm the test conditions behind any figure, so none is quoted
- The enhancement-factor calculation in Chapter 4 is an illustration using assumed values, not the performance of any particular substrate
- Raman scattering is a molecular fingerprint but weak. SERS enhances it by up to 108 or more on gold and silver nanostructures Sourced
- Enhancement is concentrated in hot spots. In a silver-sphere dimer (2 nm gap), 0.59% of the surface area accounts for 80% of the signal Sourced. Per unit area that is about 136 times the average Our calculation
- The enhancement factor depends on assumptions. If the number of contributing molecules is estimated 100-fold differently, the same measurement gives a 100-fold different factor Our calculation
- A substrate is defined by how it is made and by its surface chemistry. Micrographs alone cannot predict performance Sourced
- Reproducibility and uniformity are different. The paper suggests 3 batches x 10 or more for colloids, and 3–5 chips x a few hundred points for solids Sourced
- With an internal standard, quantification may be possible even if substrates are not uniform. An isotopologue is considered ideal Sourced
- In biological samples, aggregation, surface fouling and signals from other components are the wall. The countermeasures trade selectivity against generality Sourced
11. Glossary
- Raman scattering
- Scattered light of a slightly different colour (energy) from the incident light, set by molecular vibrations.
- Stokes / anti-Stokes
- Raman scattering in which energy was given to the molecule / received from it.
- Raman shift
- The difference from the incident light expressed as a wavenumber (cm−1). Peak positions act as a fingerprint.
- SERS
- Surface-enhanced Raman scattering. The signal of molecules close to a metal nanostructure is strongly enhanced.
- Hot spot
- A region a few nanometres across, such as a gap between nanoparticles, where the field is extremely strong.
- Enhancement factor (EF)
- Ratio of the per-molecule intensity in SERS to that in ordinary Raman. Depends on assumptions.
- Localized surface plasmon
- Resonance of light with collective electron oscillation in a metal nanostructure.
- Raman reporter
- A molecule giving a strong Raman signal, used for identification in SERS tags and similar labels.
- SERS nanotag
- A noble-metal particle carrying a reporter and a protective shell, used as a label.
- Internal standard
- A reference substance added to cancel variations in enhancement. An isotopologue is ideal.
- RSD
- Relative standard deviation. Variability as a fraction of the mean.
- MFON
- Metal film over nanospheres, a standard home-made substrate.
- SHINERS
- A technique using metal nanoparticles covered with a thin silica shell.
12. References
- Bell SEJ, Charron G, Cortés E, Kneipp J, de la Chapelle ML, Langer J, Procházka M, Tran V, Schlücker S "Towards Reliable and Quantitative Surface-Enhanced Raman Scattering (SERS): From Key Parameters to Good Analytical Practice", Angew Chem Int Ed 2020;59:5454–5462 — doi.org/10.1002/anie.201908154
- Langer J et al. "Present and Future of Surface-Enhanced Raman Scattering", ACS Nano 2020;14:28–117 — doi.org/10.1021/acsnano.9b04224
- Raman CV, Krishnan KS "A New Type of Secondary Radiation", Nature 1928;121:501–502 — doi.org/10.1038/121501c0
- Fleischmann M, Hendra PJ, McQuillan AJ "Raman spectra of pyridine adsorbed at a silver electrode", Chem Phys Lett 1974;26:163–166 — doi.org/10.1016/0009-2614(74)85388-1
- Jeanmaire DL, Van Duyne RP "Surface Raman spectroelectrochemistry", J Electroanal Chem 1977;84:1–20 — doi.org/10.1016/S0022-0728(77)80224-6
- Albrecht MG, Creighton JA "Anomalously intense Raman spectra of pyridine at a silver electrode", J Am Chem Soc 1977;99:5215–5217 — doi.org/10.1021/ja00457a071
- Nie S, Emory SR "Probing Single Molecules and Single Nanoparticles by Surface-Enhanced Raman Scattering", Science 1997;275:1102–1106 — doi.org/10.1126/science.275.5303.1102
- NIST "Standard Reference Material 2241: Relative Intensity Correction Standard for Raman Spectroscopy: 785 nm Excitation", certificate (issued 7 January 2022, PDF) — tsapps.nist.gov
- Silmeco ApS "Products – SERS Substrates" (manufacturer's product page) — silmeco.com
- Le Ru EC, Blackie E, Meyer M, Etchegoin PG "Surface Enhanced Raman Scattering Enhancement Factors: A Comprehensive Study", J Phys Chem C 2007;111:13794–13803 (further reading; no figures are quoted from it here) — doi.org/10.1021/jp0687908
- Sharma B, Frontiera RR, Henry AI, Ringe E, Van Duyne RP "SERS: Materials, applications, and the future", Mater Today 2012;15:16–25 (further reading; no figures are quoted from it here) — doi.org/10.1016/S1369-7021(12)70017-2
13. Claim-to-source audit
| Claim in the text | Basis | Label |
|---|---|---|
| The definition of the substrate enhancement factor (ISERS, IRS, NSERS, NRS); that normal Raman cross-sections are low and reference measurements need a concentrated solution or a crystal; that ISERS is easy to measure but the other three quantities are hard to estimate; that NSERS needs orientation and coverage and that 100% coverage need not hold; that adsorption of the analyte affects the enhancement factor and weakly adsorbing molecules give smaller signals; the recommended reporting molecules (4-MBA, adenine) and why dyes (R6G, crystal violet, methylene blue and others) are not recommended; testing also with weakly adsorbing molecules; the three substrate classes (directly on a solid, particles set on a solid, particles in suspension) and their differences in homogeneity, equipment and know-how, and scale-up; metals (Au, Ag, Cu, Al), semiconductors (GaP, Si) and 2D inorganic materials; silver is more active but oxidation is a problem; commercial substrates (Silmeco, Hamamatsu, ST Japan and others) and standard home-made substrates (nano-arrays, MFON, 4 nm metal film), and the standard colloids (Turkevich gold, Leopold/Lendl silver, 20–50 nm); periodic lithographic structures are easier to count and disordered films harder; colloid particle concentration must be reported; hot spots of a few nm3 or less, 12% of area for 80% of signal in an elongated silver particle, and 0.59% for a silver-sphere dimer (radius 30 nm, 2 nm gap); the fourth-power-of-field approximation; that SEM alone is insufficient and correlative characterization is recommended; that the analyte must displace surfactant or cross a stabilizer layer; that most no-signal cases are adsorption problems; the distinction between reproducibility and uniformity and the recommended numbers of measurements (colloids: 3 batches x 10 or more, ideally over 100; solids: 3–5 samples x a few hundred points); that LOD comparisons should be side by side; recovery rate, RMSE and the need for validation; interference from the matrix in real samples (blocked surface, changed plasmonics, strong signals from other compounds), and that pre-treatment or SAM modification raises selectivity at the cost of generality; that immersion gives less variability than droplet deposition; internal standards (isotopologues, similar compounds, standard addition, CMS particles) and the conclusion that quantification is possible without highly reproducible substrates; reporting of instrument performance (normal Raman spectrum of a standard solvent) | Bell et al. (Angew Chem 2020)[Reference 1] https://doi.org/10.1002/anie.201908154 | Sourced |
| That SERS enhances inelastic scattering of molecules adsorbed on corrugated metal surfaces such as silver or gold nanoparticles by up to 108 or more, with single-molecule measurement possible in some cases; the 1974 discovery by Fleischmann et al. and the independent identification in 1977 by Jeanmaire/Van Duyne and Albrecht/Creighton (EF 105–106); the link to localized surface plasmons; the electromagnetic and chemical contributions; that gaps well below 1 nm bring quantum effects that usually reduce electromagnetic enhancement; the calculation of enhancement versus surface coverage at 785, 633 and 900 nm; nanopillar leaning and replication by injection moulding; PDMS supports; the toxicity concern for CTAB and biocompatible synthesis with HEPES or ascorbic acid; substrates with less than 20% RSD, and the 1.1% RSD of liquid-liquid interface films (MeLLFs); isotope-dilution SERS; aggregation and spectral disturbance at high ionic strength in biofluid analysis; hedgehog particles (PS core with ZnO spikes and layered gold nanoparticles) dispersing in 1 M NaCl and detecting dyes in TSB and DMEM (5% FBS) with over an order of magnitude higher intensity than gold-coated beads; the construction of SERS nanotags and their advantages over fluorescent labels (multicolour, signal proportional to tag number, little photobleaching, single excitation, suppression of autofluorescence); the challenges for in-body use (stability over 24–48 h, fouling and protein corona, high biocompatibility, under 5% reaching the target organ, difficulty of scale-up with batch reproducibility); photodamage from strong lasers and remote excitation; and the statement that cartridge devices could become a promising strategy for commercial SERS sensors in the near future | Langer et al. (ACS Nano 2020)[Reference 2] https://doi.org/10.1021/acsnano.9b04224 | Sourced |
| That Raman and Krishnan reported the phenomenon in 1928 under the title "A New Type of Secondary Radiation" | Raman and Krishnan (1928)[Reference 3] https://doi.org/10.1038/121501c0 | Sourced |
| That in 1974 Fleischmann et al. reported Raman spectra of pyridine adsorbed on a silver electrode | Fleischmann et al. (1974)[Reference 4] https://doi.org/10.1016/0009-2614(74)85388-1 | Sourced |
| The 1977 report by Jeanmaire and Van Duyne on surface Raman of molecules adsorbed on an anodized silver electrode | Jeanmaire and Van Duyne (1977)[Reference 5] https://doi.org/10.1016/S0022-0728(77)80224-6 | Sourced |
| The 1977 report by Albrecht and Creighton of anomalously intense Raman spectra of pyridine at a silver electrode | Albrecht and Creighton (1977)[Reference 6] https://doi.org/10.1021/ja00457a071 | Sourced |
| That for single rhodamine 6G molecules on selected silver colloidal particles the intrinsic enhancement factors were on the order of 1014 to 1015 | Nie and Emory (1997)[Reference 7] https://doi.org/10.1126/science.275.5303.1102 | Sourced |
| That SRM 2241 is a relative intensity correction standard for Raman at 785 nm, a chromium-doped (0.02 mole fraction Cr2O3) sodium borosilicate glass (about 10 mm x 10 mm x 1.65 mm); that its certified values are the shape of the luminescence spectrum over 200–3500 cm−1; that it is used for the intensity-response correction unique to each Raman system; and that it was issued on 7 January 2022 with validity until 31 December 2026 | NIST SRM 2241 certificate[Reference 8] https://tsapps.nist.gov/srmext/certificates/2241.pdf | Sourced |
| That Silmeco designs its gold SERStrate for 785 nm and its silver SERStrate for 532–785 nm excitation, offers custom versions matched to the excitation wavelength, and describes its process as lithography-free with two simple steps (the manufacturer's stated description) | Silmeco product page[Reference 9] https://www.silmeco.com/products/ | Sourced |
| Signal per unit area about 136 times the surface average (80 / 0.59) and about 670 times the rest; the enhancement-factor example (ratio 200, NRS 5×10¹¹, NSERS 1×10⁶ giving 1×10⁸, and 1×10⁸ giving 1×10⁶) | Our calculation. The 0.59% and 80% are from Reference 1's calculated example; the intensity ratio and molecule counts are assumptions set by this article. The 670-fold figure is 80 / 0.59 divided by (20 / 99.41). These are not measured enhancement factors | Our calculation |
| The explanation of Raman, Stokes and anti-Stokes scattering; the energy levels and spectrum in Fig. 1; the reading that substrate selection and surface chemistry are important; the division of labour around internal standards; and the last sentence of Fig. 6 | Our commentary based on general optics and spectroscopy and on the statements in References 1 and 2; not values checked against an individual primary source | Commentary |
| Specific examples of review or approval of SERS-based IVD devices; figures for ageing of silver and gold nanostructures in storage; manufacturer-to-manufacturer comparisons of reproducibility of commercial SERS substrates; an official review document showing the biocompatibility or in-body safety of SERS tags; the record of current commercial analytical SERS sensors | Could not be confirmed from primary sources within the scope of this article, so none is stated (the Silmeco page stresses reproducibility, but the test conditions behind any figure could not be confirmed) | Not yet confirmed |
| That Figs. 1, 2, 3, 5 and 6 are explanatory drawings rather than measured data, and that the hero image and Fig. 4 are AI-generated images | Our note | Commentary |
Last updated October 2026. Sources are limited to primary material (an international review and recommendations paper, original papers, a NIST certificate and a manufacturer's product page). Statements from the manufacturer (Silmeco) are the manufacturer's stated descriptions, not third-party verification of performance. Because the article includes structural readings and materials-design interpretations, those are marked as Commentary and kept separate from sourced fact. Examples of regulator-reviewed diagnostic devices based on SERS, figures for ageing of silver and gold nanostructures in storage, manufacturer-to-manufacturer comparisons of reproducibility of commercial SERS substrates, and official review documents on the in-body safety of SERS tags are not stated here because no primary source could be confirmed. The calculation in Chapter 4 is an illustration using assumed values. This article explains materials, principles and evaluation; it is not medical advice on diagnosis, treatment or how to read test results. Figs. 1, 2, 3, 5 and 6 are vector drawings; the hero image and Fig. 4 are AI-generated images, and none of them shows a real instrument, substrate or measurement result.