TECHNOLOGY EXPLAINER
Surface Plasmon Resonance (SPR)
— reading the “weight” of molecules as a refractive index on a thin gold film
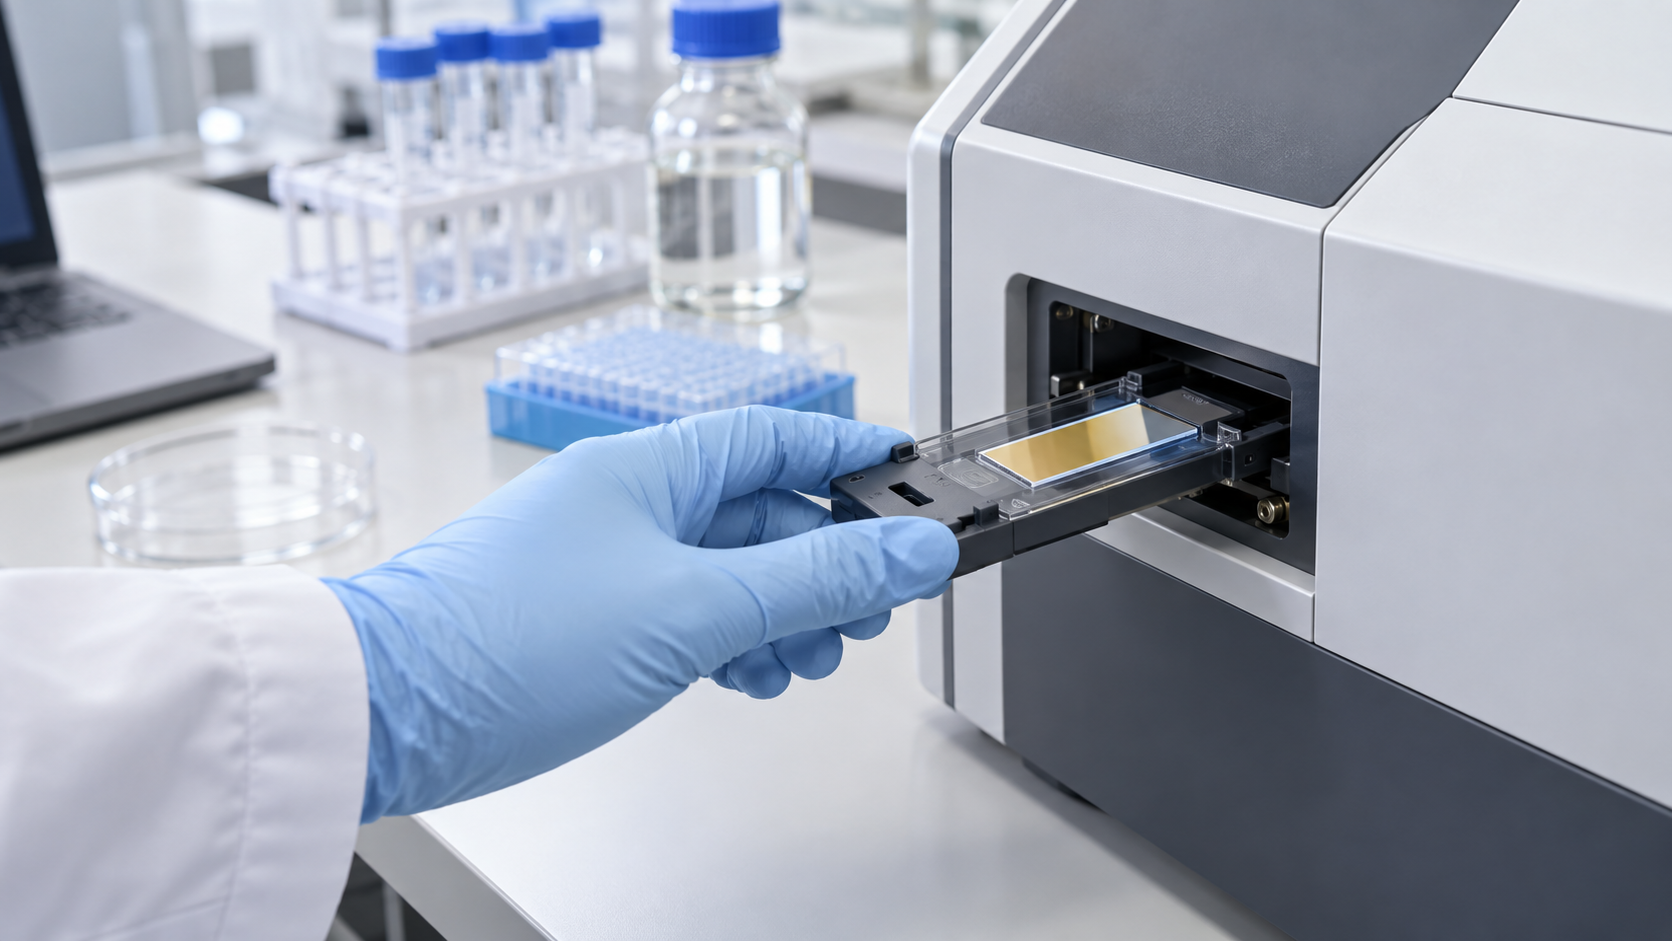
SPR uses an optical resonance on the surface of a thin metal film, usually gold, to follow molecules binding to that surface without labels and in real time. What it measures is not the molecule itself but the change in refractive index right next to the surface. For a materials engineer, that leaves two things that matter: a gold film a few tens of nanometres thick and the molecular layer built on top of it. The surface chemistry decides what can bind; the mass of what binds, and how much unwanted material sticks to the surface (non-specific adsorption), decide how small a signal can be read. This article covers the principle (the Kretschmann configuration), the materials in a sensor chip, how SPR is used to analyse molecular interactions, localized SPR (LSPR) and how to read a detection limit, drawing on manufacturer documentation and peer-reviewed papers.
- What SPR is, in three lines
- Principle: what happens in the Kretschmann configuration
- The signal unit and its size: RU, and our calculation
- Materials in the sensor chip: gold film, adhesion layer, surface layer
- A materials engineer's view 1: gold sets the sensitivity, the surface layer sets selectivity and lifetime
- How SPR is used to analyse molecular interactions
- Localized SPR (LSPR): measuring with nanostructures
- Reading a detection limit: start from mass on the surface, not concentration
- A materials engineer's view 2: fouling can weigh as much as a small molecule's signal
- Where SPR stands in practice, and what we could not confirm
- Glossary / References / Claim-to-source audit
Sourced = stated in published material or a paper (link given)
Our calculation = a figure this article derived, with the assumptions spelled out
Not yet confirmed = at the research stage or an outlook, with no confirmed practical record
Structural readings and materials-design interpretations are marked separately as Commentary.
This article explains materials, principles and evaluation. It is not medical advice on diagnosis, treatment or how to read test results, and it does not recommend any product.
The photodiodes and other detectors that receive the light are covered in our explainer on photodetectors (optical communications and photonics series).
1. What SPR is, in three lines
- What it measures: one review describes SPR as measuring “refractive index changes in the vicinity of thin metal layers (gold, silver or aluminum films)”. A capture molecule such as an antibody or receptor is fixed to the surface, the sample flows over it, and the rise in refractive index caused by binding is followed in real time Sourced
- What it is made of: in Biacore (GE Healthcare) documentation, the representative sensor chip (Series S CM5) is “a glass slide coated with a thin layer of gold, to which a matrix of carboxymethylated dextran is covalently attached”, and the gold is required to generate the SPR response Sourced
- Where it is hard: the signal is proportional to the mass that binds. The smaller the molecule, the smaller the signal, and the more it is affected by anything else that sticks to the surface (non-specific adsorption) Sourced (from the documentation). We put numbers on this in Chapters 3 and 8
An SPR detection limit starts from “mass accumulated on the surface”, not from “concentration”. For the same signal size, a large molecule such as an antibody and a small molecule of a few hundred daltons correspond to solution concentrations that differ by orders of magnitude (our calculation, Chapter 8). Even if a catalogue or paper says “detection limit X”, you cannot compare it until you know what was measured, under what conditions and with which definition (commentary).
2. Principle: what happens in the Kretschmann configuration
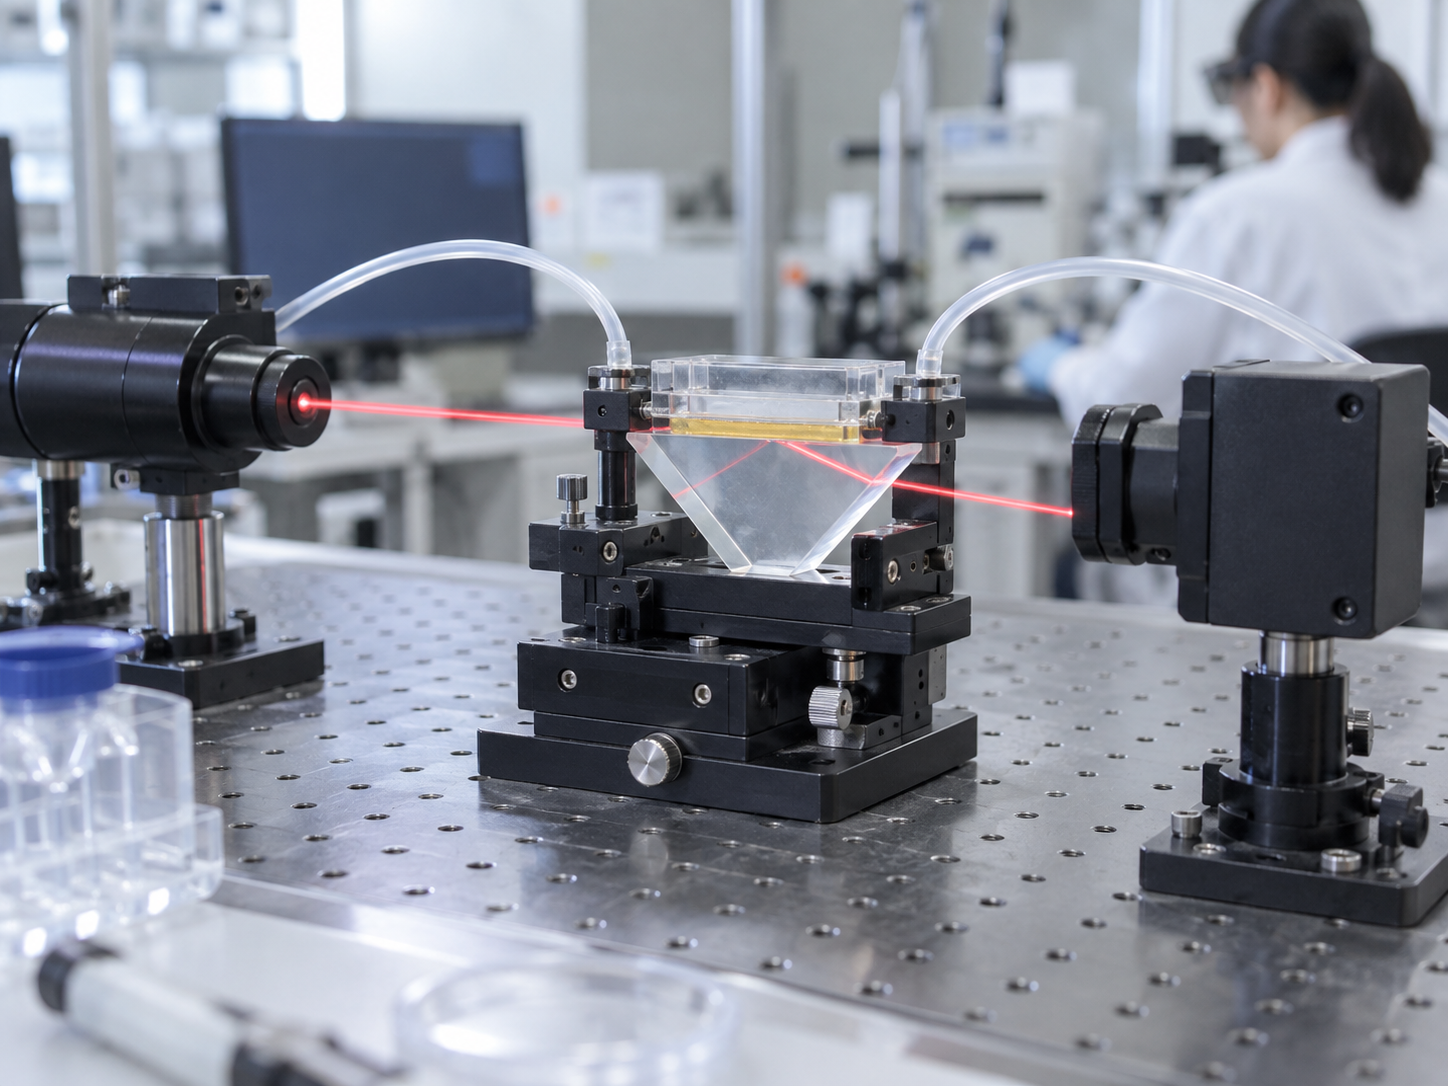
In the commercial SPR biosensor configuration described in a review, a high-refractive-index glass prism carries a thin gold film on its base, and the sample solution flows on the other side of the film. This is the Kretschmann configuration, a form of attenuated total reflection (ATR). The review explains that when light strikes the metal surface at a certain angle, part of its energy couples with electrons in the metal and travels along the surface as a plasmon, and that the angle at which resonance occurs (the SPR angle) is set by the refractive index of the material near the metal surface Sourced. The configuration is named after a 1968 report by Kretschmann and Raether on exciting surface plasmons with light Sourced. A paper on SPR for gas detection and biosensing was published by Liedberg and co-workers in 1983 Sourced.
As a general optical explanation of why a prism is used (this is not a sourced fact; it is our commentary): light in air or in solution cannot couple directly to the plasmon on a metal surface. When light is totally reflected inside a high-index prism, an evanescent field (light that leaks a short distance beyond the reflecting surface) appears just outside the surface, and this passes through the gold film and meets the conditions for coupling to the plasmon. How far the leak reaches is only a short distance from the surface: the review gives “around 300 nm from the boundary between the metal surface and sample solution”, and in another place “near the metal surface (~200 nm)” Sourced. That one review words the distance differently in two places suggests it should be read as a rough guide that depends on wavelength, materials and conditions (commentary).
The light is received, and the shift in angle or wavelength is read, by a photodiode or image sensor. Their materials and operation are covered in our explainer on photodetectors. For this article, all you need is that a “shift in angle (or wavelength)” becomes the signal for the amount bound.
3. The signal unit and its size: RU, and our calculation
Biacore-type instruments express the SPR response in resonance units (RU). A patent specification from Biacore AB states: “One RU represents a change of 0.0001° in the angle of minimum reflected light intensity, which for most proteins and other biomolecules correspond to a change in concentration of about 1 pg/mm² on the sensor surface” Sourced. The instrument documentation likewise says the response is proportional to the mass of molecules on the surface Sourced. In other words, SPR reads not “how many molecules bound” but “how many picograms of mass bound”.
We use “1 RU ≈ 1 pg/mm²” from above together with the maximum-response formula in the instrument documentation (Rmax = analyte molecular weight / ligand molecular weight × immobilized amount × stoichiometric ratio) Our calculation.
- Molecules per RU: for an IgG antibody (assuming a molecular weight of 150,000), 1 pg = 10−12 g. 10−12 / 150,000 = 6.7×10⁻¹⁸ mol. Multiplied by Avogadro's number, 6.02×10²³, this is about 4.0×10⁶ molecules/mm². For a protein of molecular weight 10,000 it is about 6.0×10⁷ molecules/mm²
- An Rmax example: on a surface carrying 5,000 RU of a protein of molecular weight 50,000 (assuming 1:1 binding), a small compound of molecular weight 300 gives Rmax = 300 / 50,000 × 5,000 = 30 RU. An antibody of molecular weight 150,000 binding to the same surface gives 150,000 / 50,000 × 5,000 = 15,000 RU. The ratio is 150,000 / 300 = 500-fold
Assumptions and limits: the molecular weights, immobilized amount and stoichiometry are our assumptions. Measured maximum responses are lower than calculated values when the immobilized molecule is not fully active or binding is sterically hindered (the documentation also says the theoretical value tends to exceed the measured one Sourced). 1 RU ≈ 1 pg/mm² is a guide for “most biomolecules” and may differ by chip type and molecule.
SPR has one more characteristic behaviour. If the sample solution merely differs in refractive index from the buffer flowing over the surface, the signal rises while it is injected (the bulk refractive index effect). The instrument documentation says this does not affect the binding itself, but recommends diluting the sample in running buffer to keep it small, and placing measurement points just before and just after the injection while only buffer is flowing, so that the difference is read Sourced. The instrument has a reference flow cell, and its signal is subtracted to remove the bulk contribution. The documentation also warns that non-specific binding is not necessarily the same on the reference and active surfaces, so it cannot be corrected exactly by subtraction Sourced.
4. Materials in the sensor chip: gold film, adhesion layer, surface layer
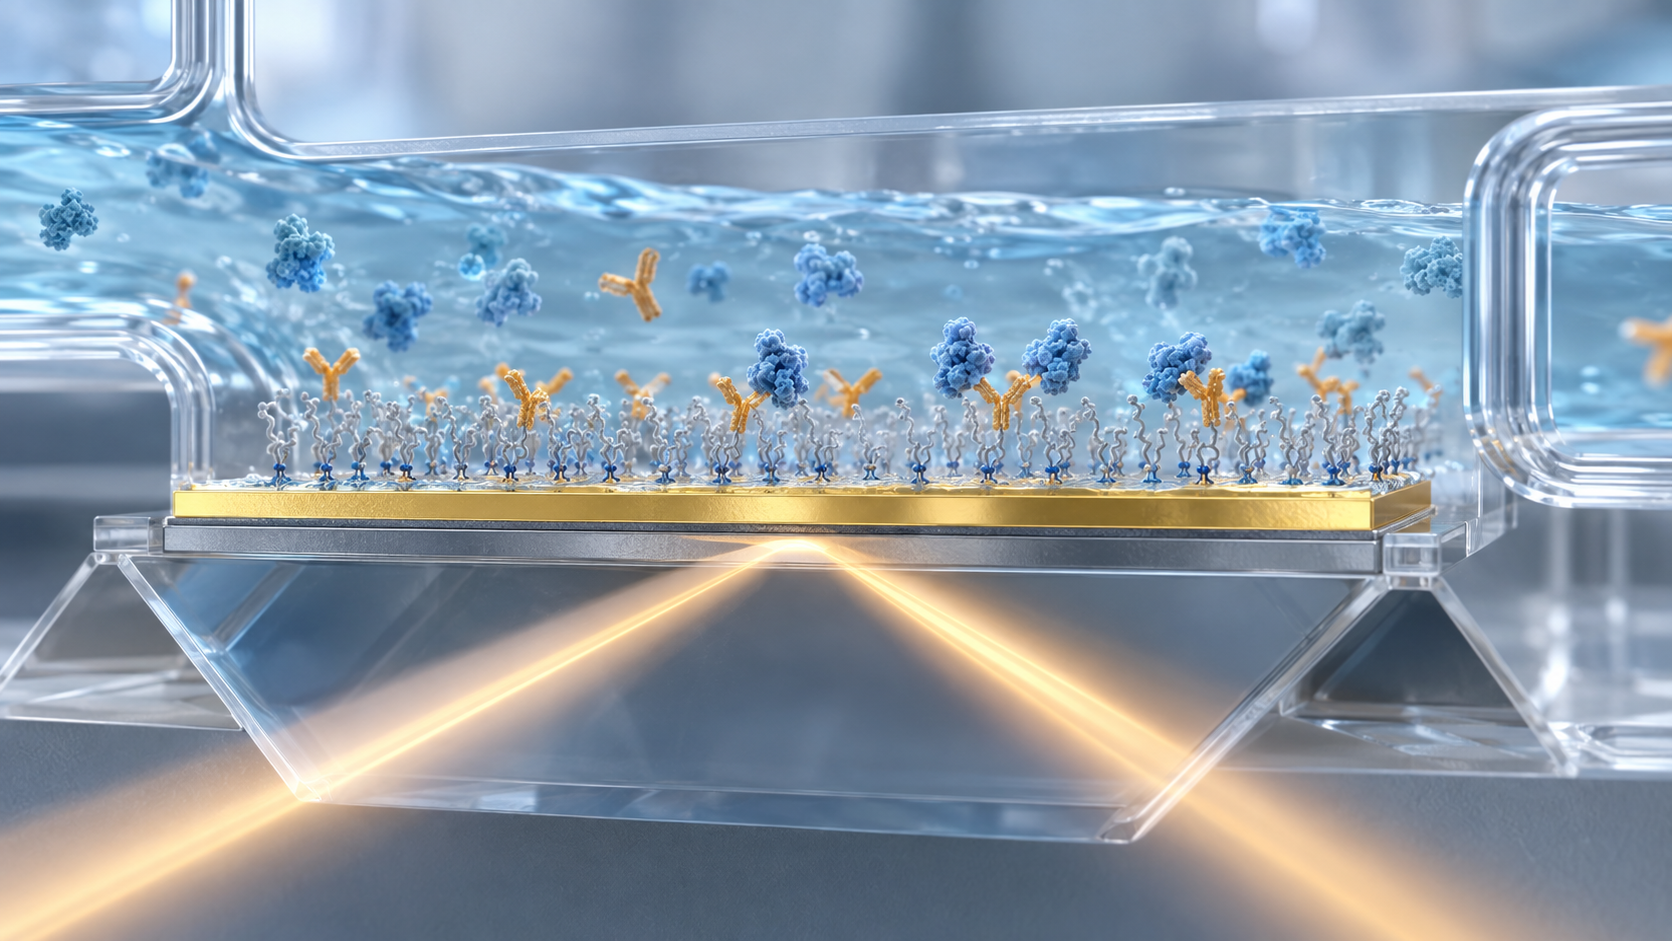
An SPR sensor chip is a glass substrate carrying a thin gold film, with a surface layer for immobilizing molecules on top. The representative Biacore chip (CM5) has a carboxymethylated dextran matrix covalently attached to the gold. The instrument documentation says this dextran “allows covalent immobilization of biomolecules using well-characterized chemistry and provides a hydrophilic environment suitable for a wide variety of protein interactions” Sourced.
View the original SVG schematic, source notes and numerical details
(1) Gold film and adhesion layer
As an example of a gold film used in research, an experiment that compared propagating SPR and localized SPR on biotin–avidin binding used a 50 nm gold film Sourced (Chapter 7). That gold is chemically stable and easy to modify with thiols is usually given as the reason it is chosen for bio applications (commentary; this is not a statement we checked against an individual primary source). Gold deposited directly on glass peels easily, so a thin adhesion layer of chromium or titanium is commonly placed between them (also commentary). A metal adhesion layer is, however, an optical loss. One paper states that “the use of a metallic adhesion layer between plasmonic-active nanostructures and a solid support is known to dampen the plasmonic response” and reports a way to attach gold without one Sourced.
(2) Gold or silver?
Silver can be more sensitive than gold but is unstable in aqueous media. A paper reporting a gold-silver-gold trilayer chip (a further gold buffer layer between the silver and the chromium adhesion layer) says that “the silver surface plasmon resonance sensor has long been explored due to its intrinsic sensitivity enhancement over the conventional single-layered gold SPR sensor” but has not been used in practice because of pronounced instability. It reports that the new chip kept its integrity after prolonged agitation in phosphate-buffered saline and gave more than 50% higher sensitivity and signal-to-noise ratio than a single gold layer chip in SPR microscopy at 660 nm Sourced. This is the result of one study under protein-array conditions.
(3) Surface layer: how immobilization works, and designs that avoid fouling
Biacore's documentation describes immobilization on the dextran surface in detail. EDC and NHS activate the carboxyl groups on the surface; amino groups on the ligand (the molecule to be immobilized) then react and bind covalently, and ethanolamine finally deactivates any remaining active esters Sourced. What makes immobilization work is the electrostatic attraction (pre-concentration) to the negatively charged dextran. The documentation says the dextran carries a net negative charge at pH above about 3.5, so the buffer pH should be above 3.5 and below the isoelectric point of the ligand; that ionic strength must be low (about 10 mM monovalent cations) for the attraction to occur; that buffer components containing primary amines (such as Tris) and sodium azide should be avoided because they interfere; and that 10 mM sodium acetate at pH 4.5 works well for many proteins Sourced. The concentration effect can reach “several thousand-fold” Sourced.
With complex samples such as plasma or serum, non-specific adsorption of proteins on the surface is the biggest obstacle to measurement. Work is therefore under way to build the surface layer from low-fouling materials. For a surface of the zwitterionic polymer poly(carboxybetaine acrylamide) (polyCBAA), one paper reports total non-specific protein adsorption below 3 ng/cm² from undiluted blood plasma and compares it with a conventional oligo(ethylene glycol)-based surface Sourced. A 2015 review covers how low-fouling coatings are made, from self-assembled monolayers and PEG derivatives to ultra-low-fouling polymer brushes, and their use for blood plasma and serum analysis Sourced.
5. A materials engineer's view 1: gold sets the sensitivity, the surface layer sets selectivity and lifetime
Looked at as a material, the gold film and substrate are the “optical component”, and its specification is relatively well understood. Whether a measurement succeeds, on the other hand, depends on the layer above it, a few nanometres to a few hundred nanometres thick: the immobilization chemistry, how well it resists fouling and how well it survives regeneration (commentary).
- The pH and ionic strength of immobilization are where the material's chemistry shows: attraction into the dextran by its negative charge depends on the ligand's isoelectric point relative to the pH. The documentation gives an example in which lower pH attracted more strongly but gave a lower final immobilization level (at pH 4.0 the pre-concentration response was large, yet the final level was lower than at the other pH values tested Sourced). The strength of attraction and the efficiency of the reaction are separate things
- Regeneration is a durability test for the surface: after each measurement, bound molecules are washed off with, for example, glycine-HCl (acid) or sodium hydroxide (base) so that the surface can be reused Sourced. The documentation recommends at least five cycles of binding and regeneration when testing new regeneration conditions, to see whether the immobilized ligand stays active Sourced. So the surface layer has to withstand repeated exposure to acid, base and high salt (commentary)
- A threshold for fouling: the target for low-fouling coatings is a few ng/cm² or less from undiluted plasma (Chapter 9 compares this with the signal of a small molecule)
- Thick three-dimensional layers and thin two-dimensional layers: a thick layer such as dextran gives more immobilization capacity but brings diffusion and steric effects. One chapter names mass-transport limitation and surface heterogeneity as the two main reasons kinetics deviate from ideal behaviour Sourced (Chapter 6). A thin monolayer has the opposite character, as a general reading (commentary)
6. How SPR is used to analyse molecular interactions
SPR is used most often to measure how strongly and how fast two molecules bind and come apart. A review says it has been used to evaluate affinity, specificity and kinetics across many pairings: antibody–antigen, receptor–drug, enzyme–substrate or inhibitor, DNA hybridization and others Sourced.
A summary of the instrument documentation Sourced: the immobilized side is the ligand and the side that flows is the analyte. The time course of the response (RU) is a sensorgram; the rise during injection gives the association rate and the fall after injection gives the dissociation rate (a review says that association and dissociation rate constants can be determined Sourced). The documentation also says that a low maximum response (Rmax) is often beneficial for kinetic analysis and that higher immobilization levels are advantageous for concentration measurements Sourced.
A chapter by Schuck and Zhao names mass-transport limitation and heterogeneity of binding sites on the surface as the two most common reasons that SPR binding kinetics deviate from ideal pseudo-first-order behaviour. It says both are “intrinsic to the use of a biosensor surface for characterizing interactions”, that the assumptions of the analysis model need to be tested critically, and that experimental design and controls need to address them Sourced. So the rate constants you obtain are apparent values for molecules held on a surface and are not necessarily the same as values in solution (commentary).
7. Localized SPR (LSPR): measuring with nanostructures
Gold and silver nanoparticles and nanostructures also have a resonance in which electrons oscillate collectively when excited by light (localized surface plasmon resonance, LSPR). Arrangements that need no prism are used, and the resonance position moves with the refractive index around the particle (the arrangement is our commentary). A classic report using triangular silver nanoparticles (about 100 nm wide and 50 nm high) exploits the fact that the peak wavelength of the resonance is sensitive to particle size, shape and the external dielectric environment within about 10–30 nm. Exposing biotin-functionalized particles to 100 nM streptavidin red-shifted the resonance by 27.0 nm, and the limit of detection was reported as “in the low-picomolar to high-femtomolar region” Sourced. This was a model system with the very strong biotin–streptavidin pair, not performance in real samples such as blood.
One experiment compared propagating SPR (a 50 nm gold film) and LSPR (gold nanodisks) under the same conditions and at the same resonance wavelength (about 700 nm). The bulk refractive-index figure of merit was better for SPR, but in a biotin–avidin binding experiment the two platforms performed very similarly. The authors concluded that LSPR sensing based on simple transmission or reflection measurements is highly competitive with the traditional SPR sensor Sourced. What can be said from this is that “a larger bulk refractive-index sensitivity does not by itself make a better detector of surface binding” (commentary).
8. Reading a detection limit: start from mass on the surface, not concentration
First, the definitions. A clinical-laboratory explainer distinguishes three terms Sourced.
- Limit of blank (LoB): the highest apparent analyte concentration expected when replicates of a blank sample containing no analyte are tested. LoB = mean(blank) + 1.645 × SD(blank)
- Limit of detection (LoD): the lowest concentration likely to be reliably distinguished from the LoB. LoD = LoB + 1.645 × SD(low-concentration sample)
- Limit of quantitation (LoQ): the lowest concentration at which the analyte can be not only detected but also quantified while meeting predefined goals for bias and imprecision. It may equal the LoD or be much higher
The SPR review says the detection limit of an SPR biosensor depends on many factors, including molecular weight, optical properties, binding affinity and the surface coverage of the probe, and gives a typical value of on the order of 10 pg/mL Sourced. That passage does not say which molecule, which sample or which definition the 10 pg/mL refers to (within what we could check in this article).
We convert the 10 pg/mL above into molar concentration as a worked example (it does not mean the review's value applies to these molecules) Our calculation.
- IgG antibody (assuming a molecular weight of 150,000): 10 pg/mL = 10−8 g/L. 10−8 / 150,000 = 6.7×10⁻¹⁴ mol/L = about 67 fM (femtomolar)
- A small compound (assuming a molecular weight of 300): 10−8 / 300 = 3.3×10⁻¹¹ mol/L = about 33 pM (picomolar)
- The ratio is 150,000 / 300 = 500-fold. For the same limit in mass terms, the small molecule needs a 500-fold higher molar concentration
Assumptions and limits: the molecular weights are our assumptions. Put the other way, a statement such as “SPR detects down to fM” means nothing without the size of the molecule and the conditions of the sample (commentary).
Checkpoints for reading a reported value
| What to check | Why | Basis |
|---|---|---|
| Unit: RU, ng/cm² or concentration | An SPR signal is surface mass. Converting to concentration needs the molecular weight (calculation above) | Sourced (RU definition) + our calculation |
| Sample: buffer or plasma | A buffer value cannot simply be carried over to plasma, where non-specific adsorption adds to the signal | Sourced (References 10, 12) |
| Direct measurement, or amplified / sandwich | The Tau value of 10 fM comes from a sandwich assay with an aptamer and an antibody, not from label-free direct binding | Sourced (Reference 12) |
| Definition of LoB and LoD, and number of replicates | The value changes with how the blank SD is taken, and simple definitions such as “three times the noise” differ from the statistical one | Sourced (Reference 14) |
| Reference-surface correction and controls | Non-specific adsorption cannot be corrected exactly by subtracting a reference surface; check how same-chip controls were used | Sourced (References 2, 12) |
| Model system or real sample | A value for a very strong pair such as biotin–streptavidin does not indicate performance for a typical antigen–antibody pair | Commentary (based on Reference 6) |
The “Basis” column shows which source supports each row.
The Tau protein example is a good model for reading such values. The paper reports that a DNA aptamer/antibody sandwich assay on a multichannel SPR platform detected Tau down to 10 fM in undiluted plasma. To work in plasma it developed a tailored mixed-monolayer surface chemistry and a method of normalizing the signal to same-chip control measurements on reference channels. It also states a “1000-fold performance enhancement of SPR” over ELISA in the same plasma and that both spiked and native concentrations that ELISA could not measure were measured Sourced. This is the authors' report; it does not show performance usable for any specific clinical decision (diagnostic testing for Alzheimer's disease is a research challenge mentioned in the paper's background).
9. A materials engineer's view 2: fouling can weigh as much as a small molecule's signal
A paper on a low-fouling coating reports total non-specific adsorption of less than 3 ng/cm² from undiluted plasma Sourced. Converting with the guide from Chapter 3 (1 RU ≈ 1 pg/mm²) gives Our calculation: 1 pg/mm² = 100 pg/cm² = 0.1 ng/cm², so 3 ng/cm² = 30 pg/mm² ≈ 30 RU.
That 30 RU is the same size as the maximum response (30 RU) of the small compound (molecular weight 300) calculated in Chapter 3. Of course 3 ng/cm² is an upper bound (“less than”), the instrument used was different, and the 1 RU ≈ 1 pg/mm² conversion is a guide. Even so, what it shows is that in a complex sample such as plasma, the upper bound of “dirt” can fall in the same range as the largest signal of a small molecule (commentary).
That is why, for small-molecule SPR measurements, the low-fouling quality of the surface (a materials matter), the design of the reference surface (controls) and sample pre-treatment matter more than sensitivity itself. This overlaps with the viewpoint in our explainer on label-free detection and limits of detection.
10. Where SPR stands in practice, and what we could not confirm
(1) A tool for research and development
The review presents SPR as a method widely used in research, for analysing molecular interactions, drug-discovery screening, and immunology, genetics and protein studies Sourced. The Biacore instrument documentation is also centred on laboratory experimental procedures: sample preparation, immobilization and the search for regeneration conditions Sourced.
(2) Challenges in taking it to the point of care
In its conclusion the same review says that whether SPR is suitable for point-of-care (POC) testing has not been completely solved, and gives these reasons Sourced.
- An inherent drawback: non-specific binding interferes with the signal
- In a POC setting, the kinetic and equilibrium constants SPR provides are of little significance
- Current SPR instruments are bulky and costly, which is an obstacle to commercialization
- More research is needed on chip chemistry and antifouling, signal amplification and miniaturization
Specific examples of SPR-based in vitro diagnostic (IVD) devices reviewed by regulators such as FDA or PMDA could not be confirmed from primary sources within the scope of this article. The Biacore documentation we used also contained no statement of intended use for diagnostic purposes that we could find. We could not open the manufacturer's site to check the specifications of current commercial SPR instruments (noise, refractive-index resolution and so on), so no such figures are given. Smartphone-linked LSPR and similar approaches are mostly at the research-report stage, and their practical level is Not yet confirmed.
- SPR reads “mass on the surface” as refractive index. 1 RU is about 1 pg/mm² (as stated in a Biacore AB patent) Sourced
- The smaller the molecule, the smaller the signal. In the worked example, Rmax differs 500-fold between an antibody and a compound of molecular weight 300 Our calculation
- The chip is an “optical part (gold)” plus a “chemical part (surface layer)”. A metal adhesion layer can damp resonance; silver is sensitive but unstable Sourced
- In interaction analysis, watch mass transport and surface heterogeneity. The rate constants obtained are apparent values for molecules held on a surface Sourced
- LSPR can be read with simple optics, but higher bulk sensitivity does not make a better binding detector. In a direct comparison, binding performance was similar Sourced
- Read a detection limit by checking unit, sample, method and definition. The same 10 pg/mL is about 500 times apart in molar terms depending on the molecule Our calculation
11. Glossary
- Surface plasmon resonance (SPR)
- Coupling of light with collective electron oscillation on a thin metal film. Sensitive to the refractive index nearby.
- Kretschmann configuration
- A thin metal film on the base of a prism, with surface plasmons excited by totally reflected light.
- Evanescent field
- Light field that leaks a short distance beyond a totally reflecting surface.
- RU (resonance unit)
- The response unit of Biacore-type instruments. 1 RU ≈ 1 pg/mm² (guide for biomolecules).
- Sensorgram
- Plot of response against time. Shows how fast binding and dissociation occur.
- Ligand / analyte
- The molecule fixed on the surface / the molecule flowed over it (Biacore terminology).
- Rmax
- Maximum response when the surface is saturated. Can be estimated from molecular weights and immobilized amount.
- Bulk refractive index effect
- A step in signal caused by a refractive-index difference between sample and buffer, unrelated to binding.
- Regeneration
- Washing off bound molecules so that the surface can be reused.
- Localized SPR (LSPR)
- Resonance in metal nanoparticles or nanostructures. The resonance wavelength moves with the surrounding refractive index.
- Non-specific adsorption
- Molecules other than the target sticking to the surface. Also called biofouling.
- Pre-concentration
- Attracting the molecule to be immobilized to the surface by the negative charge of dextran, concentrating it there.
- LoB / LoD / LoQ
- Limit of blank / limit of detection / limit of quantitation, as statistically defined.
- Mass-transport limitation
- When the rate at which molecules reach the surface is slower than the binding, distorting the apparent kinetics.
12. References
- Nguyen HH, Park J, Kang S, Kim M "Surface Plasmon Resonance: A Versatile Technique for Biosensor Applications", Sensors 2015;15:10481–10510 — doi.org/10.3390/s150510481
- GE Healthcare "Biacore T200 Getting Started", 28-9840-98 Edition AB (manufacturer document PDF hosted by a university) — helsinki.fi
- Biacore AB US patent US 7,373,255 B2, "Method and system for determination of molecular interaction parameters" (granted 13 May 2008) — patents.google.com
- Kretschmann E, Raether H "Radiative Decay of Non Radiative Surface Plasmons Excited by Light", Z. Naturforsch. A 1968;23:2135–2136 — doi.org/10.1515/zna-1968-1247
- Liedberg B, Nylander C, Lundström I "Surface plasmon resonance for gas detection and biosensing", Sensors and Actuators 1983;4:299–304 — doi.org/10.1016/0250-6874(83)85036-7
- Haes AJ, Van Duyne RP "A nanoscale optical biosensor: sensitivity and selectivity of an approach based on the localized surface plasmon resonance spectroscopy of triangular silver nanoparticles", J Am Chem Soc 2002;124:10596–10604 — doi.org/10.1021/ja020393x
- Svedendahl M, Chen S, Dmitriev A, Käll M "Refractometric sensing using propagating versus localized surface plasmons: a direct comparison", Nano Lett 2009;9:4428–4433 — doi.org/10.1021/nl902721z
- Bhattarai JK et al. "Adhesion layer-free attachment of gold on silicon wafer and its application in localized surface plasmon resonance-based biosensing", Sens Actuators A 2020;312:112155 — doi.org/10.1016/j.sna.2020.112155
- Wang Z et al. "Stable and sensitive silver surface plasmon resonance imaging sensor using trilayered metallic structures", Anal Chem 2014;86:1430–1436 — doi.org/10.1021/ac402126k
- Vaisocherová H et al. "Ultralow fouling and functionalizable surface chemistry based on a zwitterionic polymer enabling sensitive and specific protein detection in undiluted blood plasma", Anal Chem 2008;80:7894–7901 — doi.org/10.1021/ac8015888
- Vaisocherová H, Brynda E, Homola J "Functionalizable low-fouling coatings for label-free biosensing in complex biological media: advances and applications", Anal Bioanal Chem 2015;407:3927–3953 — doi.org/10.1007/s00216-015-8606-5
- Kim S, Wark AW, Lee HJ "Femtomolar Detection of Tau Proteins in Undiluted Plasma Using Surface Plasmon Resonance", Anal Chem 2016;88:7793–7799 — doi.org/10.1021/acs.analchem.6b01825
- Schuck P, Zhao H "The role of mass transport limitation and surface heterogeneity in the biophysical characterization of macromolecular binding processes by SPR biosensing", Methods Mol Biol 2010;627:15–54 — doi.org/10.1007/978-1-60761-670-2_2
- Armbruster DA, Pry T "Limit of blank, limit of detection and limit of quantitation", Clin Biochem Rev 2008;29(Suppl 1):S49–S52 — pubmed.ncbi.nlm.nih.gov
- Homola J "Surface plasmon resonance sensors for detection of chemical and biological species", Chem Rev 2008;108:462–493 (further reading; no figures are quoted from it here) — doi.org/10.1021/cr068107d
- Mayer KM, Hafner JH "Localized surface plasmon resonance sensors", Chem Rev 2011;111:3828–3857 (further reading; no figures are quoted from it here) — doi.org/10.1021/cr100313v
13. Claim-to-source audit
| Claim in the text | Basis | Label |
|---|---|---|
| That SPR measures refractive index changes near thin metal films (gold, silver, aluminum); that the commercial SPR biosensor configuration uses a high-index glass prism in the Kretschmann geometry (attenuated total reflection); that the SPR angle is set by the refractive index near the metal surface; that the field range is about 300 nm from the boundary and, elsewhere, about 200 nm; that association and dissociation rate constants can be determined; that the detection limit depends on molecular weight, optical properties, binding affinity and surface coverage and is typically on the order of 10 pg/mL; that SPR is used for interaction analysis (antibody–antigen, receptor–drug, enzyme–substrate, DNA and so on); and that the conclusion names POC challenges (interference by non-specific binding, low significance of kinetic constants at the point of care, bulky and costly instruments, and research needs) | Nguyen et al. (Sensors 2015)[Reference 1] https://doi.org/10.3390/s150510481 | Sourced |
| That the Series S CM5 chip is a glass slide with a thin gold layer to which a carboxymethylated dextran matrix is covalently attached; that gold is required for the SPR response; that dextran provides a hydrophilic environment; that the response is in RU and proportional to the mass on the surface; the terms ligand, analyte and sensorgram; EDC/NHS activation and ethanolamine deactivation; that dextran is negatively charged above pH about 3.5 and the buffer pH should be above 3.5 and below the ligand's isoelectric point; low ionic strength (10 mM monovalent cations); that Tris and azide interfere with NHS coupling; that 10 mM sodium acetate pH 4.5 suits many proteins; that pre-concentration can reach several thousand-fold; the example in which pH 4.0 gave a large pre-concentration response but a lower final immobilization level; the Rmax formula, that the theoretical value tends to exceed the measured one, and that a low Rmax suits kinetics and a high immobilization level suits concentration measurement; the bulk refractive index effect, the dilution recommendation, the placement of report points, reference-cell subtraction, and that non-specific binding cannot be corrected exactly by reference subtraction; the principle of regeneration and the recommendation of at least five cycles when testing new regeneration conditions | GE Healthcare, Biacore T200 Getting Started[Reference 2] https://www.helsinki.fi/assets/drupal/2024-08/BiacoreT200%20Getting%20Started.pdf | Sourced |
| That 1 RU is a change of 0.0001° in the angle of minimum reflected intensity and corresponds, for most proteins and other biomolecules, to about 1 pg/mm²; that the applicant was Biacore AB and the grant date 13 May 2008 | US patent US 7,373,255 B2[Reference 3] https://patents.google.com/patent/US7373255B2/en | Sourced |
| That the name of the Kretschmann configuration derives from the 1968 report by Kretschmann and Raether on exciting surface plasmons with light | Kretschmann and Raether (1968)[Reference 4] https://doi.org/10.1515/zna-1968-1247 | Sourced |
| That a paper on SPR for gas detection and biosensing was published in 1983 | Liedberg et al. (1983)[Reference 5] https://doi.org/10.1016/0250-6874(83)85036-7 | Sourced |
| That the LSPR wavelength of triangular silver nanoparticles (about 100 nm wide, 50 nm high) is sensitive to the external environment within about 10–30 nm; that 100 nM streptavidin gave a 27.0 nm red-shift; and that the detection limit was in the low-picomolar to high-femtomolar region (biotin–streptavidin system) | Haes and Van Duyne (2002)[Reference 6] https://doi.org/10.1021/ja020393x | Sourced |
| That propagating SPR on 50 nm gold films and LSPR on gold nanodisks were compared under identical conditions at a resonance wavelength of about 700 nm; that SPR had the better bulk refractive-index figure of merit but biotin–avidin binding performance was very similar; and the authors' conclusion that simple transmission or reflection LSPR is highly competitive | Svedendahl et al. (2009)[Reference 7] https://doi.org/10.1021/nl902721z | Sourced |
| The statement that a metallic adhesion layer is known to dampen the plasmonic response, and that organic adhesion layers can undermine film stability | Bhattarai et al. (2020)[Reference 8] https://doi.org/10.1016/j.sna.2020.112155 | Sourced |
| The statement that silver SPR sensors, more sensitive than gold, have not been practical because of instability; and that a gold-silver-gold trilayer chip held its integrity after prolonged agitation in PBS and improved sensitivity and S/N by more than 50% over single-layer gold in SPR microscopy at 660 nm | Wang et al. (2014)[Reference 9] https://doi.org/10.1021/ac402126k | Sourced |
| That a polyCBAA surface gave total non-specific protein adsorption below 3 ng/cm² from undiluted plasma, compared with an oligo(ethylene glycol)-based surface | Vaisocherová et al. (2008)[Reference 10] https://doi.org/10.1021/ac8015888 | Sourced |
| That the preparation, characterization and functionalization of low-fouling coatings (self-assembled monolayers, PEG derivatives, ultra-low-fouling polymer brushes) and their use for plasma and serum analysis are reviewed | Vaisocherová et al. (2015)[Reference 11] https://doi.org/10.1007/s00216-015-8606-5 | Sourced |
| That a DNA aptamer/antibody sandwich assay on a multichannel SPR platform detected Tau 381 down to 10 fM in undiluted plasma; the mixed-monolayer surface chemistry and normalization to same-chip reference-channel controls; the 1000-fold performance enhancement over ELISA stated by the authors; and the measurement of both spiked and native concentrations | Kim et al. (2016)[Reference 12] https://doi.org/10.1021/acs.analchem.6b01825 | Sourced |
| That mass-transport limitation and heterogeneity of surface binding sites are the two most common reasons SPR kinetics deviate from ideal pseudo-first-order behaviour, and that they are intrinsic to the use of a biosensor surface | Schuck and Zhao (2010)[Reference 13] https://doi.org/10.1007/978-1-60761-670-2_2 | Sourced |
| The definitions of LoB, LoD and LoQ, and the formulas LoB = mean(blank) + 1.645 SD and LoD = LoB + 1.645 SD (low-concentration sample) | Armbruster and Pry (2008)[Reference 14] https://pubmed.ncbi.nlm.nih.gov/18852857/ | Sourced |
| The number of IgG molecules per RU (about 4.0×10⁶/mm²), the Rmax example (30 RU and 15,000 RU, a 500-fold ratio), the conversion of 10 pg/mL to molar concentration (about 67 fM and about 33 pM), and the conversion of 3 ng/cm² to about 30 RU | Our calculation. 1 RU = 1 pg/mm², IgG molecular weight 150,000, a small compound of molecular weight 300, a ligand of molecular weight 50,000 at 5,000 RU, 1:1 stoichiometry and Avogadro's number 6.02×10²³ are assumptions or guides set by this article. The 10 pg/mL is borrowed from a review as a worked example and is not a measured value for these molecules. The 3 ng/cm² conversion is approximate because a different instrument was used | Our calculation |
| Why a prism is used (the evanescent field of total reflection meets the coupling conditions for the plasmon), why gold is chosen, the common practice of an adhesion layer, the contrast between thin monolayers and thick three-dimensional layers, the simplicity of the LSPR setup, and the roles of the layers in Fig. 4 | Our commentary based on general optics and materials explanation; not values checked against an individual primary source | Commentary |
| Specific examples of review or approval of SPR-based IVD devices; a statement of intended use for diagnostic purposes in the Biacore documentation; the noise and refractive-index resolution of current commercial SPR instruments; the molecule, sample and definition behind the review's 10 pg/mL | Could not be confirmed from primary sources within the scope of this article, so none is stated (the manufacturer's site could not be opened to check) | Not yet confirmed |
| That Figs. 1, 3, 4, 5, 6 and 7 are explanatory drawings rather than measured data, and that the hero image and Fig. 2 are AI-generated images | Our note | Commentary |
Last updated October 2026. Sources are limited to primary material (manufacturer documentation, patent specifications, and the abstracts and texts of peer-reviewed papers). Some figures in the SPR review (such as about 300 nm) are the review's own statements; the original conditions were not checked. Because the article includes structural readings and materials-design interpretations, those are marked as Commentary and kept separate from sourced fact. Examples of SPR-based diagnostic devices reviewed by regulators, the intended-use statement of Biacore instruments, the performance specifications of current commercial instruments, and the conditions behind the review's 10 pg/mL are not stated here because no primary source could be confirmed. This article explains materials, principles and evaluation; it is not medical advice on diagnosis, treatment or how to read test results. Figs. 1, 3, 4, 5, 6 and 7 are vector drawings; the hero image and Fig. 2 are AI-generated images, and none of them shows a real instrument, product or measurement result.