TECHNOLOGY EXPLAINER
Electrolyzer Stacks and Materials
— titanium, catalysts and rubber, stacked on either side of a membrane
The stack is the heart of a water electrolyzer: dozens of repeated cells, each made of a membrane electrode assembly, porous transport layers, bipolar plates, seals and clamping hardware. On the anode side the environment is acidic, high-potential and oxygen-rich, so the choice of usable metals is narrow. This article sets out, from a materials engineer's viewpoint, what the parts are made of, where they degrade, and why they dominate stack cost. The working principles of PEM and alkaline electrolysis are left to other articles. Nothing here is advice on handling hydrogen.
- What an electrolyzer stack is (the short version)
- Taking a cell apart — a map of parts and materials
- Anode-side and cathode-side environments — why metals are hard to choose
- A materials engineer's view (1): titanium is usable, not unscathed
- Membrane electrode assembly and porous transport layer — the interface sets performance
- Bipolar plates — what can replace expensive titanium
- Our calculation: how much of the degradation budget does contact resistance use?
- Seals and gaskets, and the link to adhesives and sealants
- A materials engineer's view (2): a seal stops leaks, but can also be a source of contamination
- Clamping — our calculation: the order of magnitude of the clamping load
- Stack lifetime and degradation — what happens where
- How alkaline stacks differ
- Evaluation and standards
- Challenges, and what we could not confirm
- Glossary / References / Claim-to-source audit
Sourced = stated in published material (link given)
Our calculation = a figure this article derived, with the assumptions spelled out
Not yet confirmed = a plan or target with no confirmed record of achievement
Structural readings and materials-design interpretations are marked separately as Commentary, and weakly supported ideas are labelled Inference.
Equipment that handles hydrogen and oxygen together is covered by laws and standards, in Japan for example the High Pressure Gas Safety Act, and internationally standards such as ISO 22734. This article is an explanation of materials, structure and evaluation. It is not advice on design, operation or handling.
1. What an electrolyzer stack is (the short version)
A water electrolyzer uses electricity to split water into hydrogen and oxygen. The stack is the part where that reaction actually takes place: dozens of identical cells connected in series. Everything outside the stack (power supply, water purification, gas-liquid separation, cooling, drying) is called the balance of plant (BoP)Sourced [Reference 3].
- What is stacked: an electrolyte (a membrane or diaphragm), electrodes and catalysts, porous layers that conduct electrons while letting gas and water through, bipolar plates that separate the cells, and seals that stop leaks. This is repeated, then clamped between end platesSourced [References 3, 4]
- Why materials matter: in the DOE PEM target table the stack capital cost is US$450/kW as the 2022 status value and US$100/kW as the 2026 target. IRENA says bipolar plates are only a part of stack cost in alkaline units but exceed 50% in PEM unitsSourced [References 1, 3]
- Scope: the individual principles of PEM and alkaline electrolysis are covered in this series in the explainers on PEM water electrolysis and alkaline water electrolysis. Here we stay with the structural materials common to stacks, and their degradation
Stack material choice is decided less by the catalyst than by what survives on the anode side. On the anode side of a PEM cell, carbon is oxidized and stainless steel corrodes easily, so the options narrow to titanium-based materials. Even titanium grows an oxide film over time, and its contact resistance risesSourced [Reference 4].
2. Taking a cell apart — a map of parts and materials
A PEM cell has a layer structure that is nearly symmetric about the central electrolyte membrane. The figure below is a conceptual diagram of which parts sit in which order. It does not draw the real dimensions or layer thicknesses of any product.
The IRENA report tabulates the main components of the four electrolyzer types. The rows for stack structural materials are extracted belowSourced [Reference 3].
| Component | Alkaline | PEM | AEM |
|---|---|---|---|
| Porous transport layer, anode | Nickel mesh (not always present) | Platinum-coated sintered porous titanium | Nickel foam |
| Porous transport layer, cathode | Nickel mesh | Sintered porous titanium, or carbon cloth | Nickel foam, or carbon cloth |
| Bipolar plate, anode | Nickel-coated stainless steel | Platinum-coated titanium | Nickel-coated stainless steel |
| Bipolar plate, cathode | Nickel-coated stainless steel | Gold-coated titanium | Nickel-coated stainless steel |
| Frames and sealing | PSU, PTFE, EPDM | PTFE, PSU, ETFE | PTFE, "Silicon" (spelled as in the table) |
Rows extracted from IRENA (2020), Table 1 (the table is based on IRENA's analysis). The table's note says the coloured cells are conditions or components that vary significantly among manufacturers and research institutes. "Silicon" under AEM is the table's own wording, and the report gives no explanation of it that we could find.
The table is IRENA's 2020 summary, and current products do not necessarily match it (Commentary). Even so, it shows that precious-metal coatings (platinum, gold) appear only in the PEM column, not in the alkaline or AEM columns. This corresponds to the difference in the severity of the environment described in the next chapter.
3. Anode-side and cathode-side environments — why metals are hard to choose
The PEM membrane is a solid strong acid carrying sulfonic acid groups. On its anode side water is oxidized and oxygen evolves. The review by Babic et al. states that the anode potential is above 1.4 V, and that under these conditions carbon is oxidized and so cannot be used even as a catalyst supportSourced [Reference 4]. The same review notes that high potentials limit stainless-steel components through corrosion, and that titanium is the state-of-the-art material for the anode-side porous transport layer and bipolar plate [Reference 4].
The cathode side, in contrast, is where hydrogen evolves. Babic et al. state that on the high-pressure hydrogen side titanium hydride formation can be significant, which weakens the titaniumSourced [Reference 4]. They also summarize the literature as saying that chemical degradation (thinning) of the membrane is more pronounced on the cathode side: hydrogen peroxide and radicals formed from crossed-over oxygen and hydrogen adsorbed on the platinum catalyst attack the ionomer [Reference 4].
4. A materials engineer's view (1): titanium is usable, not unscathed
Titanium survives acidic, high-potential conditions because an oxide film on its surface protects the metal beneath. That is ordinary corrosion-resistant behavior. In an electrolyzer, however, the same oxide film gets in the way of the electron path.
- Lettenmeier et al. state that natural passivation of titanium forms an amorphous, semiconducting TiO2−x layer on the surface, so an additional coating of gold or platinum is needed to keep contact resistance lowSourced [Reference 5].
- Babic et al. state that titanium develops an oxide layer over time, lowering effective conductivity and cell performance, and that once the reversible cation contamination is dealt with, passivation of the Ti porous transport layer is the main contribution to performance deteriorationSourced [Reference 4].
- The JRC report also lists, as an example of stack performance degradation, passivation by titanium oxide formation on Ti-based porous transport layers and bipolar platesSourced [Reference 8].
So the reality is not "titanium is safe" but "titanium is the only option, and its surface state has to be managed throughout" (Commentary). Keeping the oxide thin, covering it with a thin precious metal or nitride, and maintaining contact pressure all come down to one number: contact resistance. Chapter 7 estimates its size.
Frensch et al. ran a PEM cell for about 500 hours in seven operating modes (constant current, constant voltage, current cycling and others) and compared them. With faster current cycling, total ohmic resistance fell, as it also does during the break-in phase, but fluoride emission from the catalyst binder increased, raising a concern that membrane thinning would increase gas crossover. In the other modes ohmic resistance rose, and passivation of the titanium components is suspected. They also state that higher temperature improves performance but aggravates both membrane thinning and passivationSourced [Reference 7]. This is a result for a single laboratory cell over about 500 hours, and does not directly indicate the lifetime of a commercial stack.
5. Membrane electrode assembly and porous transport layer — the interface sets performance
(1) The membrane electrode assembly (MEA)
At the center of a PEM cell is the catalyst-coated membrane (CCM): an electrolyte membrane with a catalyst layer on each face. The review by Babic et al. gives the electrolyte thickness as about 0.2 mm and says that, because its ohmic resistance is low compared with an alkaline cell with liquid electrolyte, the cell can run at current densities of 1–3 A/cm² and at high differential pressureSourced [Reference 4]. Iridium oxide (IrO2) is used as the anode catalyst. The same review explains that ruthenium oxide is more active but its dissolution and corrosion rate is unacceptably high, so iridium remains the choice [Reference 4]. Catalyst loading and resource constraints are covered in this series in the explainer on platinum-group metals and catalysts.
(2) The porous transport layer (PTL) — the path for water and gas
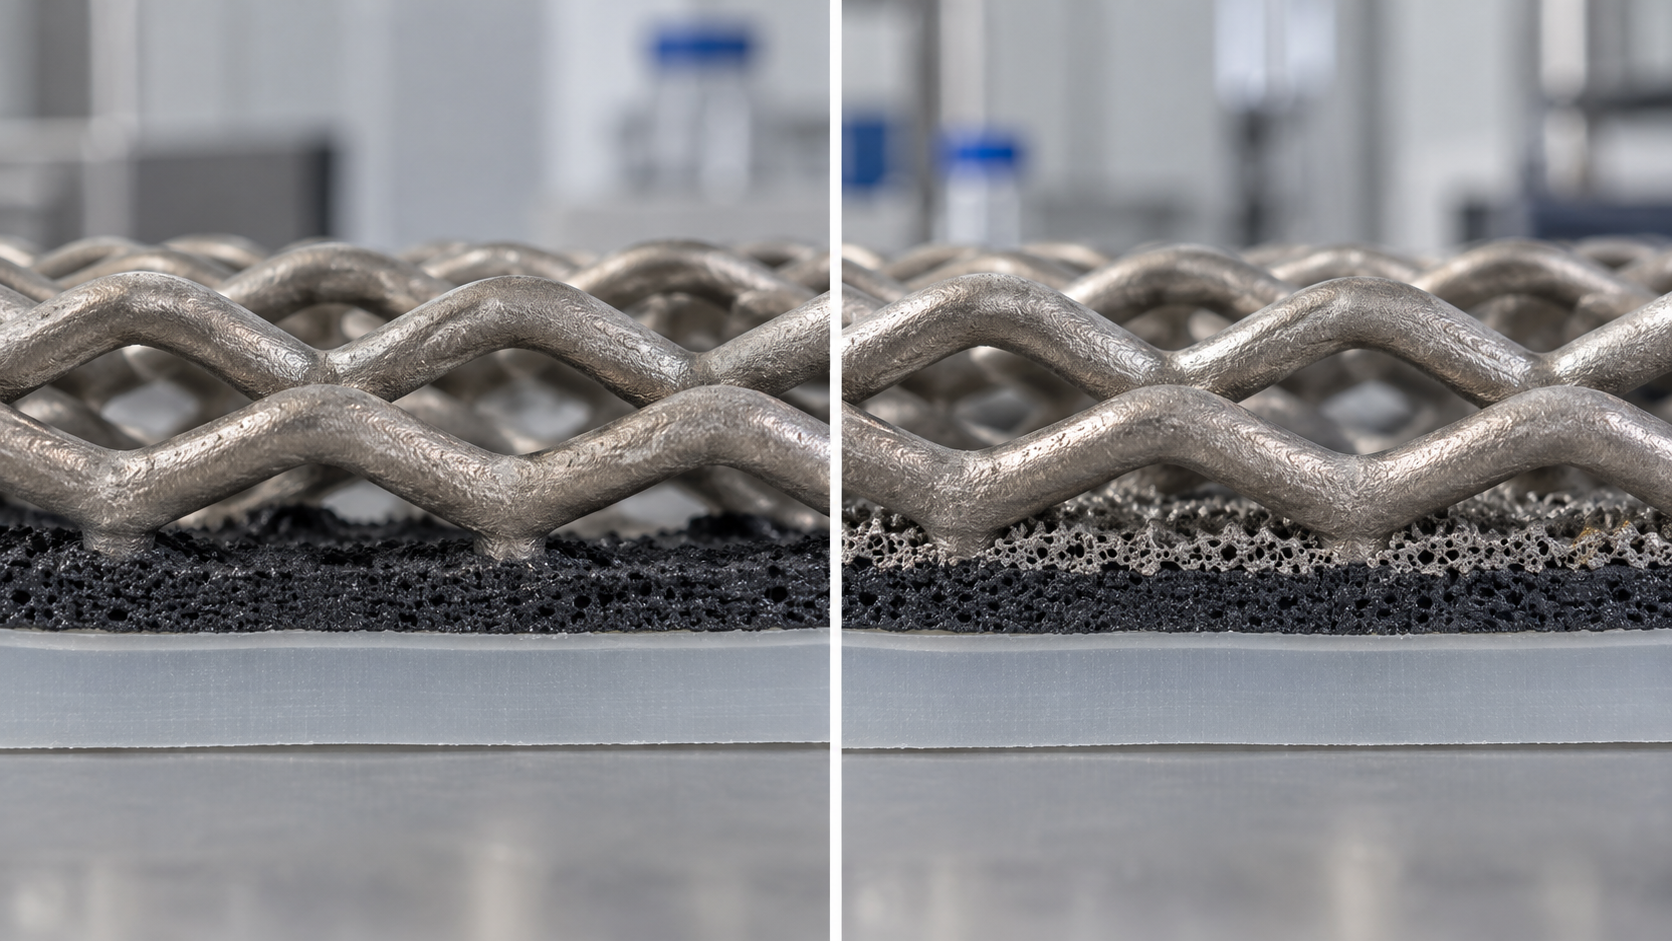
On the anode side, water flows toward the membrane while the oxygen produced flows back out. The PTL handles this counter-flow and also carries electrons to the catalyst layer. Babic et al. state that anode-side materials are limited to titanium-based sintered powders, fibres and meshes, and that with suitable coatings (TiN, Pt, Au) stainless steel may also become viableSourced [Reference 4]. The same review reports the following design rules of thumb from the literature.
| Design variable | Rule of thumb in the review | Conditions and cautions |
|---|---|---|
| Porosity | Said to be optimal at 30–50% | Reported from electrochemical measurements at atmospheric gas pressure and 80 and 90 °C. Higher porosity eases gas and water transport but raises ohmic and thermal resistance |
| Mean pore diameter | Larger than 10 µm but close to it is considered optimal | Larger pores make current distribution in the catalyst layer uneven and add parasitic ohmic loss |
| Mean particle size (spherical powder) | An optimum seems to lie between 50 and 75 µm | Larger particles may raise contact resistance; smaller ones raise mass-transport loss through capillary effects |
| Mean fibre diameter | 20 µm is reported to be preferable to 80 µm | Better electrical contact with the catalyst layer |
| Example measured values | Sintered titanium powder: porosity 46%, mean pore diameter 17 µm | One example derived from X-ray tomography, not a standard value |
From the review by Babic et al. (2017) [Reference 4]. These are rules of thumb summarizing reports in the literature, not specifications of commercial stacks. The optimum changes with operating conditions (temperature, pressure, current density).
View the original SVG schematic with technical details
Stiber et al. report a PTL made by diffusion-bonding a porous sintered layer onto inexpensive titanium mesh. According to the abstract, this PTL allows operation at up to 6 A/cm², 90 °C and a hydrogen output pressure of 90 bar, without needing a flow field in the bipolar plate. With the mesh-only PTL the cell potential reaches about 2.5 V at 2 A/cm² and 90 °C, whereas with the sintered layer the same cell potential is obtained at 6 A/cm²Sourced [Reference 6]. It was finally validated in an industrial-size PEM electrolyzer in a container, at 90 bar hydrogen output pressure [Reference 6]. This is the authors' report and does not rank this PTL against others. We could confirm only the abstract as indexed by Crossref, and did not check operating time or degradation rate figures.
The PTL and the catalyst layer are not bonded; they are simply pressed together. Babic et al. show cross-section images of a used CCM in which the catalyst layer has been deformed by intruding into the PTL structure, and state that excessive cell compression can damage the PTL and CCM. They also cite cracking caused by over-compressionSourced [Reference 4]. Pressing harder to gain more contact is therefore not always better (Commentary).
6. Bipolar plates — what can replace expensive titanium
A bipolar plate electrically connects neighboring cells, separates the gases and water, and carries the flow channels. The JRC glossary defines it as a conductive plate separating individual cells in a stack, acting as current collector and providing mechanical support for the electrodesSourced [Reference 8]. The same report gives titanium or graphite as the PEM bipolar plate material [Reference 8].
On cost, Lettenmeier et al. state that titanium-based components such as bipolar plates make the largest contribution to capital cost, while IRENA says bipolar plates are only a part of stack cost in alkaline units but exceed 50% in PEM unitsSourced [References 3, 5]. Titanium is expensive and complex flow fields are difficult to machine from it, according to Lettenmeier et al. [Reference 5]. Research therefore continues on using stainless steel as the base and protecting its surface.
| Configuration | What the sources confirm | Label and cautions |
|---|---|---|
| Titanium plate (uncoated) | Standard anode-side material, but an oxide film forms and contact resistance rises [4, 5] | The baseline |
| Titanium + platinum / gold coating | The IRENA table gives platinum-coated Ti on the anode side and gold-coated Ti on the cathode side of PEM [3]. Lettenmeier et al. say Pt and Au lower contact resistance but raise material cost substantially [5] | IRENA's summary is as of 2020 |
| Stainless steel + Ti (spray) + Nb (sputter) | Report by Lettenmeier et al. The Ti layer (vacuum plasma spraying) protects the substrate from corrosion and a thin Nb layer lowers contact resistance by almost an order of magnitude. It endured more than 1,000 h under nominal conditions in a high-end commercial PEM stack with no degradation reported [5] | Experimental report. 1,000 h is 2.5% of the DOE 2022 status lifetime of 40,000 h (our calculation). We found no long-term record |
| Stainless steel + thin Nb only | The paper states that its properties are insufficient to protect stainless steel against pitting corrosion [5] | Defects matter as much as thickness (Commentary) |
| Graphite | JRC lists graphite as a PEM bipolar plate material [8]. However, carbon is oxidized at the high anode potential [4] | Usable positions are limited (Commentary) |
Numbers in the table are reference numbers. In the paper by Lettenmeier et al. the Ti layer thickness reads as 50 µm in the abstract and about 130 µm in the description of the cross-section image, and the two do not agree. This article does not adopt a Ti thickness. The Nb layer is given in the main text as about 1 µm on average.
The Lettenmeier configuration splits the work: a thick layer prevents corrosion and a thin layer carries current. The thick sprayed titanium layer protects the substrate with a dense, splat-type microstructure. The roughly 1 µm of Nb on top provides low contact resistance in place of the semiconducting oxide on titanium. From the materials side, this separates the two requirements, corrosion resistance and conduction, instead of loading both onto one material. The usual coating concern still applies: a defect running through the sprayed layer could allow pitting of the stainless steel beneath (Commentary). A 1,000-hour test is short for judging that long-term behavior.
7. Our calculation: how much of the degradation budget does contact resistance use?
We place interfacial contact resistance (ICR) next to the degradation "budget" given by DOE, to see the order of magnitudeOur calculation.
- Assumption 1 (contact resistance): the ICR of the Nb/Ti coating measured by Lettenmeier et al. is below 25 mΩ·cm² at compaction above 120 N/cm² [Reference 5]. We use 25 mΩ·cm² as an upper bound.
- Assumption 2 (current density): the DOE PEM 2022 status condition, 2.0 A/cm² [Reference 1].
- Voltage loss: 0.025 Ω·cm² × 2.0 A/cm² = 0.050 V = 50 mV (per interface)
- DOE definition of lifetime: end of life is a 10% rise in voltage from the beginning of life [Reference 1]. 10% of 1.9 V = 190 mV
- Comparison 1: 50 mV ÷ 190 mV = about 26%. Contact resistance alone corresponds to about a quarter of the end-of-life voltage budget.
- Comparison 2: the DOE status degradation rate is 4.8 mV per 1,000 hours [Reference 1]. 50 mV ÷ 4.8 mV/kh = about 10,400 hours of degradation.
- Comparison 3 (energy): 50 mV ÷ 1.9 V = about 2.6%. If power scales with voltage, that is about 1.3 kWh/kg on the DOE status value of 51 kWh/kg H2.
Assumptions and limits: 25 mΩ·cm² is an upper bound from a room-temperature compaction test, not a value during operation. A cell has several contact interfaces (plate to PTL, PTL to catalyst layer, and so on), so the total can be several times larger. The calculation is meant to grasp the order of magnitude, not to predict the loss of a real stack. According to the DOE page's note, the status values rest on analysis in the H2NEW consortium and were to be published as a DOE Program Record.
8. Seals and gaskets, and the link to adhesives and sealants
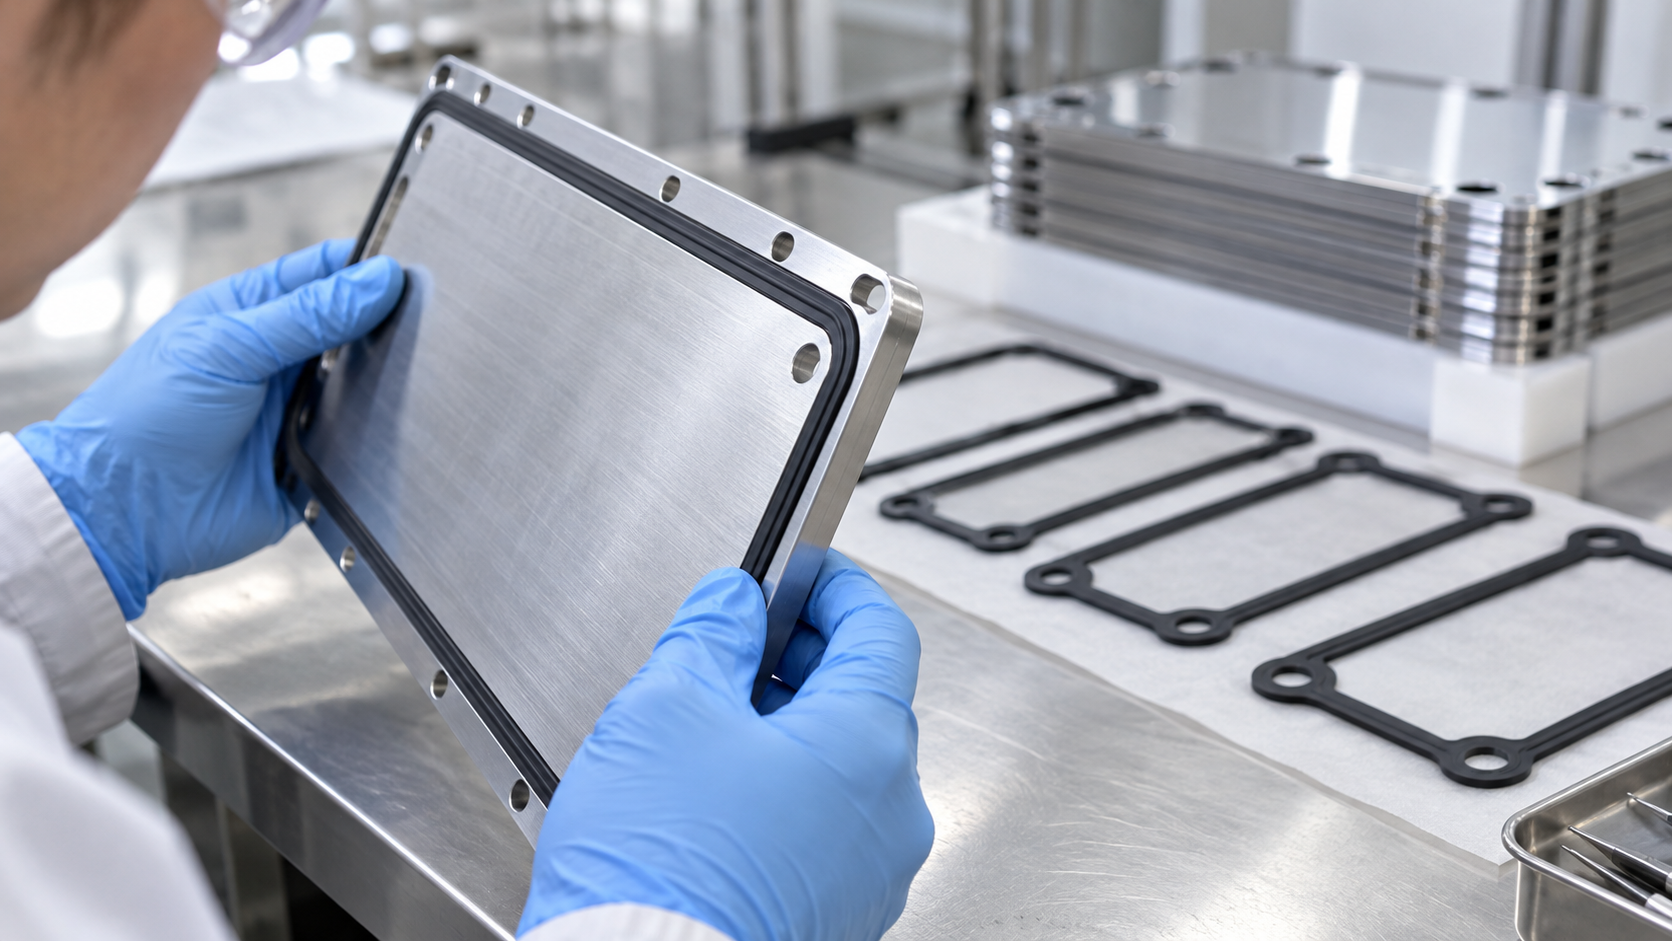
When cells are stacked, the seals must keep water, hydrogen and oxygen from leaking outward or into a neighboring channel. The IRENA table gives frame and sealing materials of PSU, PTFE and EPDM for alkaline, PTFE, PSU and ETFE for PEM, and PTFE and "Silicon" for AEMSourced [Reference 3]. The JRC report states that in PEM cells the electrolyte membrane, ionomer, gaskets and sealants frequently use fluoropolymers, and names a possible future EU ban on PFAS-containing materials as one of the two most demanding challenges for low-temperature electrolyzersSourced [Reference 8]. For the basics of fluoropolymers and PFAS, see our explainer on fluoropolymers and PFAS.
What can be borrowed from fuel cell research, and what cannot
We could not find a peer-reviewed paper that systematically compares seal materials for electrolyzers alone. For fuel cell (PEMFC) gaskets, on the other hand, there is a good deal of work. The 2025 paper by Barzegari et al. (on EPDM gaskets) summarizes earlier studies as followsSourced [Reference 9].
- Lin et al. compared five elastomers (fluorosilicone rubber, liquid silicone rubber (LSR), EPDM, a copolymer resin "CR" and fluororubber (FKM)) in a simulated and an accelerated fuel cell environment. Fluorosilicone and EPDM showed good chemical stability, while liquid silicone rubber and the resin broke down and changed color, with weight loss of up to about 45%. Mechanically, EPDM was judged the most suitable.
- Barzegari et al. themselves tested EPDM with different dicumyl peroxide contents in an accelerated test solution containing 1.8 ppm hydrofluoric acid and 12.5 ppm sulfuric acid, and report a formulation with no change in weight or hardness after 800 hours.
These are tests of fuel cell operating environments (acidic, humidified, about 60–80 °C). The anode side of an electrolyzer is a different environment: high potential, pure oxygen, pressure and liquid water, and the results do not necessarily carry over (Commentary). In particular, the LSR result applies to a specific formulation and test condition and does not mean that silicone cannot be used in electrolyzers.
9. A materials engineer's view (2): a seal stops leaks, but can also be a source of contamination
Babic et al. identify, as a major cause of PEM performance loss, contamination in which metal ions (Cu, Fe, Ca and others) dissolved in the water occupy the membrane's ion-exchange sites. This is reversible, but iron and copper ions promote decomposition of hydrogen peroxide into radicals and so accelerate membrane thinningSourced [Reference 4].
What a materials engineer notices here is that rubber and sealing materials are also candidate sources of contamination. Besides the polymer, rubber contains crosslinkers (peroxides, platinum catalysts and so on), fillers, plasticizers and unreacted low-molecular-weight components. From a materials standpoint, it is a natural concern that these could leach into hot water and reach the membrane and catalyst.
Inference: whether this leaching is large enough to affect real lifetime, we could not find a measurement report in the primary sources we reviewed. On the fuel cell side there is work analyzing the elements released from gaskets by atomic absorption spectroscopy (AAS) [Reference 9], and a similar method should be usable for electrolyzers (Commentary).
The link to adhesives and sealants. Seals come in two kinds: those that are pressed against a plate (flat gaskets, O-rings) and those that are bonded or molded onto a plate or frame as one piece (adhesives, sealants, injection molding, overmolding). For the latter, the issues in our explainer on adhesives (surface treatment, primers, wetting) and in our explainer on silicones (condensation versus addition cure, catalyst poisoning, low-molecular-weight siloxanes) apply directly. Titanium and coated stainless steel are, for bonding, substrates whose surface energy and oxide state are hard to control, and adhesive may bond poorly to precious-metal coated surfaces (Inference). Metal plates, resin frames and rubber also have different coefficients of thermal expansion, so each heating and cooling cycle puts stress on the joint. The same thinking appears in our explainer on thermal expansion coefficients.
Which seal material (silicone, EPDM, FKM, fluoropolymer) is used with which joining method (compression, bonding, integral molding) in a given product is not comprehensively confirmed in manufacturers' public materials, so this article does not name products or companies. It stays within the materials listed as examples in the IRENA table (2020).
10. Clamping — our calculation: the order of magnitude of the clamping load
A PEM stack is assembled by sandwiching the stacked cells between end plates and compressing them with tie rods or similar hardware. Lettenmeier et al. call the compaction condition at which they measured bipolar-plate coating contact resistance (above 120 N/cm²) the common pressure range for assembling a PEM electrolyzer stackSourced [Reference 5]. IRENA says PEM electrode areas are approaching 2,000 cm² [Reference 3]. From these two numbers we can estimate the order of magnitude of the force on a stack.
We estimate the order of magnitude of the clamping loadOur calculation.
- Assumption 1: contact pressure p = 120 N/cm² (the compaction condition in the ICR measurement by Lettenmeier et al. [Reference 5])
- Assumption 2: cell area A = 2,000 cm² (the PEM electrode area level described by IRENA [Reference 3]). Computed on the active area, a simplification that ignores gasket areas.
- Load: F = p × A = 120 N/cm² × 2,000 cm² = 240,000 N = 240 kN
- Conversion: 240,000 N ÷ 9.80665 ≈ 24,500 kgf = about 24.5 tonnes-force
- For comparison: a 100 cm² cell would need 12 kN (about 1.2 tonnes-force)
Point: because the cells are stacked in series, the force on the end plates is (ideally) the same as the force on a single cell, regardless of how many cells are stacked. What grows with the number of cells is the length (rod elongation, overall dimensions) and the accumulated creep and settling of each layer (Commentary). Assumptions and limits: 120 N/cm² is the test condition of one paper, and real contact pressures differ by design. The share of load carried by the gasket and the redistribution of pressure through PTL deformation are not considered.
Clamping a stack is not finished once a load has been applied at assembly. Babic et al. state that creep of the ionomer can be a factor limiting membrane lifetime, and that the Young's modulus of immersed Nafion 117 decreases as temperature risesSourced [Reference 4]. If membrane, rubber and resin frame settle slightly with time and temperature, contact pressure falls even at the same clamping stroke. Lower pressure raises contact resistance and lowers seal pressure (Commentary). This is the same structure as in our explainers on glass transition and creep and on thermal expansion coefficients.
Inference: how real stacks maintain contact pressure (springs, re-tightening and so on) was not systematically described in the public material we could confirm.
11. Stack lifetime and degradation — what happens where
(1) The yardstick DOE sets
DOE gives the following targets for stack lifetime and degradation rate. These are targets, not guarantees of achievement. Of the "status" values, the capital cost is, per DOE's note, the value at current manufacturing volumesSourced [References 1, 2].
| Item | PEM 2022 status | PEM 2026 target | Alkaline 2022 status | Alkaline 2026 target |
|---|---|---|---|---|
| Cell performance | 2.0 A/cm² @ 1.9 V | 3.0 A/cm² @ 1.8 V | 0.5 A/cm² @ 1.9 V | 1.0 A/cm² @ 1.8 V |
| Average degradation rate | 4.8 mV/kh | 2.3 mV/kh | 3.2 mV/kh | 2.3 mV/kh |
| Lifetime (operating hours) | 40,000 h | 80,000 h | 60,000 h | 80,000 h |
| Stack capital cost | US$450/kW | US$100/kW | US$250/kW | US$100/kW |
DOE technical target tables [References 1, 2]. Lifetime ends at a 10% rise from the initial voltage, measured at the same current density. The PEM status values rest on analysis in the H2NEW consortium (DOE note). The alkaline status values are based on "traditional liquid alkaline technology in commercial products available for many years". The degradation rate is for continuous operation; dynamic operation and on-off cycling must be evaluated separately, as the note says.
The table puts alkaline stacks at lower capital cost and longer lifetime. On the other hand, at the same cell voltage of 1.9 V the current obtained is 2.0 A/cm² for PEM against 0.5 A/cm² for alkaline. The electrode area needed for the same current is therefore about 4 times larger for alkaline than for PEM (2.0 ÷ 0.5)Our calculation. This is a ratio of DOE status values and not a comparison of specific products.
(2) A map of degradation
| Location | Phenomenon | Reversibility and notes | Source |
|---|---|---|---|
| Electrolyte membrane | Chemical thinning by radicals, with fluoride release. Stucki et al. observed significant thinning after 15,000 hours of stack operation with varying electric input, ending in a short circuit in one cell | Irreversible. Fluoride release rate is used as an index for lifetime prediction. LaConti et al. found it rises by about two orders of magnitude from 55 to 150 °C | [4] |
| Membrane and ionomer | Cations such as Cu, Fe and Ca occupy ion-exchange sites and lower proton conductivity. Confirmed by analysis after 7,800 hours in a 9-cell stack | Reversible. Treating with 0.5 M sulfuric acid returned the content to the level before operation. Iron and copper accelerate membrane thinning | [4] |
| Anode-side Ti parts | Titanium oxide (TiO2−x) forms and contact resistance rises | Considered the main cause of loss once cation effects are removed. Promoted by higher temperature | [4, 5, 7, 8] |
| Cathode-side Ti parts | Titanium hydride forms on the high-pressure hydrogen side and weakens the titanium | Coatings are cited as a candidate remedy | [4] |
| Catalyst and support | Iridium dissolution and redeposition; carbon-support corrosion and platinum nanoparticle agglomeration | Listed by JRC as examples of currently known mechanisms | [8] |
| Mechanical damage | PTL and CCM damage from over-compression, intrusion of the catalyst layer into the PTL, ionomer creep | Irreversible | [4] |
The source column gives reference numbers. Numbers are reports under each study's conditions (stack configuration, temperature, operating mode) and are not general degradation rates for commercial stacks.
Operating on renewable energy means current moves up and down and starts and stops increase. IRENA (2020) says voltage fluctuation under variable load could trigger corrosion of stack components, but that there is little evidence of this in PEM electrolyzersSourced [Reference 3]. In the experiments of Frensch et al. (about 500 hours), degradation behavior differed by operating mode [Reference 7]. Against this background, the JRC proposed in 2024 harmonised accelerated stress test (AST) protocols [Reference 8]. From a materials viewpoint, what degrades under variable operation depends on the material combination, so it is wise to hold off on a general conclusion (Commentary).
12. How alkaline stacks differ
The individual principles of alkaline electrolysis are left to the explainer on alkaline water electrolysis; here we look only at differences in stack materials. IRENA describes the alkaline electrolyte as a concentrated potassium hydroxide (KOH) solution (5–7 mol/L), the separator as a zirconia-based porous diaphragm, and the electrodes as nickel-coated perforated stainless steelSourced [Reference 3]. JRC cites Zirfon® (a porous composite of zirconia and polysulfone coated on an open polyphenylene sulfide fabric) as a typical diaphragm, and gives alkaline operating conditions of 60–90 °C, 0.2–0.9 A/cm² and atmospheric pressure up to 30 bar [Reference 8].
- Bipolar plates: nickel-coated stainless steel is enough, and precious-metal coatings do not appear in the table. IRENA says bipolar plates are only a part of stack cost in alkaline units [Reference 3]
- Severity of the alkaline environment: in strong alkali nickel passivates and keeps its corrosion resistance. In this respect the design thinking differs from PEM, where metals are hard to choose in acid at high potential (Commentary)
- Electrode area: IRENA gives alkaline electrode areas of up to about 3 m² [Reference 3]. That a larger area is needed for the same current is consistent with the DOE number ratio in the previous chapter (Commentary)
- Seals: contact with hot strong alkali makes chemical resistance of rubber and resin a condition. The IRENA table lists PSU, PTFE and EPDM [Reference 3]
13. Evaluation and standards
Stack performance and degradation cannot be compared unless measured under matched conditions. Three documents are worth knowing.
- ISO 22734:2019 is the standard for hydrogen generators using water electrolysis (industrial, commercial and residential). According to the ISO page, it applies to generators using aqueous bases or acids, acidic solid polymers (PEM) and basic solid polymers (AEM), and excludes reversible fuel cells that can also generate electricitySourced [Reference 10]. The full text is paid, so this article stays with the title and the stated scope.
- EU harmonised test protocols: "EU harmonised protocols for testing of low temperature water electrolysers" by Tsotridis and Pilenga of the JRC (2021). We confirmed the title and year from the reference list of the JRC AST report [Reference 8]. We have not read the document itself.
- A proposal for accelerated stress tests (AST): a 2024 JRC report by Malkow and Pilenga. Its abstract describes it as a proposal of AST protocols for assessing performance degradation of low-temperature water electrolyzer stacks, aiming to let alkaline, AEM and PEM be compared. The test design addresses assembly conditions such as stack compression and stress conditions such as high current density and dynamic operation [Reference 8].
As of 2017, Babic et al. noted that there are no standardized AST protocols for PEM water electrolysis components, which makes results in the literature hard to compare [Reference 4]. The JRC document of 2024 is a proposal and has not been established as a standardNot yet confirmed [Reference 8].
14. Challenges, and what we could not confirm
- High cost of titanium and surface management: Ti-based parts contribute heavily to capital cost, while the long-term reliability of coatings is not yet well demonstrated
- Response to PFAS: JRC says the fluoropolymers in membranes, ionomers, gaskets and sealants could be affected by future regulation, and notes that manufacturing and using substitute materials may pose other challenges [Reference 8]. For the regulatory stages see our explainer on fluoropolymers and PFAS
- Harmonised evaluation: AST standardization is still under way, making studies hard to compare
(1) Internal structure and material details of commercial stacks are not covered
Public information on coating types, thicknesses, PTL specifications and clamping methods of commercial stacks is limited, and this article does not name products or companies. It stays within the IRENA table (2020), peer-reviewed papers and JRC documents.
(2) We found no degradation data on seal materials in electrolyzers
As stated in chapter 8, we could consult studies of fuel cell gaskets (cited via the summary by Barzegari et al.), but we found no systematic comparison for electrolyzers (especially the high-potential, pure-oxygen, pressurized anode side) within the scope of our survey.
(3) We could not confirm actual lifetime records
The DOE figures are targets or status values, and we could not confirm manufacturers' warranty values or operating records in primary sources. The operating times in the papers range from 500 to 15,000 hours, each under specific test conditions.
(4) Catalysts, membranes, and handling of hydrogen
Catalyst loading and resource issues, membrane details (PFSA, hydrocarbon, anion exchange) and the principle of each type are covered in other articles in this series. Individual advice on handling or safety for hydrogen and oxygen is outside the scope of this article.
- Stack materials are decided by the anode-side environment. In acid, at high potential and with oxygen, carbon is oxidized and stainless steel corrodes easily, so titanium-based materials are standardSourced
- Titanium is usable but not unscathed. The surface oxide film raises contact resistance, and once cation contamination is removed it is said to be the main cause of lossSourced
- Bipolar plates are a large share of PEM stack cost. Coating stainless steel with titanium and niobium has been reported, but the demonstration is of the 1,000-hour classSourced
- A contact resistance of 25 mΩ·cm² (upper bound) is 50 mV at 2.0 A/cm², about 26% of the DOE end-of-life budget of 190 mVOur calculation
- The clamping load for a 2,000 cm² cell is on the order of 240 kN (about 24.5 tonnes-force)Our calculation
- A seal stops leaks, but it can also be a source of contamination. This is a materials-based concern, and we found no measurement report for electrolyzers (Inference)
15. Glossary
- Stack
- Dozens of identical cells stacked in series and clamped between end plates.
- MEA / CCM
- Membrane electrode assembly / catalyst-coated membrane: an electrolyte membrane with catalyst layers on both faces.
- PTL
- Porous transport layer. A porous layer that passes water and gas and carries electrons. Also called the gas diffusion layer.
- Bipolar plate (BPP)
- A conductive plate that connects neighboring cells electrically and separates gas and water.
- PFSA
- Perfluorosulfonic acid. The fluorinated polymer used for PEM electrolyte membranes.
- ICR
- Interfacial contact resistance. Electrical resistance at the surface where parts touch.
- Passivation
- A thin oxide film forms on a metal surface and slows reaction. It can also hinder conduction.
- PVD / VPS
- Physical vapor deposition / vacuum plasma spraying. Ways of making a coating.
- Gasket
- A part that stops leaks between plates. Materials include EPDM, fluororubber and PTFE.
- EPDM
- Ethylene propylene diene rubber. Usually crosslinked with peroxides or similar agents.
- AST
- Accelerated stress test. A test that draws out degradation in a short time under harsher conditions than normal.
- mV/kh
- Voltage rise (millivolts) per 1,000 hours. The unit of degradation rate.
- H2NEW
- A DOE-supported research consortium on electrolyzers.
- BoP
- Balance of plant: the equipment outside the stack (power supply, water treatment, drying, cooling and so on).
16. References
- U.S. Department of Energy (DOE) "Technical Targets for Proton Exchange Membrane Electrolysis" (accessed 5 October 2026; no publication date shown) — energy.gov
- U.S. Department of Energy (DOE) "Technical Targets for Liquid Alkaline Electrolysis" (accessed 5 October 2026; no publication date shown) — energy.gov
- IRENA "Green Hydrogen Cost Reduction: Scaling up Electrolysers to Meet the 1.5°C Climate Goal" (December 2020, PDF report) — irena.org
- Babic, Suermann, Büchi, Gubler, Schmidt "Critical Review—Identifying Critical Gaps for Polymer Electrolyte Water Electrolysis Development", Journal of The Electrochemical Society 164(4), F387–F399 (2017), DOI 10.1149/2.1441704jes — doi.org/10.1149/2.1441704jes
- Lettenmeier et al. "Low-Cost and Durable Bipolar Plates for Proton Exchange Membrane Electrolyzers", Scientific Reports 7, 44035 (2017) — nature.com
- Stiber et al. "Porous Transport Layers for Proton Exchange Membrane Electrolysis Under Extreme Conditions of Current Density, Temperature, and Pressure", Advanced Energy Materials 11, 2100630 (2021) (abstract checked via Crossref) — doi.org/10.1002/aenm.202100630
- Frensch, Fouda-Onana, Serre et al. "Influence of the operation mode on PEM water electrolysis degradation", International Journal of Hydrogen Energy 44, 29889–29898 (2019) (abstract checked) — doi.org/10.1016/j.ijhydene.2019.09.169
- European Commission Joint Research Centre (JRC) Malkow, T., Pilenga, A. "EU harmonised accelerated stress testing protocols for low-temperature water electrolyser: A proposal for assessing performance degradation in water electrolyser stacks", EUR 31748 EN, 2024, DOI 10.2760/988717 — clean-hydrogen.europa.eu
- Barzegari et al. "Evaluation of EPDM Elastomeric Seals for Application in Polymer Electrolyte Membrane Fuel Cells", Hydrogen, Fuel Cell & Energy Storage 4, 253–264 (2025) — hfe.irost.ir
- ISO "ISO 22734:2019 Hydrogen generators using water electrolysis — Industrial, commercial, and residential applications" (title and scope only; the full text is paid) — iso.org
17. Claim-to-source audit
| Claim in the text | Basis | Label |
|---|---|---|
| DOE PEM target table: stack capital cost US$450/kW (2022 status) and US$100/kW (2026 target); cell performance 2.0 A/cm² @ 1.9 V (status), degradation rate 4.8 mV/kh, lifetime 40,000 hours, end of life at a 10% rise from initial voltage; energy 51 kWh/kg H2 (status). Status values rest on H2NEW analysis (note says to be published as a Program Record). The note that variable operation and on-off cycling need separate evaluation | DOE technical target table (PEM)[Reference 1] https://www.energy.gov/eere/fuelcells/technical-targets-proton-exchange-membrane-electrolysis | Sourced |
| DOE alkaline target table: 0.5 A/cm² @ 1.9 V, degradation rate 3.2 mV/kh, lifetime 60,000 hours, stack capital cost US$250/kW (2022 status). 2026 targets of 1.0 A/cm² @ 1.8 V, 2.3 mV/kh, 80,000 hours and US$100/kW. Status values are based on traditional technology in commercial products available for many years | DOE technical target table (alkaline)[Reference 2] https://www.energy.gov/eere/fuelcells/technical-targets-liquid-alkaline-electrolysis | Sourced |
| Component materials in IRENA Table 1 (PTL, bipolar plate, frame and seal, electrolyte, separator); for alkaline KOH 5–7 mol/L, a zirconia-based diaphragm and electrode areas up to 3 m²; that PEM electrode areas are approaching 2,000 cm²; that bipolar plates exceed 50% of PEM stack cost (only a part for alkaline); the statement that evidence of corrosion from variable load is scarce in PEM electrolyzers; the description of balance of plant | IRENA (2020)[Reference 3] https://www.irena.org/Publications/2020/Dec/Green-hydrogen-cost-reduction | Sourced |
| PEM electrolyte thickness about 0.2 mm and 1–3 A/cm². That above 1.4 V at the anode carbon is oxidized, that IrO2 is chosen and RuO2 dissolves too fast. That anode PTLs are titanium sintered powder, fibre or mesh, and stainless steel is a candidate with TiN, Pt or Au coatings. PTL rules of thumb (porosity 30–50%, pore size above 10 µm, particle size 50–75 µm, fibre diameter 20 µm) and a sintered titanium example (porosity 46%, pore diameter 17 µm). Damage to PTL and CCM from over-compression. Metal cation contamination (Cu, Fe, Ca; 7,800 hours; reversible), acceleration of membrane thinning by iron and copper, the 15,000-hour thinning and short circuit of Stucki et al., the fluoride release rate, more pronounced thinning on the cathode side, the radical formation mechanism. Corrosion of stainless steel, the titanium oxide layer, titanium hydride, coating candidates (Ti, TiN, Pt, Au). That no standardized AST protocols exist. Ionomer creep, and the fall of the Young's modulus of Nafion 117 with temperature | Babic et al. (2017)[Reference 4] https://doi.org/10.1149/2.1441704jes | Sourced |
| That Ti-based components such as bipolar plates make the largest contribution to capital cost; that titanium is costly and hard to machine into complex flow fields; that natural passivation forms TiO2−x and gold or platinum coatings are needed; the Nb/Ti-coated stainless steel configuration (Ti by vacuum plasma spraying, Nb by sputtering); ICR below 25 mΩ·cm² above 120 N/cm² (stated to be the common pressure range for assembling a PEM stack); more than 1,000 hours under nominal conditions without degradation; that thin Nb alone is insufficient against pitting of stainless steel; the mismatch in Ti layer thickness (50 µm in the abstract, about 130 µm in the SEM description) | Lettenmeier et al. (2017)[Reference 5] https://www.nature.com/articles/srep44035 | Sourced |
| That a PTL made by diffusion-bonding a sintered porous layer onto titanium mesh allows up to 6 A/cm², 90 °C and 90 bar hydrogen output pressure; that mesh alone gives about 2.5 V at 90 °C and 2 A/cm² while the sintered layer gives the same potential at 6 A/cm²; that no flow field is needed in the bipolar plate; and that it was validated in an industrial-size unit (in a container) at 90 bar | Abstract of Stiber et al. (2021)[Reference 6] https://doi.org/10.1002/aenm.202100630 | Sourced |
| Comparison of seven operating modes over about 500 hours. That faster current cycling lowers ohmic resistance but increases fluoride emission; that in other modes ohmic resistance rises and passivation of titanium parts is suspected; that higher temperature improves performance but promotes membrane thinning and passivation | Abstract of Frensch et al. (2019)[Reference 7] https://doi.org/10.1016/j.ijhydene.2019.09.169 | Sourced |
| Definition of a bipolar plate (conductive plate, current collector, mechanical support). That PEM bipolar plates are titanium or graphite. That in PEM cells the electrolyte membrane, ionomer, gaskets and sealants frequently use fluoropolymers, and that a PFAS restriction is one of the two most demanding challenges. The description of Zirfon, and alkaline operating conditions (60–90 °C, 0.2–0.9 A/cm², up to 30 bar). Examples of degradation mechanisms (iridium dissolution and redeposition, carbon-support corrosion with platinum agglomeration, membrane thinning, blocking of ion-exchange sites by cations, passivation of Ti-based PTLs and bipolar plates). The outline of the AST report and that it is a proposal. The title and year of Tsotridis and Pilenga (2021) from the reference list. The note that substitute materials may pose other challenges | JRC AST proposal report (2024)[Reference 8] https://www.clean-hydrogen.europa.eu/system/files/2024-02/ast.pdf | Sourced |
| Summary of earlier fuel cell gasket studies (comparison of five elastomers; breakdown of liquid silicone rubber and others with weight loss of up to about 45%; stability of EPDM). The accelerated test of EPDM with varying peroxide content (1.8 ppm hydrofluoric acid, 12.5 ppm sulfuric acid; no change in weight or hardness after 800 hours). Analysis by FTIR and atomic absorption | Barzegari et al. (2025)[Reference 9] https://hfe.irost.ir/article_1534.html | Sourced |
| Title and scope of ISO 22734:2019 (applies to water electrolysis hydrogen generators using aqueous bases or acids, PEM and AEM; reversible fuel cells excluded) | ISO standard page (confirmed through search results; the site refuses automated retrieval, so the full text was not checked)[Reference 10] https://www.iso.org/standard/69212.html | Sourced |
| Contact resistance 25 mΩ·cm² × 2.0 A/cm² = 50 mV. 10% of 1.9 V = 190 mV, 50 ÷ 190 = about 26%, 50 mV ÷ 4.8 mV/kh = about 10,400 hours. 50 mV ÷ 1.9 V = about 2.6%, 51 kWh/kg × 2.6% = about 1.3 kWh/kg (assuming power scales with voltage). 1,000 hours ÷ 40,000 hours = 2.5% | Our calculation. 25 mΩ·cm² is an upper bound from a room-temperature compaction test; 2.0 A/cm², 4.8 mV/kh, 40,000 hours and the 10% are DOE values. A real cell has several contact interfaces, so the total can be larger. Not a prediction of real losses | Our calculation |
| Clamping load 120 N/cm² × 2,000 cm² = 240 kN ≈ 24.5 tonnes-force, and 12 kN at 100 cm². Required electrode-area ratio of alkaline to PEM, 2.0 ÷ 0.5 = 4 | Our calculation. Pressure is from the compaction condition of Lettenmeier et al., area from the IRENA level, and current densities from DOE status values. A simplification on active area that ignores load distribution in a real stack. Not a comparison of specific products | Our calculation |
| That the JRC AST is a 2024 proposal and not an established standard | A proposal, with standardization not complete. An outlook based on the status of the JRC document | Not yet confirmed |
| Systematic comparison of seal materials for electrolyzers, degradation data in electrolyzers, the effect of leaching from seals on lifetime, coatings, PTLs and clamping methods of commercial stacks, and manufacturers' lifetime records | Could not be confirmed in primary sources within the scope of our survey, so not stated. Whether leaching from seals governs lifetime is an inference, and we found no measurement report | Commentary |
| The reading that titanium's strength and weakness come from the same oxide film. The reading of the two-layer coating as a division of labor between corrosion and conduction. The materials-based concern that seals can be a source of contamination. The links to the adhesives and sealants field (adhesives, silicones). The framing of contact-pressure maintenance (creep and settling). The difference in design thinking between alkaline and PEM. The framing that the effect of variable operation is unsettled | Our organization and commentary based on published content. Not views stated by any company or institution | Commentary |
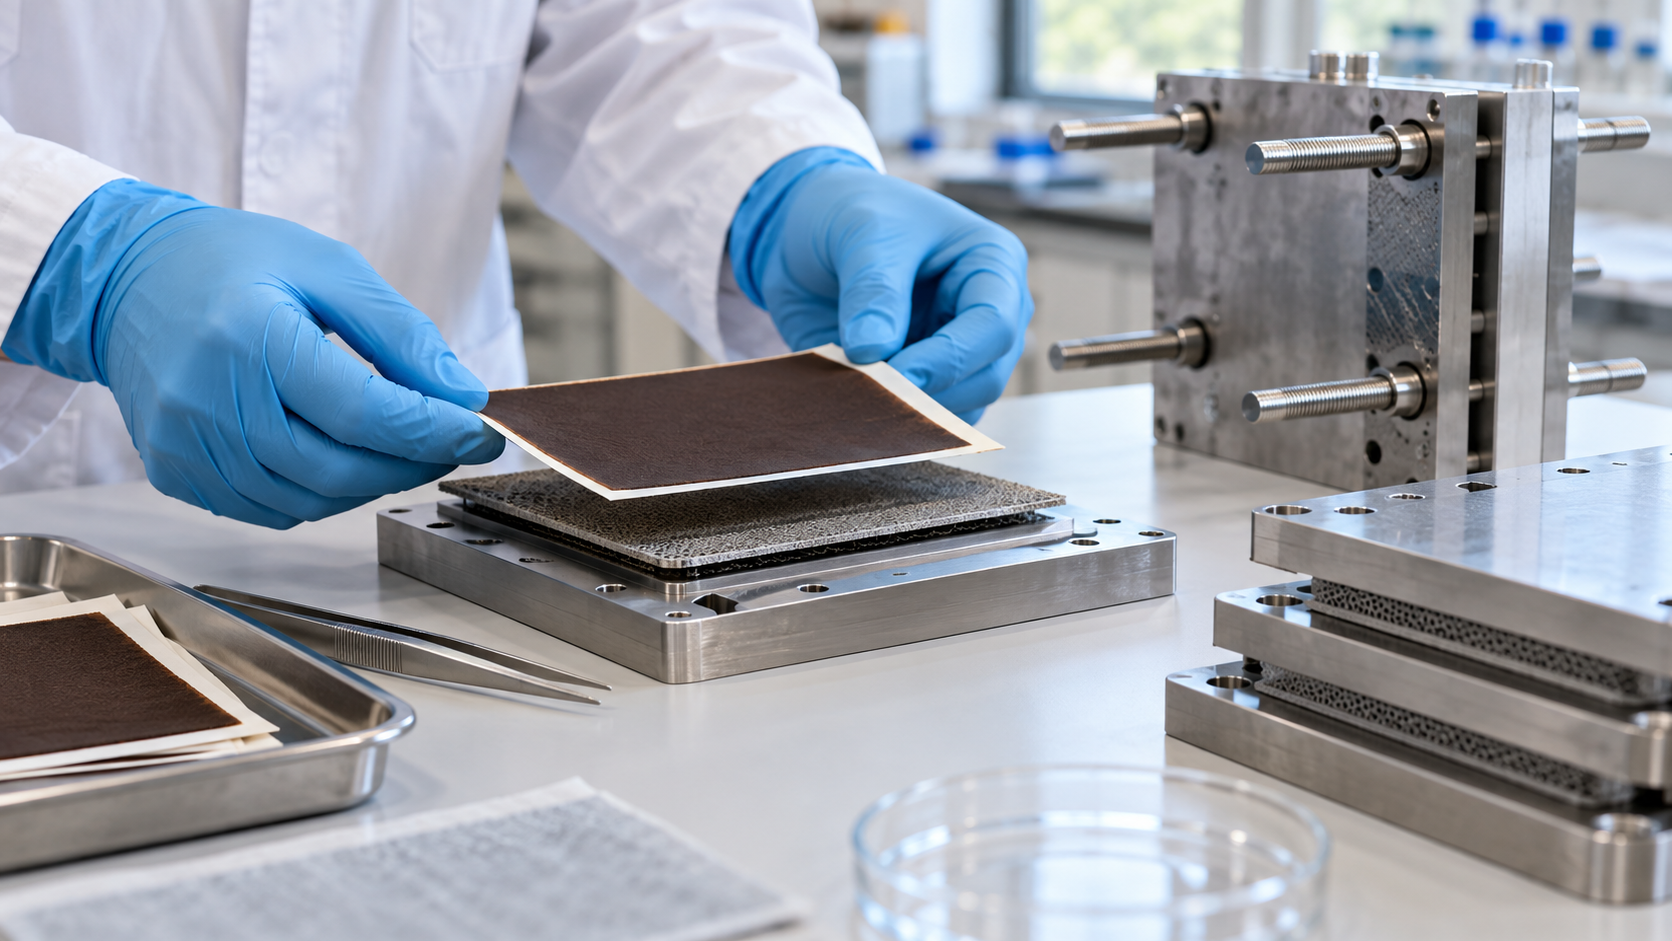
| That Figs. 1, 2, 3, 4, 6 and 7 are explanatory drawings rather than real cross-sections or design drawings, and that the hero image and Fig. 5 are AI-generated images | Our note | Commentary |
Last updated: 6 October 2026. Sources are limited to primary material (official documents of government agencies and international organizations, peer-reviewed papers, and the official page of a standards body). Because the article includes structural readings and materials-design interpretations, those are marked as Commentary and kept separate from sourced fact. Degradation data on seal materials in electrolyzers, the internal specifications of commercial stacks, and manufacturers' lifetime records could not be confirmed in primary sources and are therefore not stated. DOE figures are targets or status values and are not guarantees of achievement. Nothing here is advice on handling or operating hydrogen or oxygen. All figures are explanatory concept graphics. Figs. 1, 2, 3, 4, 6 and 7 are vector drawings; the hero image and Fig. 5 are AI-generated images, and none of them shows a real cross-section, micrograph or physical product.