TECHNOLOGY EXPLAINER
Hard-Carbon Anodes
— not a substance, but “a microstructure set by precursor and firing conditions”
The hard carbon widely used as the anode of sodium-ion batteries is not a crystal with a fixed structure like graphite. It is a hard carbon in which small carbon layers are frozen in random orientations, leaving closed pores in the gaps between them. Even under the same name “hard carbon,” what it is made from and the temperature it is fired at give materials with entirely different capacity and first-cycle efficiency.
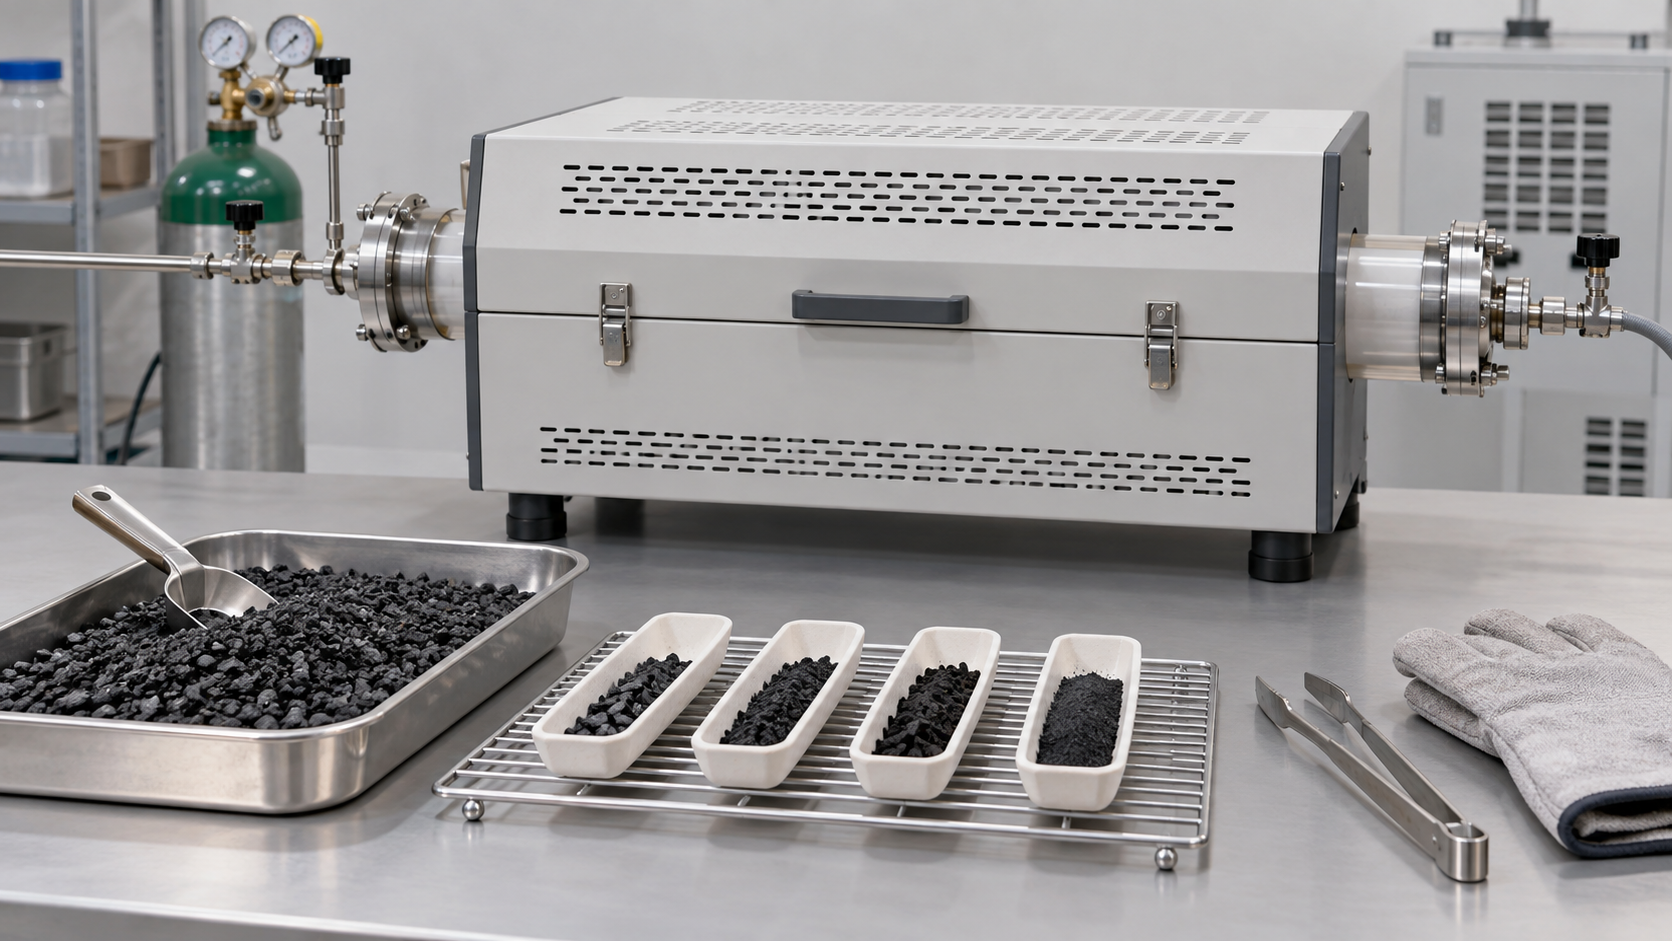
- What a hard-carbon anode is (the short version)
- Structure — turbostratic domains and closed pores
- How sodium is stored — adsorption, intercalation and pore filling
- A materials engineer's view (1): an unsettled mechanism means unsettled design rules
- Our calculation: the upper limit of plateau capacity from pore volume, and how XRD sees d-spacing
- Precursors — biomass, resin and pitch
- Manufacturing and carbonization temperature
- A materials engineer's view (2): the difficulty of keeping “the same hard carbon” from lot to lot
- The trade-off between first-cycle efficiency and capacity
- Cost
- Characterization — XRD, SAXS and BET
- What is still hard
- How to read evaluations and standards
- Glossary
- References
- Claim-to-source audit
Sourced = stated in published material (link given)
Our calculation = a figure this article derived, with the assumptions spelled out
Not yet confirmed = a plan or target with no confirmed track record
Structural readings and materials-design interpretations are marked separately as Commentary. Values from company materials are the company's stated values.
Most of the capacities and first-cycle efficiencies quoted here are laboratory half-cell values (for example coin cells against sodium metal) measured at low current density. Do not read them as the performance of production products or full cells.
1. What a hard-carbon anode is (the short version)
Hard carbon is a carbon that does not turn into graphite even when fired at high temperature (a non-graphitizing carbon). The roadmap explains that it is made from oxygen-rich precursors and cannot be converted into graphite no matter how high the carbonization temperatureSourced [1]. It is the most widely used anode for sodium-ion batteries.
- What the structure is: small carbon layers with a larger spacing than graphite (above 0.34 nm), in random orientations and joined by disordered carbon regions. In the gaps are “closed” pores that gas sorption cannot probeSourced [1].
- How much it stores: a 2000 paper by Stevens and Dahn reported a reversible sodium capacity of 300 mAh/g in hard carbonSourced [4]. Current reported values, according to the roadmap, are 200 to 450 mAh/g in coin-cell half cells, with most literature values averaging about 300 mAh/gSourced [1].
- What is hard: several theories of where and how sodium is stored remain in play, so structure and performance cannot be tied together in a single equationSourced [1, 2].
Hard carbon is not the name of a substance; it is a family of microstructures set by precursor and firing conditions. A 2025 review states that the amorphous, intricate microstructure of hard carbon limits reproducibility and makes it hard to tie structure to performanceSourced [2]. For a materials supplier, being able to show what a material was made from, at what temperature and how, before saying how many Wh/kg it gives, is the way into the conversation (commentary by this article).
2. Structure — turbostratic domains and closed pores
(1) Graphite, soft carbon and hard carbon
When carbons are heat-treated, some turn readily into graphite (graphitizing, or soft carbon) and some do not (non-graphitizing, or hard carbon). Franklin's 1951 study of carbons of different origin treated at 1,000 to 3,000 °C showed that the two form two distinct and well-defined classes, with differences apparent from the earliest stages of carbonization. In non-graphitizing carbons, a strong system of cross-linking forms at low temperature to unite the crystallites, which leads to a random orientation of the crystallites in a rigid, finely porous mass. In graphitizing carbons the cross-linking is much weaker, neighboring crystallites tend to lie nearly parallel, and the structure is more compactSourced [3].
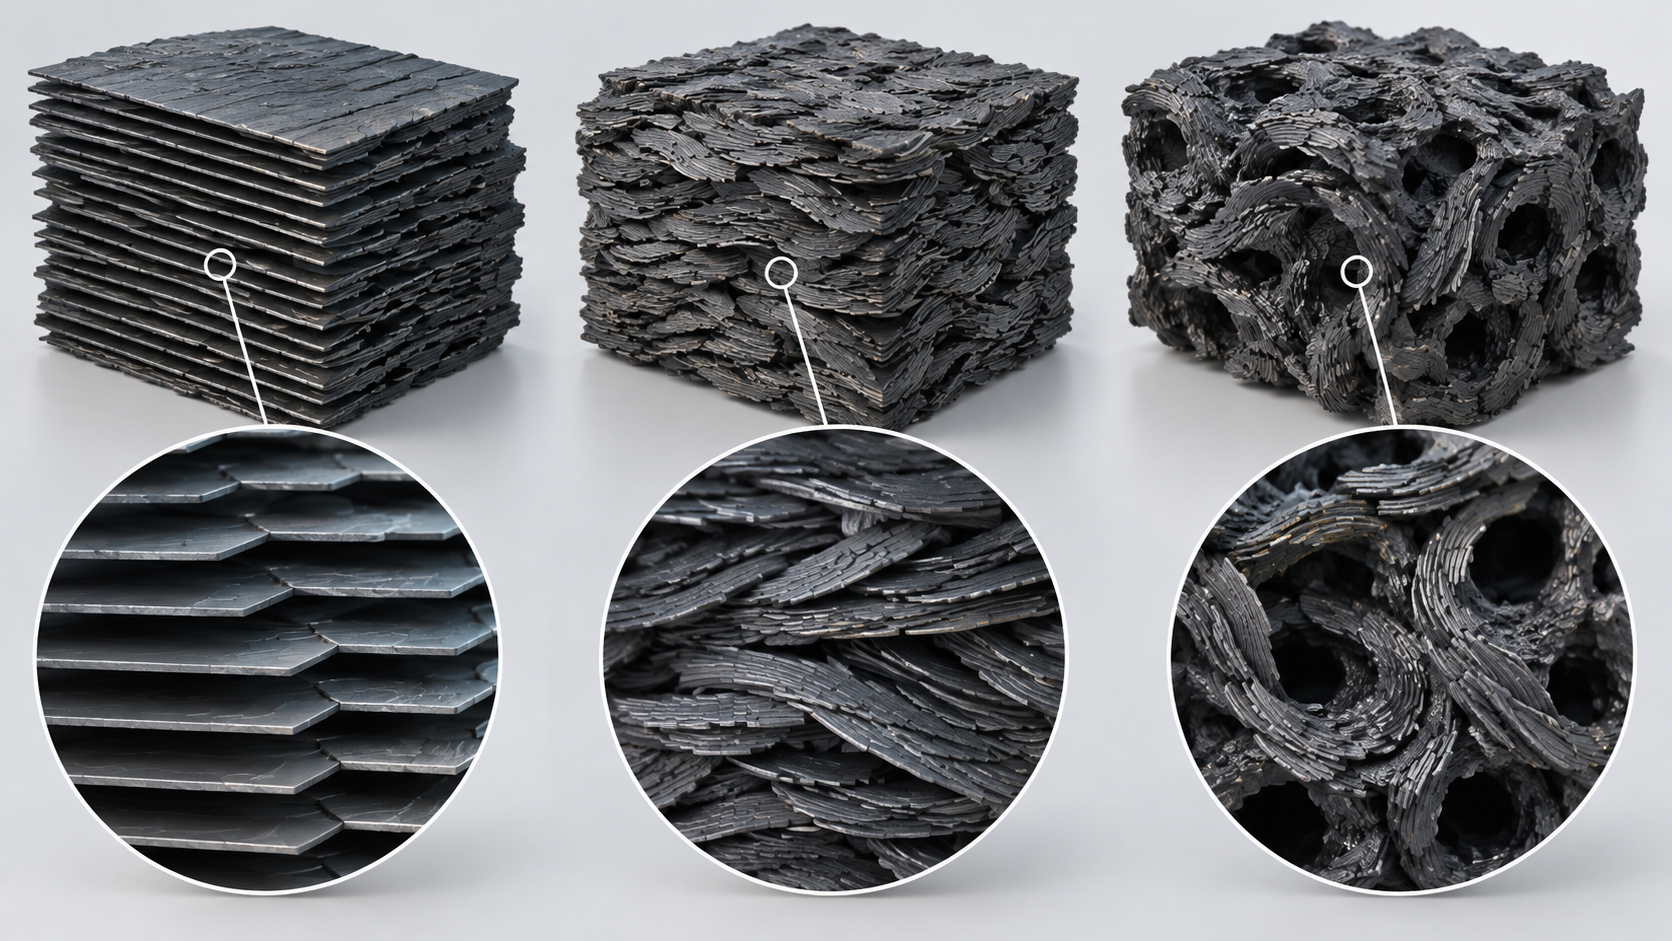
View the original SVG schematic and exact annotations
(2) Turbostratic domains and closed pores
The roadmap describes hard carbon as “randomly oriented graphitic domains with an interlayer spacing larger than graphite (above 0.34 nm), connected by disordered carbon regions.” Between those domains there are “closed” pores that cannot be probed by gas sorption. The larger the graphitic crystallites, the larger the pores between them. In addition there are residual heteroatoms (mainly oxygen-containing groups), curved layers and edge sitesSourced [1]. Bommier and co-authors call the regions where intercalation occurs “turbostratic nanodomains”Sourced [5].
At the same time, the exact structure is still unknown. The roadmap says that it depends on precursor and carbonization conditions, which give different interlayer spacing, crystallite size, pore domains and edge terminationSourced [1].
3. How sodium is stored — adsorption, intercalation and pore filling
As sodium is inserted into hard carbon, the potential changes in two regions. According to the roadmap these are a “sloping region” between 1 V and 0.1 V and a “plateau region” below 0.1 V (versus sodium metal)Sourced [1].
Where and how does sodium enter in the two regions? The roadmap and the review summarize the following theories.
| Theory (when proposed) | Sloping region | Plateau region |
|---|---|---|
| Intercalation-filling (“house of cards”) model Stevens and Dahn (2000) | Na intercalating into expanded graphitic domains | Na filling pores |
| Adsorption-intercalation model | Adsorption at surfaces and defect sites | Intercalation between graphitic layers |
| Adsorption-filling model | Adsorption at defect sites | Filling of nanopores |
| Three-stage model (adsorption-intercalation-filling) proposed by Bommier et al. (2015) | Adsorption at defect sites (a correlation with defects was observed) | First intercalation between layers, finally filling of nanopores |
| The picture the roadmap gives as “more recent evidence” | Adsorption and intercalation occurring simultaneously | Pore filling |
All are Sourced (the roadmap's summary [1], Stevens and Dahn [4], Bommier et al. [5], the review [2]). Which is right is said to differ by material.
Recent work emphasizes “filling” of closed pores. The 2025 review expresses the view that high-density quasi-metallic sodium clusters accommodated in closed pores contribute most to plateau capacitySourced [2]. The roadmap also mentions reports that examined the metallic nature of sodium in pores by solid-state NMR and similar methodsSourced [1]. The review itself, however, states that there is still no rigorous scientific standard for distinguishing open from closed poresSourced [2].
4. A materials engineer's view (1): an unsettled mechanism means unsettled design rules
Graphite has a clear structure for lithium (LiC6), and its theoretical capacity of 372 mAh/g follows from the formula. Hard carbon has no equivalent formula. The roadmap says that while the theoretical value for lithium in graphite can be calculated from LiC6, for sodium in hard carbon the situation is “far more complicated” because the storage mechanism is unknown and depends on many structural parametersSourced [1].
This has three implications for a materials engineer (commentary by this article).
- No single index selects the material. There was a time when pseudo-graphitic domains with an interlayer spacing d002 of 0.36 to 0.40 nm were thought to be the main source of plateau capacity, but the review records that controlling d002 and defects did not significantly increase the active sites in the plateau regionSourced [2]. Widening d002 alone is not the goal.
- The measurements themselves differ. BET surface area sees only open pores, SAXS is sensitive to both open and closed pores, and XRD sees interlayer spacing (Chapter 11). No single measurement can define a “good hard carbon.”
- Evaluation should be done within a series made from the same raw material. The review says that comparative studies with consistent precursors are important for linking structure to performanceSourced [2].
5. Our calculation: the upper limit of plateau capacity from pore volume, and how XRD sees d-spacing
(1) How much can the pores be filled with sodium?
Assuming that “quasi-metallic sodium” enters closed pores, we estimate an upper limit on plateau capacity from the pore volumeOur calculation.
Assumptions: sodium in the pores packs at the density of sodium metal (0.968 g/cm³, a standard property value); atomic mass of sodium 22.990; Faraday constant 96,485 C/mol (26,801 mAh/mol). Then 1 cm³ of sodium metal corresponds to 0.968 ÷ 22.990 × 26,801 = about 1,128 mAh/cm³.
In reality sodium in pores may pack at a lower density than the metal, and not all pores need be filled. The review states that a clear link between closed-pore volume and plateau capacity is difficult to establishSourced [2]. The values below are therefore a guide to an upper limit, not predictions.
Closed-pore volume is estimated from helium pycnometry with the true density of graphite, 2.26 g/cm³, as the reference, using V(closed) = 1/(particle density) − 1/2.26Sourced [2]. For a particle density of 1.5 g/cm³ this gives 0.224 cm³/g, and for 1.7 g/cm³ it gives 0.146 cm³/gOur calculation (the densities are examples). The review notes, however, that this method depends on the choice of reference structure and that computed values differ widely between studiesSourced [2].
(2) How XRD sees the interlayer spacing
The interlayer spacing d002 is obtained from the position of the (002) XRD peak using Bragg's law (2d sinθ = λ). For Cu Kα1 radiation (λ = 0.15406 nm, a standard value) the conversions are as followsOur calculation.
| d002 (nm) | 2θ (degrees, Cu Kα1) | Note |
|---|---|---|
| 0.3354 | 26.55 | Graphite (standard value) |
| 0.36 | 24.71 | Lower end of the range cited by the review (0.36 to 0.40 nm) [2] |
| 0.38 | 23.39 | The value Kuraray lists for KURANODE™ (manufacturer's stated value) [6] |
| 0.40 | 22.21 | Upper end of the range cited by the review [2] |
Calculated values are Our calculation. The manufacturer's value and the review's range in the Note column are Sourced. Because the (002) peak of hard carbon is broad, reading d002 involves an uncertainty from how the peak position is fitted (commentary by this article).
6. Precursors — biomass, resin and pitch
The properties of hard carbon split largely according to how readily the precursor cross-links. The review says that thermosetting precursors (plant biomass and resins) are oxygen-rich and have a developed cross-linked network from the outset, so graphitization on firing can be controlled and closed-pore-rich structures are easier to makeSourced [2]. If cross-linking is insufficient, free radicals are released violently during pyrolysis, causing excessive pore formation or melting of the carbon so that it loses its original formSourced [2].
| Class | Examples | Reported characteristics | Challenges |
|---|---|---|---|
| Biomass (plant-derived) | Wood, bamboo, starch, lignin, cellulose and so on. Kuraray's KURANODE™ is described as made from a natural plant [6] | Abundant and renewable, low environmental burden, with an inherently porous structure. One summary holds that crystalline cellulose can turn into long-range graphitic domains (the walls of closed pores) while amorphous components such as hemicellulose and lignin act to suppress over-graphitization [2] | Initial screening is difficult. An impurity-removal step before carbonization is needed and may not be environmentally friendly [2]. Acid or base treatment can raise or lower capacity [2] |
| Resin (thermosetting) | Phenolic resin and others | Consistent raw-material properties and simple synthesis make it suited to molecular design [2] | Expensive and hard to industrialize [2] |
| Pitch (thermoplastic) | Petroleum pitch, coal-tar pitch | Few oxygen-containing functional groups; it liquefies on heating and tends to lose its shape. Oxidation (pre-oxidation) can suppress the liquefaction [2] | The degree of oxidation must be controlled. Too much oxidation invites unwanted side reactions [2] |
All are Sourced (the 2025 review's summary [2]). They are general statements and do not describe any particular manufacturer's raw materials or process.
As an example of pre-oxidation, the review cites a study with waste foam as precursor in which the sample oxidized at 250 °C performed well, whereas the one oxidized at 280 °C showed a wider interlayer spacing but lower first-cycle efficiency and reversible capacity because of formation of an undesirable SEISourced [2]. A difference of a few tens of degrees in oxidation conditions decides performance.
7. Manufacturing and carbonization temperature
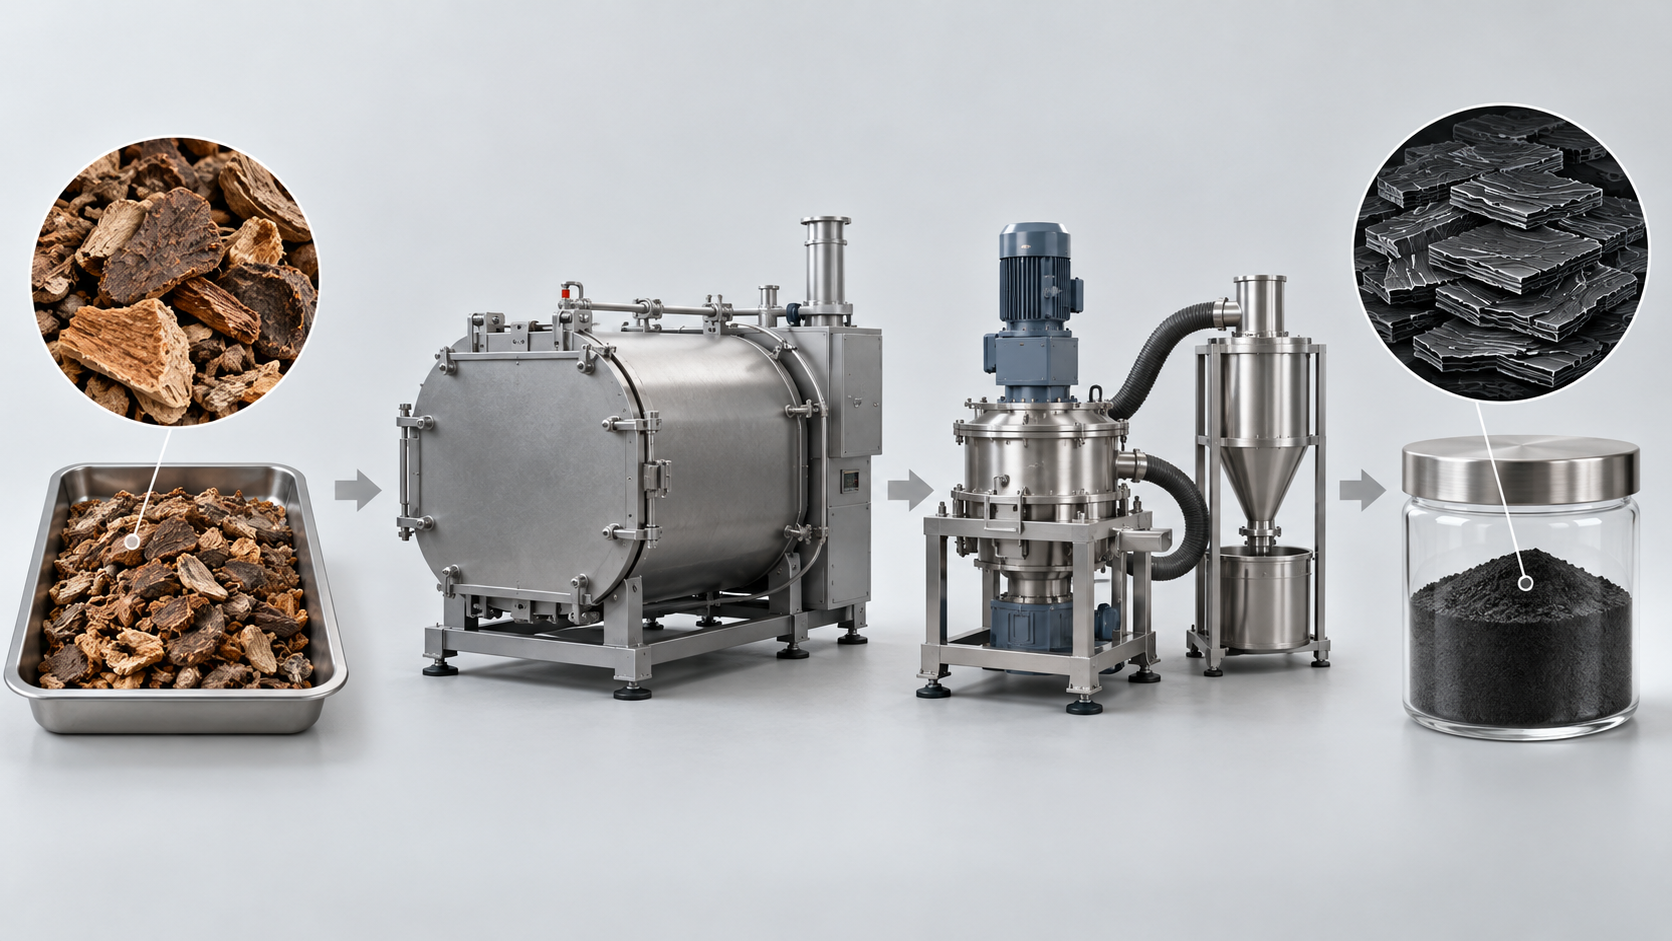
View the original SVG schematic and exact annotations
(1) How carbonization temperature changes the structure
The review summarizes the changes in pores as carbonization temperature rises in the following stagesSourced [2].
- Low temperature: pores are almost all open and exposed to the electrolyte. They contribute to sloping-region capacity, but first-cycle efficiency and plateau capacity are very low.
- Moderate temperature: gaps between crystallite layers partly shrink to form “quasi-closed pores.” First the larger N2 can no longer enter, then even the smaller CO2 is no longer detected. Part of the electrolyte is excluded, and some sloping capacity converts into plateau capacity.
- Higher temperature (beyond a critical temperature set by the precursor): some closed pores become “fully closed” pores that are closed even to the electrolyte, and plateau capacity falls instead.
The review reports that, according to Titirici and co-workers, BET surface area dropped dramatically on heating and reversible capacity shifted from slope-dominated to plateau-dominated. Hasegawa and co-workers showed from true-density measurements that samples treated above 1,600 °C with small BET surface areas still contained many closed pores that contributed to plateau capacitySourced [2]. On graphitization, the review explains that above 1,000 °C, soft carbon crystallites stack rapidly and interconnect, whereas thermosetting precursors mainly undergo crystallite growth, with little stacking or connection. Topological defects are said to persist even after treatment at 2,000 °CSourced [2].
(2) Kuraray's stated values
The Japanese materials maker Kuraray sells a plant-derived hard-carbon anode material, KURANODE™. The values on its product page are as follows.
| Item | Type 1 (high-capacity type) | Type 2 (9 µm) (low-moisture-absorption type) | Type 2 (5 µm) |
|---|---|---|---|
| Average particle size D50 (µm) | 9 | 9 | 5 |
| Specific surface area SSA (m²/g) | 4 | 4 | 6 |
| Interlayer spacing d002 (nm) | 0.38 | 0.38 | 0.38 |
All are Sourced (Kuraray KURANODE™ product page [6]; the page says the values are measured by Kuraray, for reference only and not guaranteed. No capacity or first-cycle efficiency for sodium-ion use is listed on that page, so none is given here).
The company cites for KURANODE™ a moisture resistance high enough to use water-based binders (SBR/CMC), input/output, low-temperature and cycle performance better than graphite, and cost competitiveness against conventional hard carbon, and says it suits the anode of lithium-ion capacitors and sodium-ion batteries as well as lithium-ion batteriesSourced [6, 7] (company claims). Whether this product is used in any specific sodium-ion battery, such as CATL's, could not be confirmed.
8. A materials engineer's view (2): the difficulty of keeping “the same hard carbon” from lot to lot
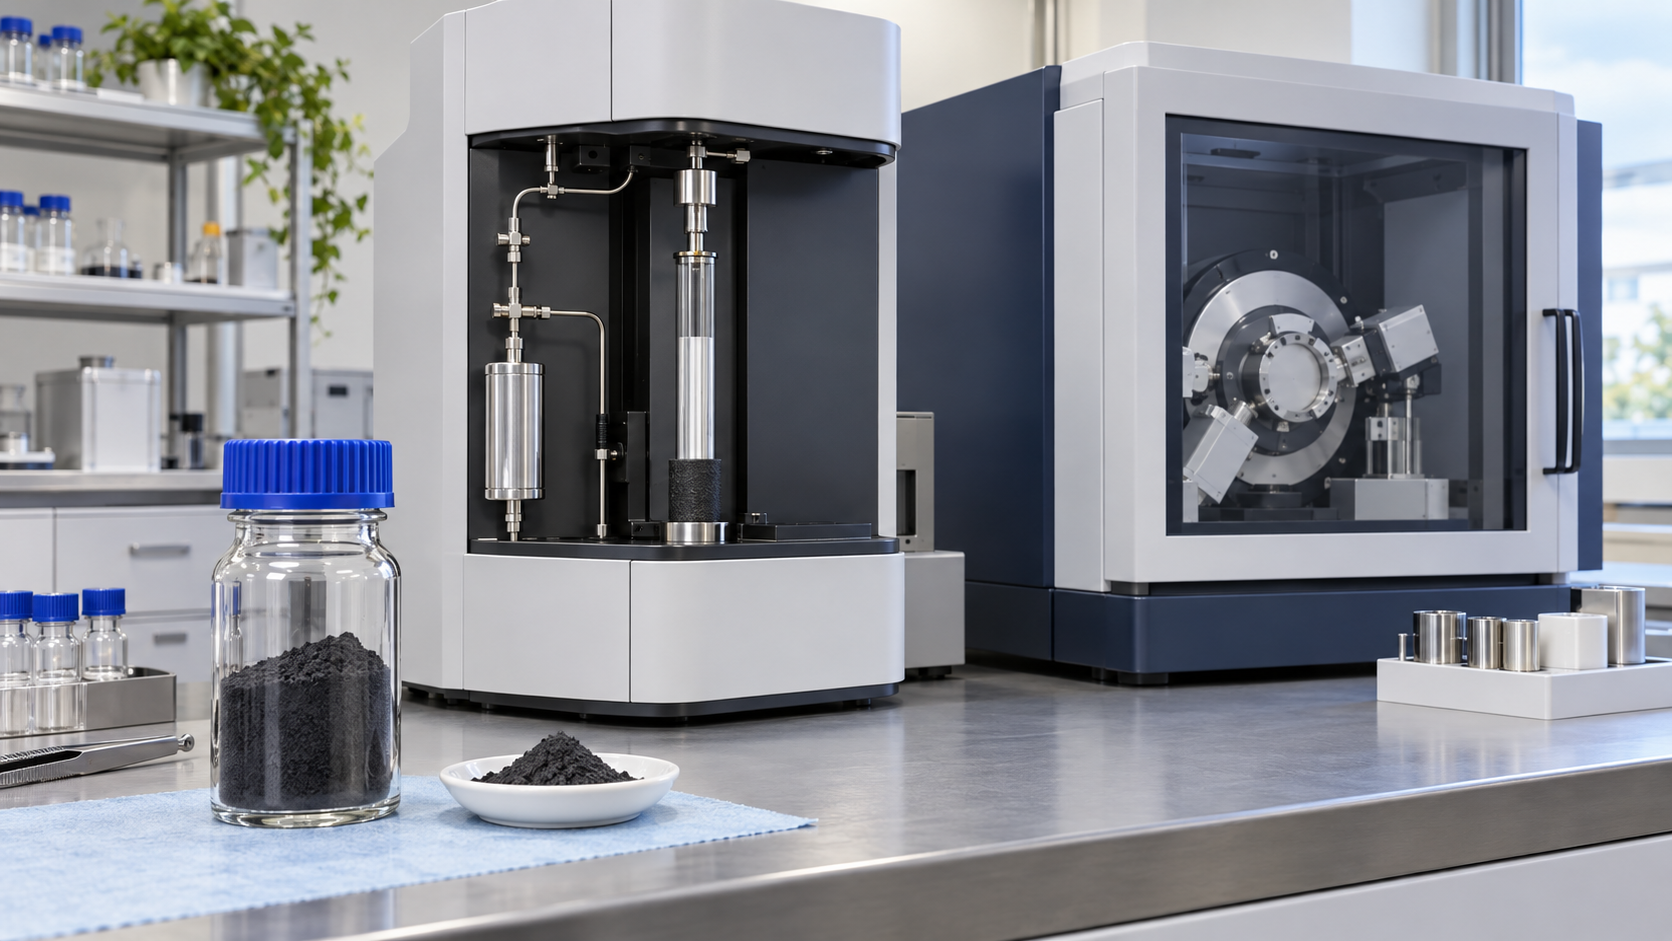
In mass-producing hard carbon, the hard part is not making a new structure but making the structure the same every time. The published material suggests three sources of non-uniformitySourced [2].
- Raw-material variation. For biomass, initial screening is difficult, and composition (the ratio of crystalline cellulose, hemicellulose and lignin) affects closed-pore formation. The review describes a study of bamboo from which lignin was selectively removed, which changed the free radicals released in pyrolysis and thus closed-pore formation.
- Variation in pretreatment conditions. Pre-oxidation changes performance with differences of tens of degrees, as in the example where results reversed between 250 and 280 °C (Chapter 6).
- A critical carbonization temperature that differs by precursor. Beyond it, plateau capacity falls instead (Chapter 7). Temperature distribution within the furnace becomes lot-to-lot difference directly.
The numbers the user sees also matter. Kuraray lists particle size D50, surface area and interlayer spacing d002 as stated values and separates a high-capacity type from a low-moisture-absorption type [6]. CATL names “gas generation in hard carbon” among the obstacles it overcame for sodium-ion mass productionSourced [8] (a company claim; the release does not describe its cause or remedy). As commentary, given that hard carbon retains oxygen-containing surface groups (roadmap [1]), has open pores and is thought to adsorb moisture readily, moisture content, surface area and functional-group content could be control items for gas generation (inference; this cannot be confirmed from CATL's statement).
The specification a materials maker should present to a battery maker will probably include, besides particle size and surface area, firing conditions (peak temperature, atmosphere, heating profile), interlayer spacing, moisture content, ash and impurities, and lot-to-lot standard deviation (commentary by this article; specific specification values could not be confirmed in published primary sources).
9. The trade-off between first-cycle efficiency and capacity
(1) Why first-cycle efficiency is a problem
First-cycle Coulombic efficiency (ICE) is the fraction of the first charge (sodium inserted) that comes back on the first discharge (sodium extracted). What does not come back is lost, because sodium becomes decomposition products of the electrolyte (the SEI) or is trapped inside the material. The review says that the large surface area of open pores makes a great deal of SEI and lowers first-cycle efficiency and cycling stability, and that some defects bind sodium so strongly that they trap it irreversiblySourced [2].
In a sodium-ion full cell, the only sodium that can go into the anode is what the cathode holds. For alloy and conversion anodes the roadmap says that a large excess of cathode is required to compensate for large initial irreversible capacitySourced [1]. The same logic applies to hard carbon (commentary by this article).
Assume an anode with a reversible capacity of 300 mAh/g and a cathode that can deliver 130 mAh/g on first charge (a polyanion-type example). We calculate the weight of active material needed to cycle 1 Ah, for each first-cycle efficiencyOur calculation.
Premises: anode weight = 1 Ah ÷ 0.300 Ah/g = 3.33 g (independent of efficiency). The cathode must supply (1 ÷ ICE) Ah of sodium to the anode on first charge, so cathode weight = (1 ÷ ICE) ÷ 0.130 Ah/g. Current collectors, conductive additive, binder, electrolyte, packaging and the cathode's own efficiency are ignored: these are active-material-only values.
| Anode first-cycle efficiency | Anode weight (g/Ah) | Cathode weight (g/Ah) | Total active material (g/Ah) | Difference from 100% |
|---|---|---|---|---|
| 100% (ideal) | 3.33 | 7.69 | 11.03 | - |
| 90% | 3.33 | 8.55 | 11.88 | +8% |
| 80% | 3.33 | 9.62 | 12.95 | +17% |
| 70% | 3.33 | 10.99 | 14.32 | +30% |
Our calculation (assumptions: anode 300 mAh/g, cathode 130 mAh/g). Active-material-only values, not cell weight or energy density.
A drop in first-cycle efficiency from 90% to 80% alone raises the active material needed for the same capacity by about 9% (12.95 ÷ 11.88 = 1.09)Our calculation. The calculation shows that, in a full cell, raising first-cycle efficiency can matter more for weight than raising the hard carbon's capacity. With a different pairing of cathode and anode capacities the numbers change.
(2) Do capacity and efficiency simply trade off?
Looking at the 15 laboratory values in the review's Table 1 (Fig. 7), higher capacity and higher first-cycle efficiency are not in a simple inverse relationship. Some entries have efficiency above 90% with total capacity around 450 mAh/g (Nos. 2 and 9), while the two entries near 500 mAh/g (Nos. 10 and 14) have efficiencies of 77.6% and 82.3%Sourced [2].
| No. | Precursor / treatment | First-cycle efficiency (%) | Total capacity (mAh/g) |
|---|---|---|---|
| 1 | Bio-oil / oxidation | 90.5 | 347.3 |
| 2 | Spores / oxidation | 90.23 | 453.75 |
| 3 | Phenolic resin / hydrothermal treatment | 71.6 | 372.7 |
| 4 | Corn starch / esterification | 90.9 | 378 |
| 5 | Phenolic resin / molecular regulation | 88.5 | 340.3 |
| 6 | Bamboo / component optimization | 92 | 422 |
| 7 | Starch / CO2-induced pore formation | 90.56 | 487.6 |
| 8 | Paper towels / Mn pore-forming | 92.5 | 336.8 |
| 9 | Zinc gluconate / self-template pore-forming | 91.7 | 464 |
| 10 | Phenolic resin / ZnO-template pore-forming | 77.63 | 501 |
| 11 | Polyacrylonitrile / PEG pore-forming | 73.7 | 365.4 |
| 12 | Lignin / carbon-dot pore-forming | 78.09 | 368.9 |
| 13 | Phenolic resin / soft-carbon coating | 74.8 | 359.8 |
| 14 | Activated carbon / CVD | 82.32 | 524 |
| 15 | Phenolic resin / two-step carbonization | 83 | 351 |
All are Sourced (Table 1 of the 2025 review [2]; current densities 20 to 50 mA/g). The original papers the review cites were not checked here.
Three readings follow (commentary by this article).
- Cases that achieve both have been reported. The table has several entries with efficiency above 90% and total capacity above 400 mAh/g (Nos. 2, 6, 7 and 9). They are, however, laboratory samples given elaborate treatments such as oxidation, pore formation or special precursors.
- The type of treatment changes the result greatly. Even for the same phenolic resin, efficiency differs by more than ten points: 71.6% with hydrothermal treatment, 83% with two-step carbonization and 88.5% with molecular regulation.
- Even so, the highest-capacity entry need not have high efficiency. The two entries near 500 mAh/g (Nos. 10 and 14) have efficiencies near or below 80%, yet No. 7 reaches 488 mAh/g at 90.6%. These 15 were not chosen systematically, so this is not a general law.
The physical reason for the trade-off lies in the carbonization-temperature section (Fig. 5). Carbonized at low temperature, a material has many open pores and defects and gives sloping capacity, but forms SEI and has low first-cycle efficiency. As temperature rises, open pores shrink and efficiency rises and closed pores increase, giving plateau capacity, but beyond the critical temperature fully closed pores grow and plateau capacity fallsSourced [2]. In other words, the temperature that maximizes first-cycle efficiency and the temperature that maximizes capacity need not coincide.
10. Cost
The roadmap says that, although hard carbon has kept ahead of other anode materials, its cost is significantly higher than that of graphite. In the same passage it states that graphite costs 500 to 2,000 US dollars per tonne, similar to the cost of common hard-carbon precursors such as cellulose and sucroseSourced [1]. A simple calculation shows why hard carbon can cost more even when the precursor price is similar.
The mass fractions of carbon in cellulose (C6H10O5) and sucrose (C12H22O11), from atomic masses (C 12.011, H 1.008, O 15.999), are as followsOur calculation.
- Cellulose: 72.07 ÷ 162.14 = 44.4% (at least 2.25 kg of precursor per kg of carbon)
- Sucrose: 144.13 ÷ 342.30 = 42.1% (at least 2.37 kg of precursor per kg of carbon)
These are the theoretical upper limits, assuming all the precursor's carbon remains. In real carbonization non-carbon components leave and some carbon is lost too, so yields are lower and more precursor is needed (actual yields could not be confirmed in published primary sources).
For example, with a precursor at 500 to 2,000 US dollars per tonne, even at the theoretical-limit yield the precursor cost per kilogram of carbon is 1.1 to 4.5 US dollars (500 × 2.25 to 2,000 × 2.25, divided by 1,000). Against graphite at 0.5 to 2 US dollars per kilogram, the precursor cost alone is about 2.25 times higher. This excludes furnace energy, impurity removal, and milling and classificationOur calculation.
This calculation shows one structural reason hard carbon is priced above graphite, but it does not show current market prices of hard carbon (commentary by this article). As other cost drivers the review lists the environmentally unfriendly impurity removal before carbonizing biomass, extra time and energy for two-step carbonization, and expensive resin precursors that are hard to industrializeSourced [2]. Kuraray says KURANODE™ is cost-competitive against conventional hard carbonSourced [6] (a company claim; no price is given). A market price of hard carbon (US$/kg) could not be confirmed from public-agency statistics or published material (an item that could not be confirmed).
11. Characterization — XRD, SAXS and BET
What makes hard carbon hard to evaluate is that each technique sees a different structure. The roadmap says that combining several techniques is needed to relate structure to performanceSourced [1].
| Technique | What it tells you | Limits |
|---|---|---|
| XRD | Interlayer spacing d002, stacking size of crystallites (Lc), in-plane size (La). The roadmap lists XRD for interlayer spacing [1] | The (002) peak of hard carbon is broad and gives only averages. The review says many characterizations rely on averages that cannot express distributions [2] |
| Raman spectroscopy | Defects and disorder (such as the ratio of the D and G bands). The roadmap lists Raman for defects [1] | An average disorder index that cannot tell the kinds of pores apart (commentary by this article) |
| Gas adsorption (BET, N2 and CO2) | Surface area and pore-size distribution of open pores. N2 reaches pores with entrances above about 0.5 nm, CO2 down to about 0.35 nm [2] | Cannot measure closed pores [1]. Kuraray's stated surface area of 4 to 6 m²/g [6] is an open-pore index and does not show the capacity stored in closed pores (commentary by this article) |
| SAXS (small-angle X-ray scattering) | The average size of nanopores, including both open and closed. A shoulder near 0.1 Å−1 corresponds to periodically arranged nanopores [2] | Depends on the assumed analysis model; requires specialized equipment (commentary by this article) |
| Helium displacement (true density) | Closed-pore volume back-calculated from particle density (reference: graphite at 2.26 g/cm³) [2] | Results change greatly with the choice of reference structure. Reported V(closed) values differ widely between studies [2] |
| Solid-state NMR (23Na) | Whether sodium in the pores is quasi-metallic. The review describes the peak of sodiated samples shifting to higher frequency as an indicator of closed-pore filling [2] | Needs specialized equipment and agreement on interpretation (commentary by this article) |
| Operando measurements | Changes in interlayer spacing, pores and chemical state during cycling by XRD, SAXS, Raman, NMR, XPS and so on [1] | Research measurements, not directly usable for production quality control (commentary by this article) |
Statements marked [1], [2] or [6] are Sourced (the sources' statements). Unmarked statements are commentary by this article.
The roadmap says that benchmarking the best-performing hard carbons and setting international standard protocols would be desirableSourced [1]. Because evaluation methods are not aligned, "capacity" and "first-cycle efficiency" figures from different papers or documents cannot be compared directly. Always check whether it is a half or full cell, the current density, the voltage window, the temperature and the electrolyte (commentary by this article).
12. What is still hard
- The mechanism is unsettled. Which theory applies to which material, and whether it differs by material, is not settled [1, 2]. This is why design rules do not converge.
- There is no scientific criterion for distinguishing open from closed pores. As the review says, a clear definition of closed pores and a systematic account of how open pores become closed are lacking [2].
- Combining first-cycle efficiency with capacity. Laboratory cases that achieve both exist, but they require elaborate treatments, and reproduction in mass production could not be confirmed in this investigation. First-cycle efficiency bears on full-cell weight (Chapter 9).
- Lot-to-lot reproducibility. Being amorphous and sensitive to precursor, pretreatment and carbonization conditions, it has limited reproducibility [2].
- Precursor screening, impurity removal and cost. Initial screening of biomass is difficult and pretreatment carries an environmental load. Hard carbon is said to cost significantly more than graphite [1, 2].
- Moisture and gas generation. A problem CATL names among the obstacles it overcame for mass production [8]. The cause and remedy have not been published.
- Standardization of evaluation. Measurement conditions are not aligned and international standards are not in place [1].
- Hard carbon is a microstructure set by precursor and firing conditions. Crystallites in random orientations, kept from becoming graphite by strong cross-linking, form a hard, finely porous massSourced
- Sodium storage splits into a sloping region (about 1 to 0.1 V) and a plateau region (below 0.1 V), with several theories of the mechanism. Filling of closed pores is emphasized in recent workSourced
- Measured capacity is 200 to 450 mAh/g in half cells, about 300 mAh/g on average. If closed pores are filled at sodium-metal density, the upper limit works out to about 1,128 mAh/g per cm³/g of closed-pore volumeOur calculation
- Raising carbonization temperature reduces open pores, raises first-cycle efficiency and increases closed pores. Beyond a critical temperature plateau capacity fallsSourced
- A drop in first-cycle efficiency from 90% to 80% raises the active material needed for the same capacity by about 9% (assuming 300 mAh/g anode and 130 mAh/g cathode)Our calculation
- The cost is said to be significantly above graphite. From the carbon fraction of the precursor, precursor cost alone is at least 2.25 times per kilogram of carbonOur calculation. A market price could not be confirmed
- XRD, BET, SAXS and true density each see a different structure. No single measurement settles good from bad
13. How to read evaluations and standards
Before comparing which number is larger, align the basis of comparison in the following order. This is an editorial reading checklist, not a set of test conditions or acceptance limits prescribed by a standard.
- 1. What was measured?
- initial efficiency, reversible capacity and low-voltage capacity. Check the units and whether the result describes a material, component or complete system.
- 2. Under which conditions?
- precursor, heat treatment, particle and electrode structure, electrolyte and counter-electrode. Treat results under different conditions as separate results before comparing them.
- 3. The comparison trap
- Do not transfer half-cell capacity against sodium metal directly to a full cell.
- 4. What does the standard cover?
- Check the identifier, title, edition and scope in the issuing body’s material. Distinguish test methods, safety, interoperability and management requirements. Naming a standard alone does not establish that a test, conformity assessment or certification has been completed.
Keep a comparison note containing the object, units, conditions, sample count and variation, comparator, standard edition and unresolved points. Do not invent numerical conditions or acceptance limits from a public abstract of a standard.
14. Glossary
- Hard carbon (non-graphitizing carbon)
- Carbon that does not become graphite even at high temperature. Crystallites freeze in random orientations.
- Soft carbon (graphitizing carbon)
- Carbon that tends toward a graphite structure on heating.
- Turbostratic structure
- A structure in which carbon layers stack without a regular orientation or registry.
- d002 (interlayer spacing)
- The distance between carbon layers, found from the XRD (002) peak.
- Open / closed pores
- Pores gas can enter and pores it cannot. Considered in terms of entrance width.
- Sloping / plateau region
- The part of the insertion curve where potential falls gradually, and the part where it is nearly constant.
- Quasi-metallic Na cluster
- Sodium inside a closed pore gathered in a state close to metal. Can be probed by NMR.
- First-cycle Coulombic efficiency (ICE)
- The ratio of first-discharge capacity to first-charge capacity.
- SEI
- The film that electrolyte decomposition products form on the electrode surface.
- BET surface area
- The surface area including open pores, obtained from gas adsorption.
- SAXS
- Small-angle X-ray scattering. Used to examine the size of nanopores and similar features.
- Cross-linking
- Polymer chains linking into a network. It sets the character of a hard-carbon precursor.
15. References
- Tapia-Ruiz et al. (NEXGENNA consortium of the Faraday Institution and others) "2021 roadmap for sodium-ion batteries," Journal of Physics: Energy 3, 031503 (2021) (open access) — doi.org/10.1088/2515-7655/ac01ef
- Gan et al. (Central South University) "Comprehensive Understanding of Closed Pores in Hard Carbon Anode for High-Energy Sodium-Ion Batteries," Nano-Micro Letters 17, 325 (2025) (open access) — doi.org/10.1007/s40820-025-01833-x
- Franklin "Crystallite growth in graphitizing and non-graphitizing carbons," Proceedings of the Royal Society A 209, 196-218 (1951) (abstract checked) — doi.org/10.1098/rspa.1951.0197
- Stevens and Dahn "High Capacity Anode Materials for Rechargeable Sodium-Ion Batteries," Journal of The Electrochemical Society 147, 1271 (2000) (abstract checked) — doi.org/10.1149/1.1393348
- Bommier, Surta, Dolgos and Ji "New Mechanistic Insights on Na-Ion Storage in Nongraphitizable Carbon," Nano Letters 15, 5888-5892 (2015) (abstract checked) — doi.org/10.1021/acs.nanolett.5b01969
- Kuraray (Environmental Solutions Division) "Bio Hard Carbon Anode Material for Lithium-ion Batteries | KURANODE™" (product page, with grade values) — carbon-solutions.kuraray.com
- Kuraray "KURANODE™" (product list page) — kuraray.com
- CATL "CATL Unveils Six Major Innovations: Multi-Chemistry Systems to Redefine New Energy Mobility Experience," 21 April 2026 — catl.com
16. Claim-to-source audit
| Claim in the text | Basis | Label |
|---|---|---|
| That hard carbon is made from oxygen-rich precursors and does not become graphite at any carbonization temperature; that its graphitic domains have an interlayer spacing above 0.34 nm, are randomly oriented and are joined by disordered carbon; that closed pores lie between the domains and gas sorption cannot probe them; that larger crystallites mean larger pores; that residual heteroatoms such as oxygen groups are present; that the exact structure depends on precursor and carbonization conditions and is unknown; that the sloping region is 1 to 0.1 V and the plateau below 0.1 V; the measured capacity of 200 to 450 mAh/g (about 300 on average) against graphite's 372 mAh/g; the theories of the storage mechanism; the NMR work on metallic Na in pores; the combined use of XRD, Raman, XPS, SAXS and gas adsorption; that hard carbon costs significantly more than graphite, with graphite at 500 to 2,000 US dollars per tonne similar to the precursors; the cathode excess needed for large initial irreversible capacity; the call for benchmarking and international standard protocols; and the ease of Na plating and dendrites | 2021 roadmap for sodium-ion batteries (Chapters 2 and 7)Reference 1 https://doi.org/10.1088/2515-7655/ac01ef | Sourced |
| That hard carbon is amorphous with limited reproducibility; that there is no rigorous criterion for open versus closed pores; the view that quasi-metallic Na clusters in closed pores contribute most to plateau capacity; the history of d002 of 0.36 to 0.40 nm being thought the plateau source and of d002 and defect control failing to increase active sites; the temperature-dependent changes (open at low temperature, quasi-closed at moderate, fully closed past the critical temperature, plateau capacity falling); BET area dropping with temperature and capacity shifting from slope to plateau; closed pores remaining above 1,600 °C; the difference from soft carbon above 1,000 °C; most pyrolysis done by about 600 °C; topological defects persisting at 2,000 °C; the probe sizes and entrance widths (0.5 nm and 0.35 nm) for N2, CO2 and He; the SAXS shoulder near 0.1 Å−1; the closed-pore volume formula (reference 2.26 g/cm³) and its uncertainty; that open pores' large area raises SEI and lowers ICE and cycling stability; that strongly binding defects trap Na; the characteristics of biomass, resin and pitch (difficult screening, impurity removal, expensive resin, pitch needing oxidation); the 250 °C versus 280 °C pre-oxidation result; that two-step carbonization increases time and energy; the 15 ICE, total-capacity and current-density values in Table 1; the need to compare within the same raw-material series; and the difficulty of linking closed-pore volume to plateau capacity | Gan et al. 2025 (review)Reference 2 https://doi.org/10.1007/s40820-025-01833-x | Sourced |
| That a study of carbons of different origin treated at 1,000 to 3,000 °C showed graphitizing and non-graphitizing carbons to be two distinct classes; that in non-graphitizing carbons strong cross-linking forms at low temperature and leaves crystallites in random orientation in a rigid, finely porous mass; and that in graphitizing carbons cross-linking is weaker, neighboring crystallites lie nearly parallel and the structure is more compact | Franklin 1951 (abstract)Reference 3 https://doi.org/10.1098/rspa.1951.0197 | Sourced |
| The reported reversible sodium capacity of 300 mAh/g in hard carbon and the similarity of the mechanism to lithium insertion | Stevens and Dahn 2000 (abstract)Reference 4 https://doi.org/10.1149/1.1393348 | Sourced |
| The description of the “card-house” model (intercalation between turbostratic nanodomains followed by pore filling), the finding that tuning nanodomain size revealed a correlation with structural defects, and the proposed three-stage picture of defect-site storage, intercalation and pore filling | Bommier et al. 2015 (abstract)Reference 5 https://doi.org/10.1021/acs.nanolett.5b01969 | Sourced |
| Kuraray's stated values for KURANODE™ by grade (D50 9, 9 and 5 µm; SSA 4, 4 and 6 m²/g; d002 0.38 nm); that Type 1 is the high-capacity type and Type 2 the low-moisture-absorption type; that measurement is by Kuraray and the values are for reference, not guaranteed; plant origin; moisture resistance allowing water-based binders (SBR/CMC); input/output, low-temperature and cycle performance better than graphite; cost competitiveness against conventional hard carbon; and suitability for the anodes of lithium-ion batteries, lithium-ion capacitors and sodium-ion batteries | Kuraray KURANODE™ product pagesReference 6 https://carbon-solutions.kuraray.com/en/kuranode/Reference 7 https://www.kuraray.com/global-en/products/kuranode/ | Sourced (company claim) |
| That CATL named “extreme water control,” “gas generation in hard carbon,” “aluminium foil adhesion” and “self-forming anode systems” among the obstacles overcome for sodium-ion mass production (with no detail given) | CATL, 21 April 2026Reference 8 https://www.catl.com/en/news/6811.html | Sourced (company claim) |
| The estimate of an upper limit on plateau capacity from pore volume (sodium-metal density 0.968 g/cm³, about 1,128 mAh per cm³, 56 to 282 mAh/g for 0.05 to 0.25 cm³/g), and the worked values of V = 1/ρ − 1/2.26 (0.224 for ρ = 1.5 and 0.146 cm³/g for 1.7) | Our calculation. Premises: sodium density, atomic mass 22.990 and the Faraday constant (26,801 mAh/mol); pore volumes and particle densities are examples. A guide to an upper limit, not a prediction | Our calculation |
| The conversion of d002 to 2θ by Bragg's law (Cu Kα1 0.15406 nm: 0.3354 gives 26.55°, 0.36 gives 24.71°, 0.38 gives 23.39°, 0.40 gives 22.21°) | Our calculation. The wavelength and graphite d002 (0.3354 nm) are standard values | Our calculation |
| The change in active-material weight with first-cycle efficiency (11.03 g/Ah at 100%, 11.88 at 90%, 12.95 at 80%, 14.32 at 70%; about 9% more from 90% to 80%) | Our calculation. Active-material-only values under the assumptions of an anode at 300 mAh/g, a cathode at 130 mAh/g and a cathode that supplies 1/ICE of sodium. Not cell weight or energy density | Our calculation |
| The carbon fraction of cellulose (44.4%) and sucrose (42.1%), at least 2.25 kg and 2.37 kg of precursor per kg of carbon, and a precursor cost of 1.1 to 4.5 US dollars per kg of carbon for precursors at 500 to 2,000 US dollars per tonne | Our calculation. Atomic masses (C 12.011, H 1.008, O 15.999) and the theoretical limit in which all precursor carbon remains. Real yields are lower. The precursor price range is from the roadmap (Reference 1) | Our calculation |
| Kuraray's capacity and first-cycle efficiency for sodium-ion use, adoption in any specific battery such as CATL's, specific carbonization temperatures, times and yields, a market price of hard carbon (US$/kg), companies' specification values, and the cause of gas generation | Not stated here because no published primary source within this investigation could confirm them | Commentary |
| The reading that moisture content, surface area and functional-group content could be control items for gas generation | Inference. It cannot be confirmed from CATL's statement. Commentary by this article based on hard carbon retaining oxygen-containing groups (roadmap) and having open pores | Commentary |
| That an unsettled mechanism means missing design rules; the items a materials maker should present (firing conditions, interlayer spacing, moisture, ash, lot-to-lot standard deviation); that first-cycle efficiency can matter for full-cell weight; what the 15 entries in Fig. 7 do and do not show; and the limits of the characterization techniques (parts of the table) | This article's own organization and commentary based on published material. Not views expressed by any company or institution | Commentary |
| That Figs. 1, 2, 3, 4, 5, 7 and 8 are explanatory drawings, not real structures, curves or measurement results, and that the hero image and Fig. 6 are AI-generated images | A note by this article | Commentary |
Last updated 10 October 2026. Sources are limited to primary material (peer-reviewed papers, open-access reviews and roadmaps, and official company product pages and press releases). Values from company materials are treated as company-stated values and company claims. Because the article includes structural readings and materials-design interpretations, those are marked as Commentary and kept separate from sourced fact. Kuraray's capacity and first-cycle efficiency for sodium-ion use, adoption in any specific battery such as CATL's, specific carbonization temperatures, times and yields, a market price of hard carbon and the cause of gas generation are not stated here because no published primary source could confirm them. The scatter plot in Fig. 7 restates numbers from the review's table; the original papers were not checked. All figures are explanatory concept graphics. Figs. 1, 2, 3, 4, 5, 7 and 8 are vector drawings; the hero image and Fig. 6 are AI-generated images, and none of them shows a real cross-section, micrograph, measured data or physical product.