TECHNOLOGY EXPLAINER
Grid-Scale Battery Energy Storage Systems
— The battery is one component: what connects into one system
A grid battery energy storage system (BESS) reaches the power grid only when a power conversion system (PCS), controls (BMS and EMS), HVAC, fire and safety equipment and a transformer join the battery. In the United States, operating batteries reached 43.6 GW at the end of 2025, and another 8.3 GW was added in the first half of 2026 (EIA). In the California market in December 2024 there was 13,000 MW and 47,300 MWh, mostly 4-hour lithium-ion. This article sets out, from a materials engineer's view, the configuration, how to read MW and MWh, the adoption of LFP, fire-safety standards and market rules. Economics is left to our explainer on storage economics.
- What a grid battery energy storage system is (the short version)
- Configuration: from cell to grid
- Reading capacity: MW, MWh and hours
- Uses: frequency regulation, peak shifting and arbitrage
- The adoption of LFP, and a materials engineer's view 1: how cycles are counted
- Installation and fire safety: layers of standards
- A materials engineer's view 2: most incidents lie outside the battery
- Market rules: FERC Order 841 in the U.S. and Japan's long-term decarbonization auction
- Track record: what official sources confirm
- Limits, and what could not be confirmed
- How to read evaluations and standards
- Glossary
- References
- Claim-to-source audit
Sourced = stated in a published source (source linked)
Our calculation = a value this article calculated from stated assumptions
Not yet confirmed = a plan, target or proposal for which no result or adoption has been confirmed
Readings about materials and structure are marked as commentary. Inference marks a reading that was not confirmed in a primary source.
Regulations distinguish proposal, adoption and entry into force, with the date checked (October 2026). This article does not argue about the merits of, or responsibility for, any particular product, company or incident.
PNNL figures are estimates based on developer surveys, not market prices. This article is a technical explainer, not advice on design, operation or fire protection of equipment, or on investment or procurement.
1. What a grid battery energy storage system is (the short version)
- Three kinds by where they sit. Japan's Agency for Natural Resources and Energy (ANRE) divides stationary storage into (1) grid-side systems connected directly to the power grid, (2) systems co-located with renewables, and (3) behind-the-meter systems in homes, buildings and factories Sourced (article of 8 October 2026) [Ref. 12]. This article is about (1), which is generally several container-type units on a large site.
- Growth is rapid. According to the EIA, operating batteries in the U.S. were 43.6 GW at the end of 2025, with 8.3 GW added in the first half of 2026 for about 52 GW. Operators plan to add another 54 GW over about two and a half years (plans, not results) Sourced [Ref. 3].
- What is not the battery matters. In EPRI's analysis, of 26 incidents with an identified cause, only 3 (11%) were attributed directly to battery cells; most involved parts other than the battery (wiring, HVAC, fire-suppression piping) and controls Sourced [Ref. 5].
2. Configuration: from cell to grid
PNNL's cost categories help organize the configuration. In a BESS, the storage block (SB) is the battery modules, racks and battery management system (BMS); the storage balance of system (BOS) is containers, cabling, switchgear, HVAC, safety disconnects, fire extinguishers and so on. Power equipment is the power conversion system (PCS) and DC-DC converter, and controls and communication is the energy management system (EMS) that runs the whole. There are also system integration (joining modules, racks, containers and power equipment), EPC (installation and commissioning) and grid integration (transformer, metering, breakers) Sourced [Ref. 1].
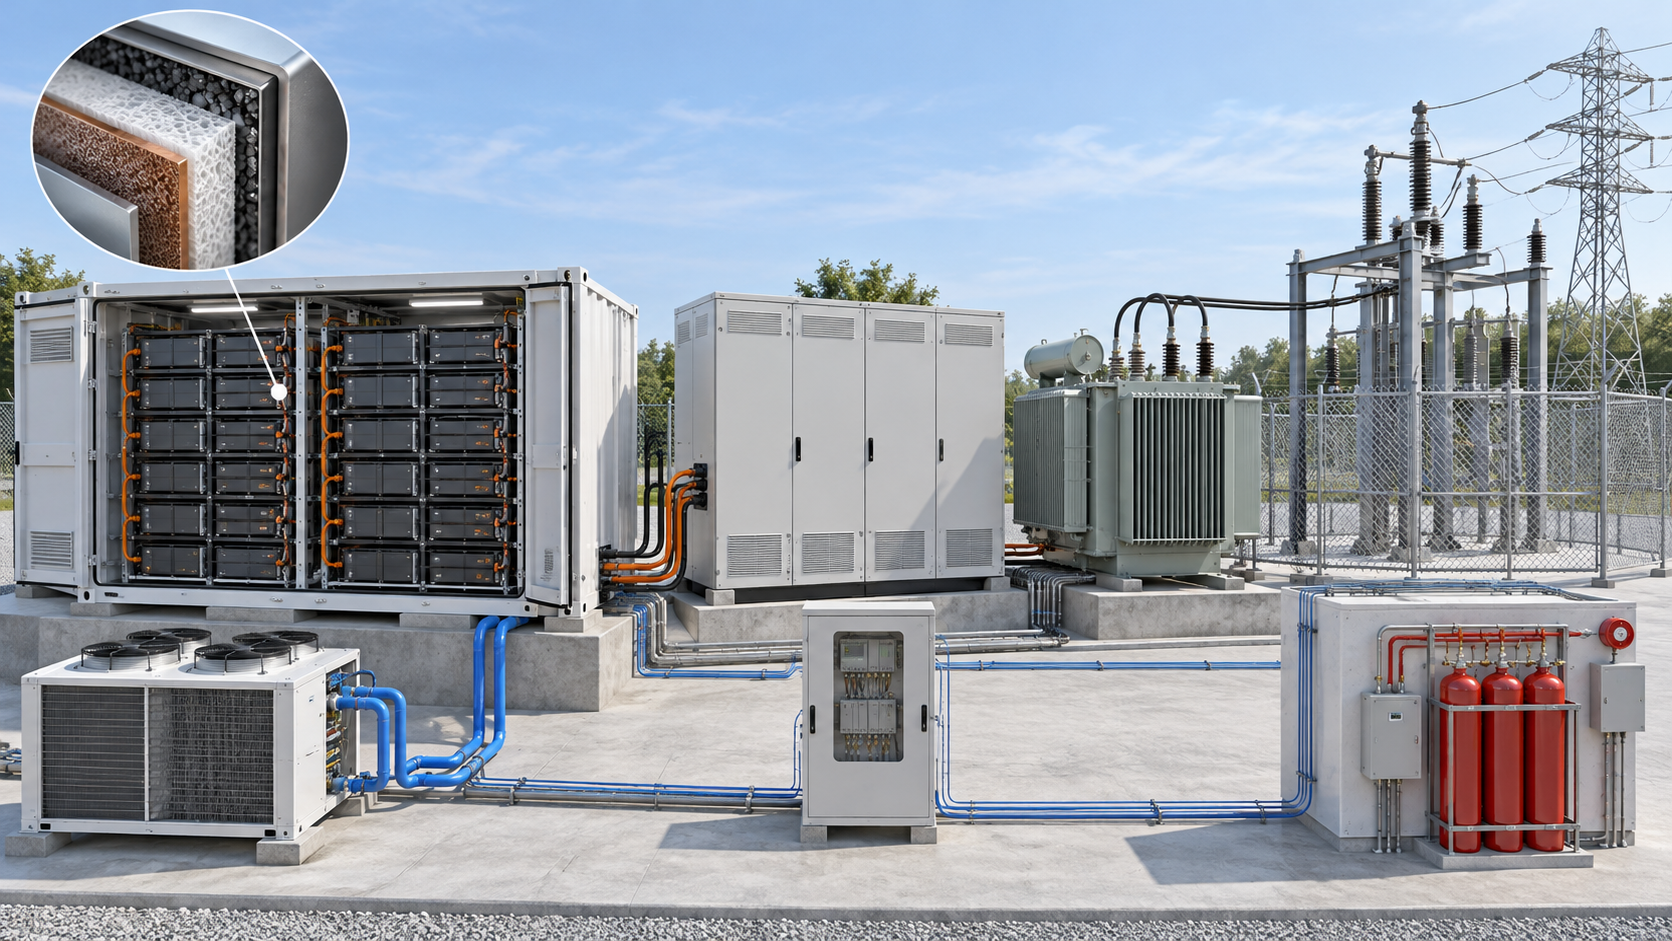
View the original SVG schematic and exact annotations
- Cell to module to rack: cells are connected in series and parallel into modules and then racks. The BMS monitors the battery by voltage, temperature and so on (PNNL's definition of the SB).
- HVAC and safety equipment: on site, modules and racks are housed in a container fitted with HVAC and fire suppression and joined to the power equipment (PNNL's definition of system integration). EPRI cites a case in which a coolant leak in the HVAC led to a fire during commissioning (2021, Victoria Big Battery, Australia) [Ref. 1, 5].
- PCS and transformer: batteries are DC and the grid is AC, so the PCS converts and a transformer matches the grid voltage. PNNL states round-trip efficiency on the AC side, including PCS and transformer losses (AC-AC) [Ref. 1].
- EMS: it receives instructions from the grid operator or market (frequency regulation, charge-discharge schedules) and runs the whole plant (PNNL's definition of controls and communication).
3. Reading capacity: MW, MWh and hours
PNNL defines duration as rated energy divided by rated power Sourced. NLR's Annual Technology Baseline (ATB) expresses cost as total cost (US$/kW) = battery cost (US$/kWh) × duration (h) + BOS cost (US$/kW). It writes that as duration grows, cost per kWh falls and cost per kW rises, and that this is common to all energy storage technologies Sourced [Ref. 2]. The definition of duration is PNNL's [Ref. 1].
- Duration: 400 MWh / 100 MW = 4 hours. The same 400 MWh could also be 200 MW × 2 h or 50 MW × 8 h (Fig. 2) Our calculation.
- Energy needed to charge: NLR's ATB 2025 assumes a round-trip efficiency of 85%. Delivering 400 MWh on the AC side takes 400 / 0.85 = about 470.6 MWh of charging. With PNNL's LFP figure (AC-AC, estimate for 2021 values) of 82.59% it is 400 / 0.8259 = about 484.3 MWh Our calculation [Ref. 2, 1].
- Capacity factor: the ATB gives the capacity factor of a 4-hour system cycled once a day as 16.7% (4/24) and of a 2-hour system as 8.3% Sourced.
- CAISO average: storage in December 2024 was 13,000 MW with a maximum stored energy of 47,300 MWh, so 47,300 / 13,000 = about 3.6 hours Our calculation [Ref. 4].
Assumptions and limits: whether the rating is DC (battery terminals) or AC (point of interconnection), and how the usable state-of-charge (SOC) range is treated, differs by product and contract. The 400 MWh here is an example of how to read a rating, not the specification of any plant. The ATB assumes a 15-year life and includes battery augmentation in fixed O&M (4% of capital cost) Sourced [Ref. 2].
4. Uses: frequency regulation, peak shifting and arbitrage
CAISO's market monitoring department writes that most large-scale storage in operation is lithium-ion of up to 4 hours, mainly doing intra-day arbitrage: charging with cheap midday power and selling in the expensive evening. Because batteries respond quickly, they also suit short-term balancing such as frequency regulation and the flexible ramping product Sourced [Ref. 4].
- Frequency regulation: in CAISO in 2024, batteries provided about 84% of regulation. The report says batteries first favored regulation because it avoids deep charge and discharge cycles that degrade cells quickly. As battery capacity has grown, the share of battery capacity assigned to ancillary services has fallen Sourced [Ref. 4].
- Peak shifting and arbitrage: charge at midday and discharge in the evening. Of the 13,000 MW in December 2024, the report puts stand-alone at 5,800 MW, co-located (at the same site as renewables and others) at 5,700 MW and the storage part of hybrids at about 1,500 MW Sourced [Ref. 4].
- Use in Japan: grid-side storage in Japan is described as storing power when there is a surplus and discharging when there is a shortage, to stabilize the grid (ANRE) Sourced [Ref. 12]. Under the long-term decarbonization auction the design earns 20 years of capacity revenue (section 8).
5. The adoption of LFP, and a materials engineer's view 1: how cycles are counted
NLR's ATB 2025 expresses grid battery cost with costs based on lithium iron phosphate (LFP) cells (60 MW; 2, 4, 6, 8 and 10 hours) Sourced [Ref. 2]. In PNNL's estimate for 2021 values, the installed cost for 100 MW and 10 hours is US$356/kWh for LFP and US$405/kWh for nickel manganese cobalt oxide (NMC) Sourced. The LFP chemistry itself is covered in our explainer on cathode materials and the anode in our explainer on graphite anodes and electrode design [Ref. 1].
PNNL states LFP cycle life as cycles, at each depth of discharge (DoD), to the point where the remaining energy has fallen to the energy at the average depth of discharge. At 80% DoD it is 2,400 cycles (1,520 for NMC), at 70% 4,500, at 60% 8,000, at 30% 32,000 and at 5% 192,000 Sourced (developers' reports, corrected for DoD by PNNL) [Ref. 1].
Multiplying cycles by depth of discharge gives the total that can be taken out (full-discharge equivalents) Our calculation: 1,920 at 80%, 3,150 at 70%, 4,800 at 60%, 9,600 at 30% and 9,600 at 5% (Fig. 4). The shallower the use, the more cycles, but the total delivered levels off around 30%. PNNL writes that the high cycle counts reported are partly because accelerated tests run several cycles a day, which lessens calendar aging, and that in operation most warranties limit use to one full-discharge-equivalent cycle per day Sourced.
From the materials side, deeper use means larger changes in the cathode crystal structure and anode volume and more growth of the interphase (SEI and the like), so fewer cycles (commentary based on general understanding; see our explainers on SEI and on battery evaluation and degradation for the mechanisms). When comparing "number of cycles", always check that the depth of discharge, the end-point capacity retention, the temperature and the charge-discharge rate are the same (commentary).
6. Installation and fire safety: layers of standards
The safety of grid storage rests on four layers of standards and tests, cell, module, system and installation. This is what this article could confirm.
- NFPA 855: NFPA describes it as the Standard for the Installation of Stationary Energy Storage Systems, setting minimum requirements for mitigating the hazards associated with ESS. The current edition is the 2026 edition, with 2023 and 2020 editions before it Sourced [Ref. 7]. UL Solutions writes that the 2026 edition puts weight on large-scale fire testing, with a new Annex G.11 setting out expectations for tests of fire spreading from one installation to another. It also says adoption of the 2026 edition will take time [Ref. 6].
- UL 9540 and UL 9540A: UL 9540 is the foundational product safety standard for energy storage systems and equipment, and UL 9540A is a test method for thermal runaway and fire propagation. Edition 5 was a sequential method, going cell, module, unit and installation, and stopping when the criteria at one level were met. Edition 6 runs the installation-level large-scale fire test even when the criteria are met, deliberately igniting vented gas. Edition 6 is planned to take effect on 1 January 2027 Not yet confirmed Sourced [Ref. 6].
- IEC 62933-5-2: safety requirements for grid-integrated electrical energy storage systems (electrochemical-based); the 2020 edition has been published (and adopted as European standard EN IEC 62933-5-2:2020) Sourced [Ref. 8].
- Japan's requirements: the long-term decarbonization auction (bid year FY2025) asks lithium-ion batteries for third-party certification to JIS C 8715-2 or IEC 62619 at cell, module or battery-system level, and proof of conformity to a fire-spread test at module level or above (any of JIS C 8715-2, JIS C 4441, IEC 62619 or IEC 62933-5-2). It also asks for the security conformity label JC-STAR level 1 for the main control-system products (BMS, PCS, EMS and others), and for a manufacturer that has had a "smoke or fire" type incident in a large stationary storage system, material giving the annual number of incidents over the past 10 years and the cause and countermeasure for the 10 main incidents Sourced [Ref. 13].
7. A materials engineer's view 2: most incidents lie outside the battery
EPRI's white paper (May 2024), analysing a database of incidents built from public information, states the following Sourced [Ref. 5].
- The incident rate has fallen: between 2018 and 2023 the global grid-scale BESS failure rate dropped 97%. Of the 30 incidents in the database for 2018 and 2019, 27 were in South Korea, and a significant fraction occurred at a state of charge above 90%.
- Most causes were not the battery: of the 26 incidents with an identified cause, the most common root cause was integration, assembly and construction, followed by operation and controls. The failed components were mostly BOS and controls, and only 3 incidents (11%) were attributed directly to cells. BOS components include DC and AC wiring, HVAC subsystems and safety elements such as fire suppression.
- They happen early: of incidents where the age of the system was known, 72% occurred during construction or commissioning or within the first two years of operation.
- Limits of the information: root causes were identified for only 36% of incidents since 2018. Reluctance of manufacturers to disclose root causes is also named as a constraint.
From the materials side, cell safety (electrolyte, separator, active materials) is covered in our explainers on thermal runaway and battery safety and on electrolytes and separators. At system level, coolant piping, hose fittings and seals, wire insulation and terminal fastening, thermal materials (our explainers on thermally conductive pastes and gap fillers and on automotive silicones and encapsulants) and enclosure corrosion protection and sealing decide long-term reliability (commentary). The Australian case EPRI cites (a coolant leak) shows that quality control of parts that carry liquid bears directly on battery safety.
Caution: this describes a statistical tendency and does not assert the cause of any particular incident. Individual incidents must be checked against reports of the relevant authorities and investigating bodies.
8. Market rules: FERC Order 841 in the U.S. and Japan's long-term decarbonization auction
United States: FERC Order 841
- Adoption and entry into force: the Federal Energy Regulatory Commission (FERC) issued Order No. 841 on 15 February 2018 and it was published in the Federal Register on 6 March 2018 (83 FR 9580), taking effect on 4 June 2018 Sourced [Ref. 9]. The order on rehearing and clarification, Order No. 841-A, was published on 23 May 2019 (84 FR 23902) and took effect on 21 August 2019 Sourced [Ref. 10]. FERC's explainer notes that the rule was upheld on appeal (National Association of Regulatory Utility Commissioners v. FERC, D.C. Circuit, 2020) [Ref. 11].
- What it required: each regional transmission organization and independent system operator (RTO/ISO) had to revise its tariff to set up a participation model for electric storage resources. The model must (1) allow a resource to provide all capacity, energy and ancillary services it is technically capable of providing, (2) allow it to be dispatched and to set the market clearing price as both a wholesale seller and buyer, (3) account for the physical and operational characteristics of storage through bidding parameters or other means, and (4) set a minimum size for participation not exceeding 100 kW. When a storage resource buys from the market and resells, it must buy at the wholesale locational marginal price (LMP) Sourced [Ref. 9].
- Aggregation of distributed resources went to another proceeding: in Order 841 FERC took no final action on its proposals for aggregations of distributed energy resources and said it would handle them in a separate proceeding (RM18-9) Sourced. That led to Order 2222 (our explainer on virtual power plants and distributed energy resources) [Ref. 9].
- Scope: the rule applies to RTO/ISO markets. Most of Texas (ERCOT) is outside FERC's jurisdiction (FERC's explainer) [Ref. 11]. How each RTO/ISO has implemented it was not checked here.
Japan: the long-term decarbonization power source auction
| Item | What could be confirmed |
|---|---|
| Mechanism | A bidding system to promote new investment in decarbonized power sources, running since fiscal 2023. Awarded resources earn capacity revenue at a fixed-cost level in principle for 20 years [Ref. 16, 14] |
| Battery requirements (bid year FY2025) | At least 30,000 kW at the transmission end. Pumped hydro, batteries and long-duration storage systems must be able to run continuously for 6 hours or more at least once a day, with an annual average continuous discharge time of 6 hours or more [Ref. 13] |
| Limit by cell-manufacturing country | For batteries, in each of the lithium-ion and non-lithium-ion categories, projects using cells made in any one country or region other than Japan are limited to less than 30% of the total awarded capacity of that category [Ref. 14] |
| Results (13 May 2026) | Awarded batteries are 10 lithium-ion projects totalling 551,469 kW and 9 non-lithium-ion projects totalling 699,658 kW (summed by this article from the annex list) [Ref. 15]. OCCTO's document gives "1.251 million kW (46%)" for batteries, matching this article's total (1.251 million kW) [Ref. 14] |
| Proposal for the next round (March 2026) | ANRE put to the working group a proposal that in the fourth round, lithium-ion battery projects using cells made by manufacturers certified under Japan's Economic Security Promotion Act be awarded first Not yet confirmed [Ref. 16] |
Table 1 Japan's long-term decarbonization auction and batteries (Sourced; the next-round proposal is a draft under discussion). The annex does not state which chemistries the "non-lithium-ion" projects use.
9. Track record: what official sources confirm
- United States: according to the EIA, operating battery power was 43.6 GW at the end of 2025, with 8.3 GW added in the first half of 2026. As an example of a large facility co-located with solar, the EIA cites Bellefield for CAISO (online December 2025; 500 MW solar and 500 MW storage) and says a doubling is planned to be operational by November 2026, which would make it the largest storage facility in the U.S. Not yet confirmed. A 409 MW battery in Florida (with 75 MW of solar, since 2021) is described as the second-largest battery storage project Sourced [Ref. 3].
- California (CAISO): storage grew from about 500 MW in 2020 to about 13,000 MW and about 47,300 MWh in December 2024 Sourced [Ref. 4].
- Japan: in the long-term decarbonization auction, a total of 1.251 million kW of batteries was awarded in May 2026 (section 8). The total capacity of grid batteries actually operating could not be confirmed from the official material this article checked.
10. Limits, and what could not be confirmed
(1) Operating capacity in Japan
The total operating grid-battery capacity in Japan (kW and kWh) could not be confirmed from the official material this article checked.
(2) The text of NFPA 855
The clauses of NFPA 855 (quantity limits, separation distances, ventilation and explosion-protection requirements and so on) were not checked, as the text is paid or requires registration. Its position is limited to the descriptions on NFPA's information page and in UL Solutions' commentary. Adoption varies by local fire authority (AHJ).
(3) Causes of individual incidents
EPRI's statistics describe a tendency and do not state the cause of individual incidents. Individual incidents, at home or abroad, need to be checked against the reports of authorities and investigating bodies and are not treated here.
(4) Implementation of Order 841 in each region
The tariff revisions and implementation dates of each RTO/ISO were not checked. Tax credits and other support schemes are not covered.
(5) Economics
PNNL's installed-cost estimates are shown, but revenue, LCOS and investment judgments are left to our explainer on storage economics.
(6) Division of labour with other explainers
Our series covers battery chemistry in "Cathode materials", "Graphite anodes and electrode design" and "Battery evaluation and degradation", safety in "Thermal runaway and battery safety", long duration in "Long-duration storage", aggregated operation in "Virtual power plants and distributed energy resources", and data centers in "Data centers and storage".
- A BESS is a system: cells, modules, racks, PCS, transformer, BMS and EMS, HVAC and fire protection. MW, MWh and hours are tied by energy = power x duration Sourced
- The U.S. reached about 52 GW in the first half of 2026. CAISO's 13,000 MW and 47,300 MWh average about 3.6 hours, mostly 4-hour lithium-ion Sourced
- LFP cycle counts come together with depth of discharge. Shallower use gives more cycles but the total delivered levels off Our calculation
- Most incidents lie outside the battery (integration and construction, wiring, HVAC, controls). Cells were the direct cause in 3 of 26 Sourced
- The U.S. has Order 841 (in force 2018); Japan has the long-term decarbonization auction (20 years of capacity revenue, 6 hours or more) supporting market participation of storage Sourced
11. How to read evaluations and standards
Before comparing which number is larger, align the basis of comparison in the following order. This is an editorial reading checklist, not a set of test conditions or acceptance limits prescribed by a standard.
- 1. What was measured?
- MW, MWh, efficiency, availability and capacity retention. Check the units and whether the result describes a material, component or complete system.
- 2. Under which conditions?
- grid connection boundary, auxiliary loads, usable window, ambient temperature and operating history. Treat results under different conditions as separate results before comparing them.
- 3. The comparison trap
- Do not equate internal battery capacity with energy actually deliverable to the grid.
- 4. What does the standard cover?
- Check the identifier, title, edition and scope in the issuing body’s material. Distinguish test methods, safety, interoperability and management requirements. Naming a standard alone does not establish that a test, conformity assessment or certification has been completed.
Keep a comparison note containing the object, units, conditions, sample count and variation, comparator, standard edition and unresolved points. Do not invent numerical conditions or acceptance limits from a public abstract of a standard.
12. Glossary
- BESS
- Battery energy storage system: the whole storage system built around batteries.
- PCS
- Power conversion system: converts between battery DC and grid AC.
- BMS
- Battery management system: monitors voltage, temperature and so on, and keeps the battery in a safe range.
- EMS
- Energy management system: commands the operation of the whole plant.
- Storage block (SB)
- PNNL's category for modules, racks and BMS.
- BOS
- Balance of system: container, cabling, switchgear, HVAC, safety equipment and so on.
- Duration
- Rated energy divided by rated power.
- Round-trip efficiency (RTE)
- Energy that can be discharged divided by the energy used to charge.
- Depth of discharge (DoD)
- The fraction of rated energy that is discharged.
- Augmentation
- Adding or replacing batteries to make up for degradation.
- UL 9540A
- A test method for thermal runaway and propagation, with cell, module, unit and installation levels.
- NFPA 855
- The installation standard for stationary energy storage systems.
- RTO/ISO
- U.S. regional transmission organizations and independent system operators, which run wholesale power markets.
- LMP
- Locational marginal price: the wholesale price by place and time.
- JC-STAR
- Japan's security-requirements conformity assessment and labelling scheme.
13. References
- Pacific Northwest National Laboratory (PNNL)"2022 Grid Energy Storage Technology Cost and Performance Assessment" (PNNL-33283, August 2022) — pnnl.gov
- National Laboratory of the Rockies, NLR (formerly NREL)"Annual Technology Baseline 2025: Utility-Scale Battery Storage" — atb.nlr.gov
- U.S. Energy Information Administration (EIA)"Battery storage capacity averaged 70% growth over the last three years" (Today in Energy, 7 August 2026) — eia.gov
- CAISO Department of Market Monitoring"2024 Special Report on Battery Storage" (May 2025, PDF) — caiso.com
- Electric Power Research Institute (EPRI)"Insights from EPRI's Battery Energy Storage Systems (BESS) Failure Incident Database: Analysis of Failure Root Cause" (May 2024, PDF) — restservice.epri.com
- UL Solutions"Understanding UL 9540A, NFPA 855 and Large-Scale Fire Testing for Battery Energy Storage Systems" — ul.com
- NFPA (National Fire Protection Association)"NFPA 855: Standard for the Installation of Stationary Energy Storage Systems" (standard information page) — nfpa.org
- Estonian Centre for Standardisation and Accreditation (EVS)"EVS-EN IEC 62933-5-2:2020" (standard information page for IEC 62933-5-2:2020) — evs.ee
- U.S. Federal Register / FERCOrder No. 841, "Electric Storage Participation in Markets Operated by Regional Transmission Organizations and Independent System Operators" (83 FR 9580, 6 March 2018) — federalregister.gov
- U.S. Federal Register / FERCOrder No. 841-A (84 FR 23902, 23 May 2019) — federalregister.gov
- U.S. Federal Energy Regulatory Commission (FERC)"FERC Order No. 2222 Explainer" (updated September 2025; its footnote cites Order 841-A and the appeals-court decision) — ferc.gov
- Agency for Natural Resources and Energy (ANRE), Japan"The storage battery you think you know: why is deployment spreading, and what role does it play?" (Enekore feature, 8 October 2026, in Japanese) — enecho.meti.go.jp
- Organization for Cross-regional Coordination of Transmission Operators, Japan (OCCTO)"Long-Term Decarbonization Power Source Auction: Bidding Guidelines (bid year FY2025)" (in Japanese, 3 September 2025, PDF) — occto.or.jp
- Organization for Cross-regional Coordination of Transmission Operators, Japan (OCCTO)"Capacity Market: Long-Term Decarbonization Power Source Auction, Results (bid year FY2025)" (in Japanese, 13 May 2026, PDF) — occto.or.jp
- Organization for Cross-regional Coordination of Transmission Operators, Japan (OCCTO)Same, Annex: list of awarded resources (in Japanese, 13 May 2026, PDF) — occto.or.jp
- Agency for Natural Resources and Energy (ANRE), Japan"Long-Term Decarbonization Power Source Auction", working-group material 3 (in Japanese, 4 March 2026, PDF) — meti.go.jp
14. Claim-to-source audit
| Claim in the text | Basis | Type |
|---|---|---|
| ANRE (article of 8 October 2026): stationary storage divided into grid-side, renewables-co-located and behind-the-meter; grid-side as generally several container-type units on a large site; storing when there is a surplus and discharging when short to stabilize the grid | Agency for Natural Resources and Energy (ANRE), Japan Reference 12 https://www.enecho.meti.go.jp/about/special/johoteikyo/strage_battery_2026.html | Sourced |
| EIA: operating U.S. batteries of 43.6 GW at the end of 2025 and 8.3 GW added in the first half of 2026 for about 52 GW, a planned 54 GW over about two and a half years, Bellefield (online December 2025, 500 MW solar and 500 MW storage) and its planned doubling, and a 409 MW battery in Florida | U.S. Energy Information Administration (EIA) Reference 3 https://www.eia.gov/todayinenergy/detail.php?id=67925 | Sourced Not yet confirmed |
| CAISO: about 13,000 MW and about 47,300 MWh in December 2024 (stand-alone 5,800 MW, co-located 5,700 MW, hybrid storage about 1,500 MW), most large-scale storage being lithium-ion of 4 hours at most, intra-day arbitrage, about 84% of regulation provided by batteries in 2024, regulation avoiding deep cycling, and growth from about 500 MW in 2020 | CAISO Department of Market Monitoring Reference 4 https://www.caiso.com/documents/2024-special-report-on-battery-storage-may-29-2025.pdf | Sourced |
| PNNL: the definition of duration, definitions of SB, BOS, power equipment, C&C, system integration, EPC and grid integration, the AC-AC round-trip efficiency of LFP of 82.59%, installed cost of LFP and NMC (US$356 and 405/kWh at 100 MW, 10 h), LFP cycles by depth of discharge (2,400, 4,500, 8,000, 32,000 and 192,000; NMC 1,520 at 80%), the point that reported cycles come from accelerated tests, and that warranties limit use to one full-discharge-equivalent cycle a day | Pacific Northwest National Laboratory (PNNL) Reference 1 https://www.pnnl.gov/sites/default/files/media/file/ESGC%20Cost%20Performance%20Report%202022%20PNNL-33283.pdf | Sourced |
| NLR ATB 2025: costs based on LFP cells, 60 MW and 2 to 10 hours, the total-cost formula, cost per kWh falling and cost per kW rising with duration, 85% round-trip efficiency, a 15-year life, fixed O&M of 4% of capital cost (including augmentation), and capacity factors for one cycle a day (16.7% for 4 h, 8.3% for 2 h) | National Laboratory of the Rockies, NLR (formerly NREL) Reference 2 https://atb.nlr.gov/electricity/2025/utility-scale_battery_storage | Sourced |
| EPRI white paper (May 2024): the 97% fall in incident rate from 2018 to 2023, 27 of 30 incidents in 2018-2019 being in South Korea, SOC above 90%, root causes and failed components of the 26 analysed incidents (mostly BOS and controls; 3 incidents, 11%, attributed directly to cells), 72% within two years of commissioning, root causes identified for 36% of incidents, and the Victoria Big Battery coolant-leak case | Electric Power Research Institute (EPRI) Reference 5 https://restservice.epri.com/publicdownload/000000003002030360/0/Product | Sourced |
| UL Solutions: the large-scale fire testing in NFPA 855 2026 edition and Annex G.11, UL 9540 as the foundational standard, UL 9540A's sequential method (Edition 5) and large-scale fire test (Edition 6), Edition 6 taking effect 1 January 2027 (planned), and adoption of the 2026 edition taking time | UL Solutions Reference 6 https://www.ul.com/thecodeauthority/knowledge/understanding-UL-9540A-NFPA-855 | Sourced Not yet confirmed |
| NFPA information page: that NFPA 855 is an installation standard setting minimum requirements for mitigating ESS hazards, and that the current edition is 2026 with 2023 and 2020 before it | NFPA (National Fire Protection Association) Reference 7 https://www.nfpa.org/codes-and-standards/nfpa-855-standard-development/855 | Sourced |
| The title of IEC 62933-5-2:2020 (safety requirements for grid-integrated electrical energy storage systems, electrochemical-based) and its adoption as a European standard | Estonian Centre for Standardisation and Accreditation (EVS) Reference 8 https://www.evs.ee/en/evs-en-iec-62933-5-2-2020 | Sourced |
| FERC Order No. 841: issued 15 February 2018, published 6 March 2018 (83 FR 9580), effective 4 June 2018, the four requirements of the participation model, a minimum size not above 100 kW, buying at LMP, and moving aggregation of distributed resources to a separate proceeding (RM18-9) | U.S. Federal Register / FERC Reference 9 https://www.federalregister.gov/documents/2018/03/06/2018-03708/electric-storage-participation-in-markets-operated-by-regional-transmission-organizations-and | Sourced |
| Order No. 841-A: published 23 May 2019 (84 FR 23902), effective 21 August 2019 | U.S. Federal Register / FERC Reference 10 https://www.federalregister.gov/documents/2019/05/23/2019-10742/electric-storage-participation-in-markets-operated-by-regional-transmission-organizations-and | Sourced |
| FERC's explainer: Order 841-A and its being upheld on appeal (NARUC v. FERC, 964 F.3d 1177), and ERCOT being outside FERC's jurisdiction | U.S. Federal Energy Regulatory Commission (FERC) Reference 11 https://www.ferc.gov/ferc-order-no-2222-explainer-facilitating-participation-electricity-markets-distributed-energy | Sourced |
| Long-term decarbonization auction guidelines (bid year FY2025): battery requirements (30,000 kW or more, continuous 6 hours or more), third-party certification and fire-spread tests for lithium-ion batteries, JC-STAR level 1, and material required from manufacturers with past incidents | Organization for Cross-regional Coordination of Transmission Operators, Japan (OCCTO) Reference 13 https://www.occto.or.jp/assets/market-board/market/jitsujukyukanren/files/250903_boshuyoukou_long_2025.pdf | Sourced |
| Results (13 May 2026): capacity revenue for 20 years in principle, the 30% limit by cell-manufacturing country, the battery categories, the list of awarded resources, and the description of batteries as 1.251 million kW (46%) | Organization for Cross-regional Coordination of Transmission Operators, Japan (OCCTO) Reference 14 https://www.occto.or.jp/assets/various/capacity-market/jitsujukyukanren/2025_boshuyoukou_long/260513_longauction_youryouyakujokekka_kouhyou_ousatsu2025.pdf Organization for Cross-regional Coordination of Transmission Operators, Japan (OCCTO) Reference 15 https://www.occto.or.jp/assets/various/capacity-market/jitsujukyukanren/2025_boshuyoukou_long/260513_longauction_youryouyakujokekka_kouhyou_besshi_ousatsu2025.pdf | Sourced |
| ANRE document (4 March 2026): the outline of the scheme (running since fiscal 2023) and the draft of first-awarding for the fourth round (under discussion) | Agency for Natural Resources and Energy (ANRE), Japan Reference 16 https://www.meti.go.jp/shingikai/enecho/denryoku_gas/jisedai_kiban/system_review/pdf/112_03_00.pdf | Sourced Not yet confirmed |
| Section 3 calculations (400 MWh / 100 MW = 4 hours, 400 / 0.85 = about 470.6 MWh, 400 / 0.8259 = about 484.3 MWh, 47,300 / 13,000 = about 3.6 hours), section 5 calculations (full-discharge equivalents of 1,920, 3,150, 4,800, 9,600 and 9,600), and the sums of the annex list in section 8 (551,469 kW and 699,658 kW) | Our calculation. The 400 MWh plant is an example of how to read a rating, not the specification of any plant. The round-trip efficiencies are NLR (85%) and PNNL (82.59%) | Our calculation |
| The reading that most incidents lie outside the battery and that material and workmanship quality decide safety, the explanation of why deeper discharge speeds degradation (general understanding), the organization of the layers of standards (Fig. 5), and the way Table 1 is organized | Our summary and commentary based on published content. Not views expressed by the institutions or companies | Commentary |
| Operating capacity in Japan, the text of NFPA 855, causes of individual incidents, and implementation of Order 841 in each RTO/ISO | Could not be confirmed in published primary sources within the scope of this article, so not stated | Commentary |
| That Figs. 1 to 5 are explanatory drawings (Figs. 2 and 4 include our calculations) and that the hero image and Fig. 6 are AI-generated images | Our note | Commentary |
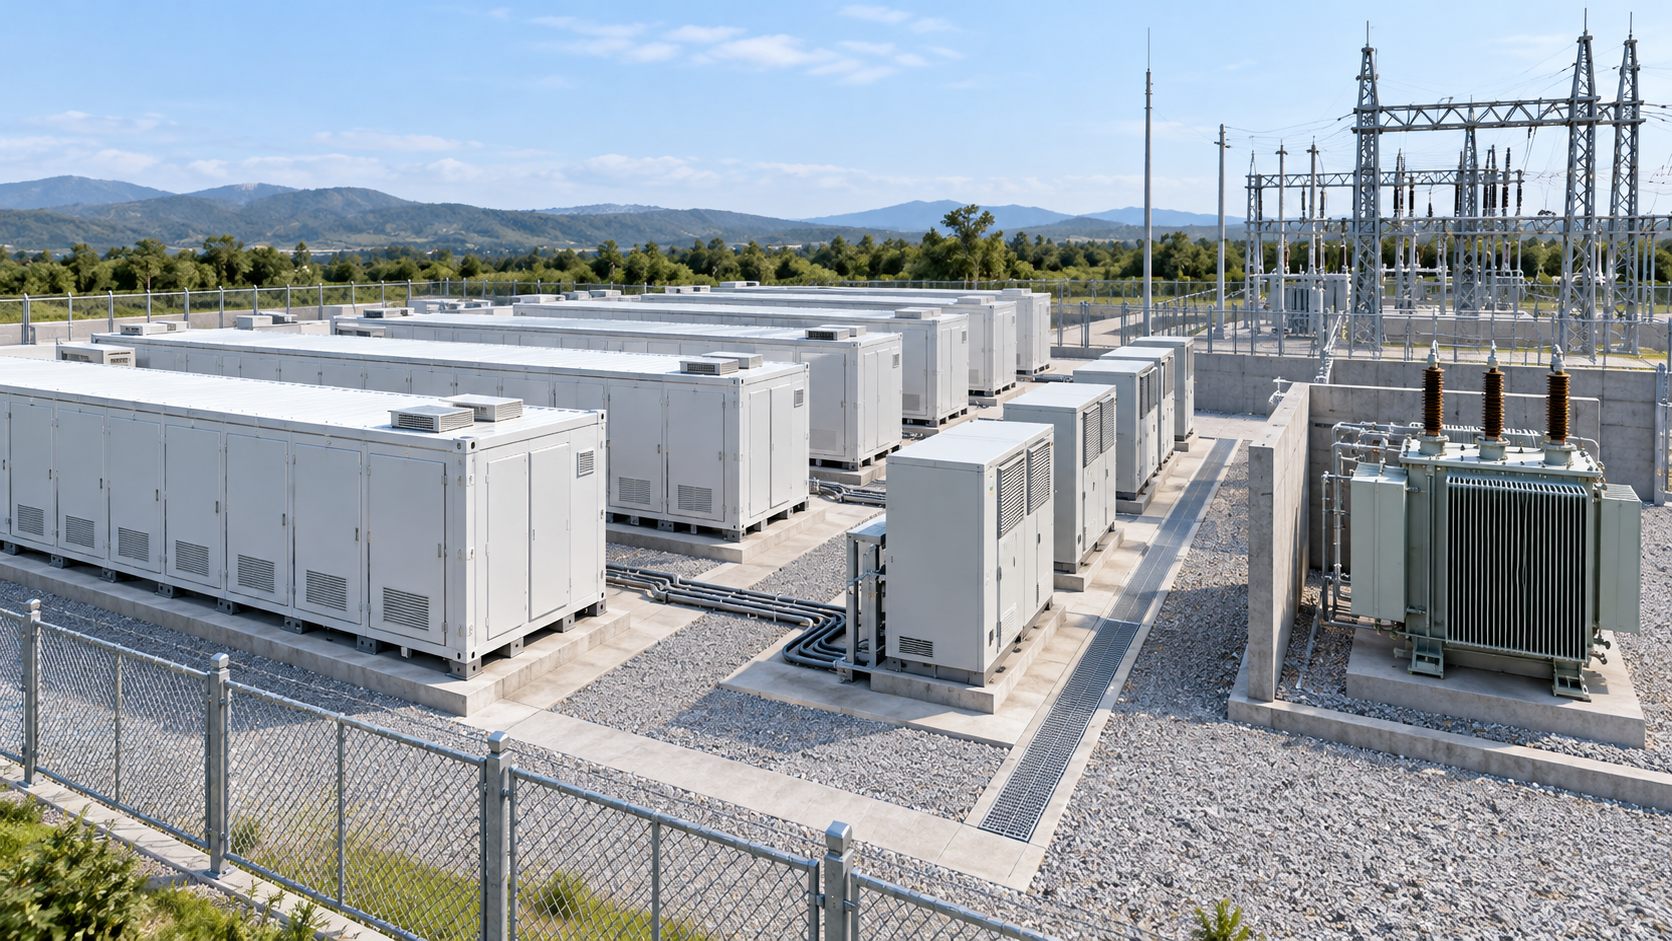
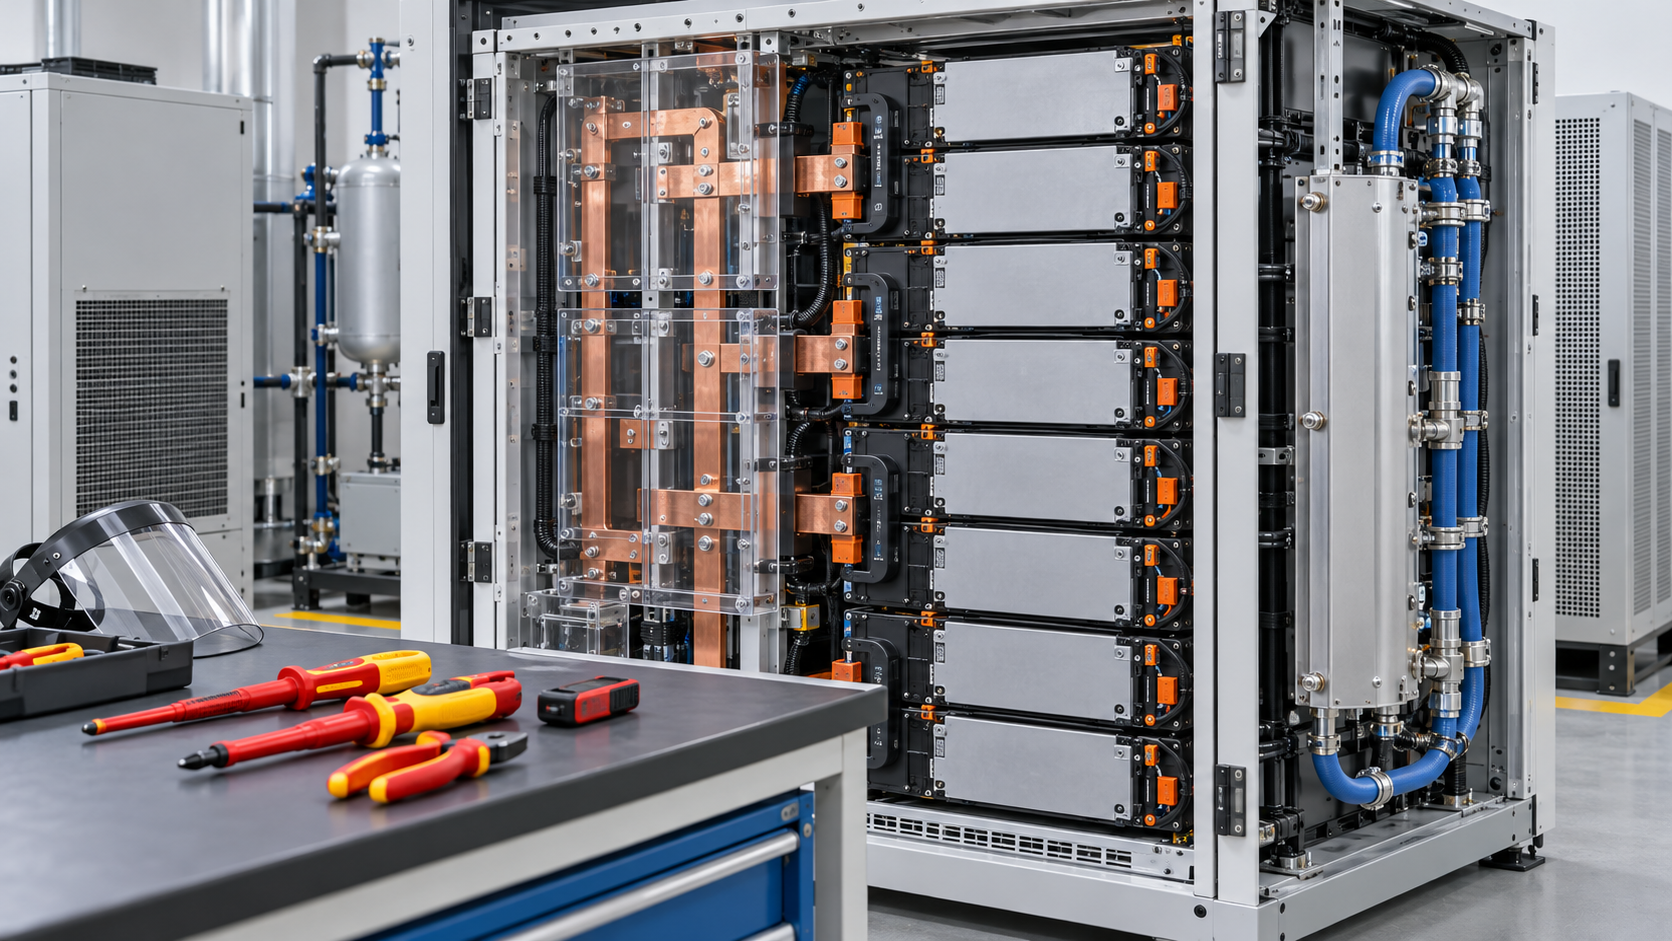
Last updated October 2026. Sources are limited to primary material (reports of U.S. national laboratories, EIA and EPRI, a report of CAISO's market monitoring department, documents of standards bodies and test organizations, FERC rules (Federal Register), and documents of Japan's Agency for Natural Resources and Energy and OCCTO). News reports were not used. No market-research estimates were used. Regulations were checked in October 2026. Readings about materials and structure are marked as commentary and kept separate from sourced fact. Operating capacity in Japan, the text of NFPA 855, the causes of individual incidents and the implementation of Order 841 in each RTO/ISO could not be confirmed in published primary sources and are therefore not stated. The calculations in this article are derived from the formulas and stated assumptions and are not specifications or forecasts for any particular plant. Figs. 1 to 5 are explanatory vector drawings (Figs. 2 and 4 include our calculations); the hero image and Fig. 6 are AI-generated images, and none of them shows a real facility, component or product.