TECHNOLOGY EXPLAINER
The Economics of Energy Storage
— Building and reading LCOS (levelized cost of storage) yourself
The "US$ per kWh" figures quoted for storage can mean a battery cell price, a pack price, the installed price of a whole system, or a levelized cost spread over a lifetime (LCOS). The same word "cost" can cover boundaries that differ enough to change the number several times over. This article builds the LCOS formula from scratch, tests a base case with every assumption written down, and then reads the published figures of NREL, PNNL, the U.S. Department of Energy (DOE) and the IEA for what each number actually covers. The effect of materials prices such as lithium is shown by calculation, not forecast.
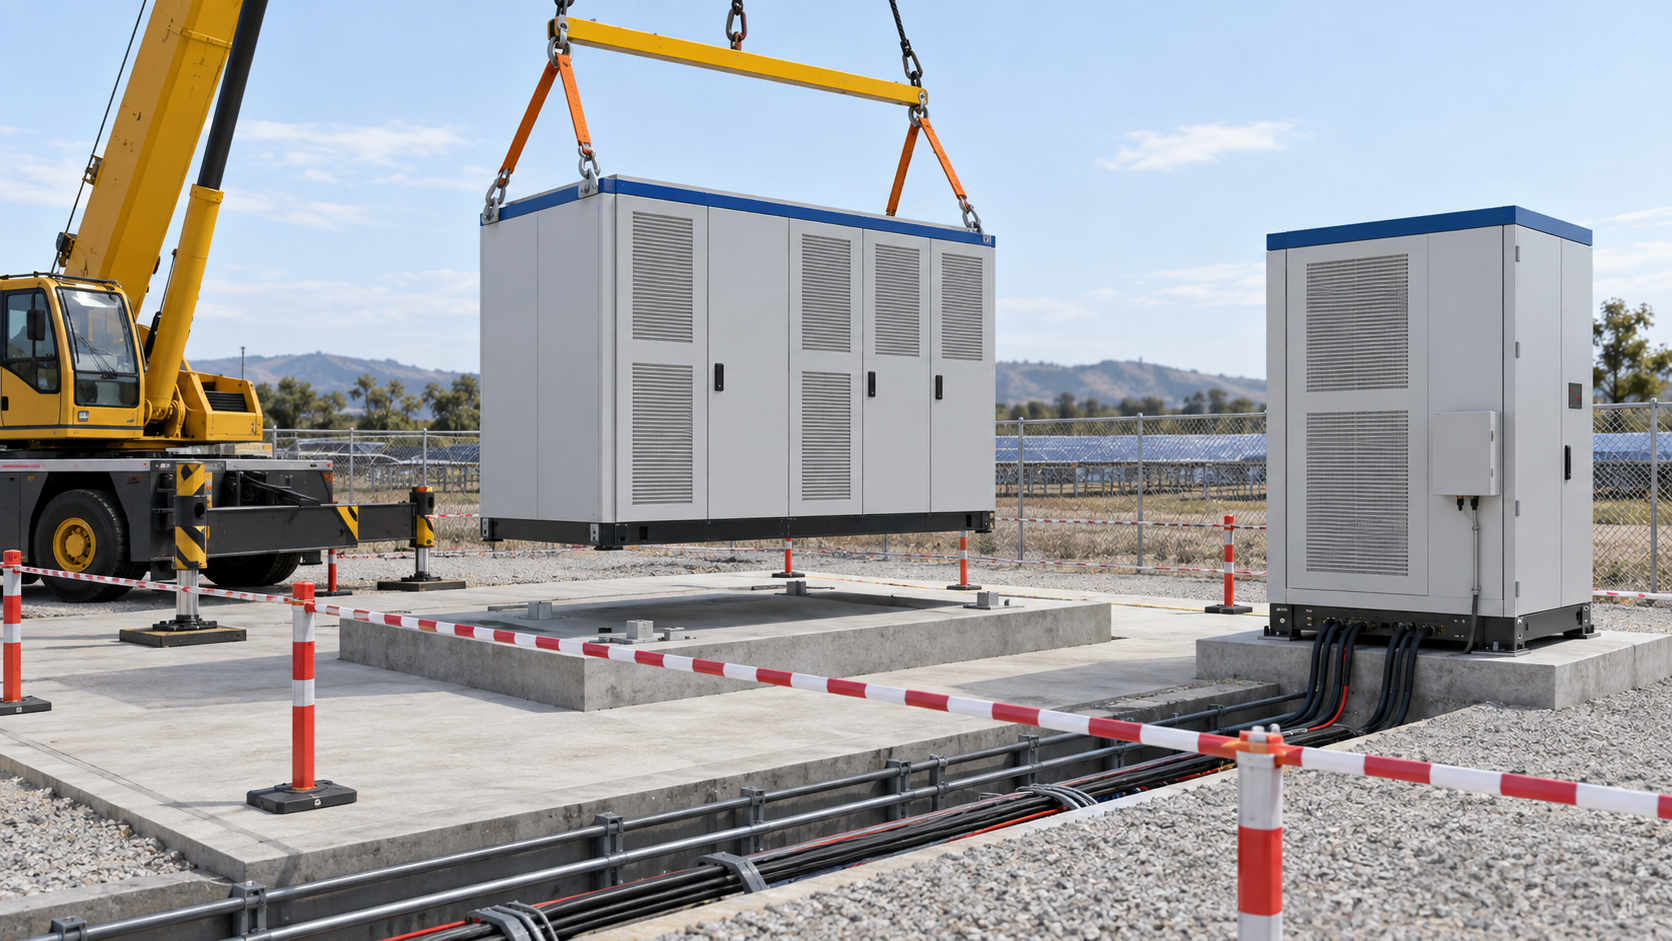
- The economics of storage in brief
- The LCOS formula: costs on top, discharged energy below
- The components: seven dials and how public sources treat them
- Our calculation 1: breakdown of the base case
- Same word, different boundary: is the charging cost in?
- Our calculation 2: sensitivity, which dial matters
- A materials engineer's view 1: life, cycling and ageing are materials work
- Reading published figures: cell, pack, system, year and scope
- Our calculation 3: duration, and capex times cycles
- Materials costs: what does the lithium price touch?
- A materials engineer's view 2: separate price from quantity
- Limits, and what we could not confirm
- How to read evaluations and standards
- Glossary
- References
- Claim-to-source audit
Sourced = stated in a published source (linked)
Our calculation = a value we computed from stated assumptions (every assumption is written out)
Not yet confirmed = a plan, target or outlook with no confirmed result
Our own readings of materials and design are marked Commentary.
We use no price forecasts. We use past prices and the results and assumptions agencies have published, and we show "what if the materials price moved by this much" as a calculation. Battery numbers are given with whether they refer to a cell, pack or system, and with the year and conditions.
This article explains how storage economics works; it is not advice on investment, procurement or business planning.
1. The economics of storage in brief
- What the number measures: LCOS (levelized cost of storage) divides the total cost of a storage plant over its life by the energy it discharges over the same period, giving a cost "per discharged kWh (or MWh)". PNNL (a U.S. national laboratory) describes LCOS as a cost per unit of discharge energy throughput (US$/kWh) that compares technologies on a more equal footing than installed cost per unit of rated energy Sourced [Ref. 2].
- There is no common definition of LCOS: Schmidt et al. (Joule, 2019) write that LCOS studies still lack a common definition; some neglect replacement or disposal costs and others exclude capacity degradation Sourced [Ref. 6]. In our calculation, for the same battery and the same assumptions, whether the charging energy cost is counted or not alone splits LCOS into 184 or 141 US$/MWh (Chapter 5).
- Use matters more than price: moving one input at a time from the base case, the largest swing came from cycles per day (321 US$/MWh at 0.5 a day, 116 at 2 a day), followed by charging price and capex Our calculation (Chapter 6). Materials prices act through a small part of capex (Chapter 10).
The cost of storage is set less by "what the battery costs" than by "for how many years, how many times a day, and at what efficiency you can use it fully". A battery maker's "US$/kWh" and the "US$/MWh (LCOS)" a project owner looks at are different numbers with different denominators. Material performance (life, cycling, efficiency) enters through that denominator and the life term.
Our explainer on hydrogen production cost builds the LCOH of electrolytic hydrogen by adding an annualized capital cost and the electricity cost and dividing by the hydrogen produced. The skeleton here is the same. Three things differ. The denominator is discharged electricity, not hydrogen; storage does not generate power but buys it, loses some, and returns it, so round-trip efficiency matters; and the counterpart of the utilization rate is cycles and depth of discharge, which is tied directly to degradation. We leave the hydrogen side (electrolyzer capex, stack replacement) to that explainer and do not repeat it.
2. The LCOS formula: costs on top, discharged energy below
LCOS is defined by bringing each year's costs and discharged energy to present value with a discount rate, then dividing the sum of the present value of costs by the sum of the present value of discharged energy. PNNL's documentation defines LCOS as the average price per kWh at which discharged energy must be sold to recover the total project revenue requirement Sourced [Ref. 3]. The revenue requirement includes installation, financing, operations and maintenance, taxes and depreciation, the cost of charging (with round-trip losses), and augmentation, replacement and major overhaul (ARMO) [Ref. 3]. The DOE's Storage Innovations 2030 document uses the formula from the ARPA-E DAYS program, written as "present value of annual costs divided by present value of annual discharged energy" Sourced [Ref. 5].
We use a simpler form that turns capital cost into a fixed annual amount with the capital recovery factor (CRF).
LCOS = [ CRF × capex + fixed O&M + variable O&M × discharged energy + charging price ÷ round-trip efficiency × discharged energy ] ÷ annual discharged energy
• CRF = r(1+r)n ÷ ((1+r)n − 1), with r the discount rate and n the life in years. This is the same form as in the hydrogen explainer.
• Annual discharged energy (per kW of rated power) = duration (h) × cycles per year × depth of discharge. Degradation can enter either as "augmentation and replacement" inside fixed O&M or as a decline in discharged energy (Chapter 7).
• Round-trip efficiency is the ratio of energy discharged to energy used to charge (energy charged = energy discharged ÷ round-trip efficiency).
First, what this simplified form leaves out: taxes, depreciation, subsidies (such as the investment tax credit), financing structure (equity versus debt), inflation, decommissioning, residual value and revenue. PNNL's calculation includes taxes, depreciation, the investment tax credit, property tax and insurance, and its published estimates exclude decommissioning Sourced [Refs. 2 and 3]. Values from the simplified form are not on the same scale as those public calculations.
3. The components: seven dials and how public sources treat them
The main dials of LCOS are capex, round-trip efficiency, cycles, degradation, discount rate, charging price and operating and maintenance cost. The table summarizes how public sources treat each.
| Dial | What it represents | How public sources treat it |
|---|---|---|
| Capex | Up-front cost of the installed plant: battery cabinets, inverter, site, electrical equipment, labor, permitting, tax and profit | NREL (2025) puts the 2024 capex of a 4-hour utility-scale lithium-ion system at 334 US$/kWh (2024 dollars). It is a build-up of ten items (cabinets, inverter, structural and electrical balance of system, labor, permitting, sales tax, contingency, developer overhead, profit), and the 2024 value reflects a modeled market price for U.S.-average installations in Q1 2024 [Ref. 1] |
| Round-trip efficiency | Share of charged energy returned on discharge | NREL uses 85%, defined at system level including losses from cooling and control equipment [Ref. 1]. PNNL assumes one-way efficiencies of 98% each for inverter, rectifier and transformer [Ref. 4] |
| Cycles | How many times a year the rated energy is cycled | NREL's variable and fixed O&M values assume one cycle a day, and NREL adds that at much higher cycling the fixed O&M might not be enough to offset degradation [Ref. 1]. PNNL derives annual discharged energy from rest times and an annual cycle limit [Ref. 3] |
| Degradation | Loss of capacity, power and rising resistance | NREL puts augmentation and replacement inside fixed O&M and assumes rated capacity is held through life (fixed O&M is 4% of the US$/kW capital cost of a 4-hour system) [Ref. 1]. PNNL enters augmentation, replacement and major overhaul (ARMO) separately [Refs. 2 and 3]. DOE sets the life of replaceable parts as the smaller of calendar life and cycle life (divided by depth of discharge × 365) [Ref. 5] |
| Discount rate | Return required on the investment; the higher it is, the heavier the up-front capex | PNNL's calculation: nominal weighted average cost of capital 9.47% (real 6.49%), tax rate 25.7%, analysis period 20 years [Ref. 4]. DOE: nominal 7.6%, inflation 2.0%, project life 25 years [Ref. 5] |
| Charging price | Purchase price of the electricity used to charge | PNNL uses 0.03 US$/kWh [Ref. 4]. DOE leaves charging cost out of LCOS and counts only the round-trip loss, at 0.025 US$/kWh [Ref. 5] |
| Operations and maintenance (O&M) | Fixed cost (per kW-year) and variable cost (per energy discharged) | NREL sets variable O&M at 0 and fixed O&M at 4% of capex per year (including augmentation) and chooses a life of 15 years, which it describes as the low end of published values and a conservative choice [Ref. 1]. PNNL escalates fixed O&M at 2% a year (real) [Ref. 4] |
All Sourced (NREL, PNNL and DOE publications). These are the agencies' assumptions, not the results of any particular project.
NREL stresses that a capex quoted in US$/kWh must always state the duration. A 4-hour system can discharge at rated power for four hours, and US$/kW converts from US$/kWh by multiplying by 4 (for example, 300 US$/kWh is 1,200 US$/kW) [Ref. 1]. Because some costs scale with power (inverters) and others with energy (batteries), US$/kWh falls and US$/kW rises as duration grows [Ref. 1].
4. Our calculation 1: breakdown of the base case
The base case takes NREL's 2025 values (capex, fixed O&M, life, round-trip efficiency) as its foundation and adds our own assumptions for what NREL does not give (discount rate, charging price). Every assumption is in the table. It does not represent any real project, manufacturer or market Our calculation.
| Item | Base value | Basis |
|---|---|---|
| Subject | 4-hour utility-scale lithium-ion battery system (per kW of rated power) | Matches NREL's scope [Ref. 1]; rated energy 4 kWh |
| Capex | 334 US$/kWh = 1,336 US$/kW | NREL (2025), value for 2024 (2024 dollars, installed) [Ref. 1] |
| Fixed O&M | 4% of capex (US$/kW) per year = 53.4 US$/kW-year | NREL's value; includes augmentation and replacement, rated capacity held through life [Ref. 1] |
| Variable O&M | 0 | NREL's value [Ref. 1] |
| Life | 15 years | NREL's value (chosen conservatively) [Ref. 1] |
| Round-trip efficiency | 85% (system) | NREL's value [Ref. 1] |
| Cycles | One a day (365 a year), 100% depth of discharge | The assumption behind NREL's values. We took availability as 100% (no outages or downtime) |
| Discount rate | 7% (real, single value) | Our assumption. DOE uses 7.6% nominal with 2.0% inflation (about 5.6% real) and PNNL 6.49% real [Refs. 4 and 5] |
| Charging price | 40 US$/MWh | Our assumption. Constant regardless of time of day. PNNL uses 30 and DOE's loss calculation 25 US$/MWh [Refs. 4 and 5] |
| Left out | Taxes, subsidies, financing structure, inflation, decommissioning, residual value, revenue | Simplified form (Chapter 2) |
The figures in the "Basis" column are Sourced (the agencies' assumptions). The combination of base values is the premise of our calculation Our calculation.
With these assumptions, the CRF (r = 7%, n = 15 years) is 0.1098 and a 1 kW plant discharges 4 h × 365 = 1,460 kWh a year Our calculation. The terms work out as follows.
| Term | Calculation | US$/MWh | Share |
|---|---|---|---|
| Annualized capital | 0.1098 × 1,336 ÷ 1.460 MWh | 100.5 | 55% |
| Fixed O&M | 53.4 ÷ 1.460 MWh | 36.6 | 20% |
| Charging energy | 40 ÷ 0.85 | 47.1 | 26% |
| Total (LCOS, definition A) | — | 184.1 | 100% |
All Our calculation. Shares are rounded and may not sum to 100%.
The base-case LCOS is about 184 US$/MWh (0.18 US$/kWh): annualized capital 55%, fixed O&M 20% and charging energy 26% Our calculation. Even if electricity were free, about 137 US$/MWh would remain. A battery does not sell electricity; it moves electricity in time, so the charging price is only one part of LCOS.
5. Same word, different boundary: is the charging cost in?
The LCOS so far counts the full purchase cost of charging energy (definition A). PNNL's calculation workbook reports LCOS in two outputs: one including the cost to charge and round-trip losses, and one including round-trip losses only Sourced [Ref. 4]. The DOE's Storage Innovations 2030 document takes the position that "the cost of charging should not be considered" in LCOS because it belongs to the cost of the generator supplying the energy, but that electricity lost to imperfect round-trip efficiency is a cost of storage and should be counted; it counts only the loss, at an electricity price of 0.025 US$/kWh Sourced [Ref. 5].
In our base case we compare the two boundaries (definition B, loss only: 25 ÷ 0.85 − 25 = 4.4 US$/MWh) Our calculation.
With the same battery and the same assumptions, LCOS is either 184 US$/MWh (A) or 141 US$/MWh (B). The difference of about 43 US$/MWh comes entirely from how charging energy is treated, not from battery performance Our calculation. The DOE's 2030 target of 0.05 US$/kWh (50 US$/MWh) for storage of 10 hours or longer aims at a 90% cost reduction Not yet confirmed [Ref. 5], but it is a value excluding charging cost and resting on DOE-specific premises such as a 25-year life, 80% depth of discharge and 7.6% nominal discount rate. We do not put it beside our base-case figures to say "how many times away", because the scales differ.
1. Is the charging electricity cost in? (all of it, only the loss, or none).
2. Are taxes, subsidies and financing in? (PNNL includes them; the calculation in DOE's document uses a single real discount rate).
3. Life, and how augmentation and replacement are treated (15, 20 or 25 years? Is replacement cost included?).
4. Duration, cycles and depth of discharge (once a day, or how many times?).
An LCOS that does not state these four cannot be compared with other numbers.
6. Our calculation 2: sensitivity, which dial matters
We move one input only from the base case and see how LCOS (definition A) changes. The ranges come from values in the public sources of Chapter 3 and from our own judgement. Rankings depend on the ranges chosen, so look less at the order than at which inputs matter by an order of magnitude Our calculation.
| Input | Base | Favorable value | LCOS (US$/MWh) | Unfavorable value | LCOS (US$/MWh) |
|---|---|---|---|---|---|
| Cycles per day | 1 | 2 | 116 | 0.5 | 321 |
| Charging price | 40 US$/MWh | 0 | 137 | 80 | 231 |
| Capex (4 h) | 334 US$/kWh | 234 | 143 | 434 | 225 |
| Life | 15 years | 20 years | 170 | 10 years | 214 |
| Discount rate (real) | 7% | 4% | 166 | 10% | 204 |
| Fixed O&M (of capex per year) | 4% | 2% | 166 | 6% | 202 |
| Round-trip efficiency | 85% | 90% | 182 | 80% | 187 |
All Our calculation. The base case is 184 US$/MWh. One input is changed at a time; the rest stay at base values.
Four things stand out Our calculation.
- The biggest lever is how often it is used. Twice a day gives 116 and half a day 321 US$/MWh, a factor of about 2.8. Annualized capital and fixed O&M are costs incurred whether or not the plant works, so they thin out per MWh as discharged energy grows.
- Charging price is only 26% of the total. Moving it from zero to 80 US$/MWh changes LCOS by 94 US$/MWh. Storage earns from the spread between charging and discharging prices, so charging price alone says nothing about profitability (we do not model revenue).
- Round-trip efficiency matters less than expected. Moving it from 80% to 90% shifts LCOS by only 5.6 US$/MWh, because the loss only scales with the charging cost. But efficiency also ties to heat (cooling), and the knock-on effect of poor efficiency on life and capex is not in this calculation.
- Capex and life matter at the same scale. A 10% fall in capex lowers LCOS by about 14 US$/MWh (−7%); extending life from 15 to 20 years lowers it by about 14 US$/MWh (−8%). A materials improvement that adds five years of life is worth about the same as cutting capex by 10%.
Even at 2 cycles a day, our calculation does not change fixed O&M (4%) or life (15 years). NREL says its fixed O&M value assumes one cycle a day and might not offset degradation at much higher cycling [Ref. 1]. In practice, more cycling speeds up degradation and worsens life and replacement cost. The 116 US$/MWh at two cycles a day is a favorable estimate that leaves out the worse degradation, and the real value could be higher.
7. A materials engineer's view 1: life, cycling and ageing are materials work
There are two ways to put degradation into an LCOS calculation.
- (a) As augmentation and replacement cost. NREL's approach: include it in the 4% fixed O&M and assume rated capacity is held through life [Ref. 1]. Discharged energy (the denominator) stays constant.
- (b) As a decline in capacity. Discharged energy shrinks year by year, with no augmentation.
As a trial of (b), we assumed fixed O&M of 1.5% (simple maintenance only) and capacity falling linearly from 100% to 70% over 15 years (85% on average). LCOS (definition A) comes to about 181 US$/MWh, close to the 184 US$/MWh of (a) Our calculation (a rough estimate that divides annualized capital by average discharged energy and ignores discounting of energy). That the two treatments came out close is a coincidence of the values chosen, not a general relationship.
Translated into materials terms (Commentary):
- Life and capacity retention go straight into the denominator and the life term. Extending life from 10 to 15 years lowers LCOS from about 214 to 184 US$/MWh, roughly 14% Our calculation. Suppressing structural degradation of the cathode, electrolyte decomposition and SEI growth on the anode (see our SEI explainer) is the direct route to lower LCOS.
- Degradation per cycle depends on how the cell is used (number of cycles, depth of discharge, temperature, charge rate). A life figure always needs the question "how many cycles, how deep, at what temperature" (see our explainer on battery evaluation and degradation).
- Round-trip efficiency is set by materials polarization (electrode resistance, ion diffusion, interfacial resistance). Poor efficiency means more heat, which feeds back into cooling equipment and the speed of ageing.
DOE's document sets the life of replaceable parts as the smaller of calendar life and "cycle life divided by (depth of discharge × 365)" [Ref. 5]. In duties with heavy cycling, cycle life rather than calendar life sets the life, and that changes what is asked of the materials.
8. Reading published figures: cell, pack, system, year and scope
The public "storage cost" numbers that get quoted differ from source to source in what they cover (cell, pack, system, LCOS), which year, and what range. The table organizes what we confirmed.
| Source | What it covers (boundary) | Year / basis | What we confirmed | Cautions for readers |
|---|---|---|---|---|
| IEA, Global EV Outlook 2025 and 2026 [Refs. 7 and 8] | Battery pack price (volume-weighted across EV and storage) | 2024, 2025 | Pack prices fell 20% in 2024 (the largest drop since 2017) and 8% on average in 2025. LFP packs were almost 30% cheaper per kWh than NMC in 2024 | Not a system capex for grid storage. The IEA's note says the pack price index is IEA analysis based on BloombergNEF survey data. Values differ by application, region and chemistry |
| NREL (2025) [Ref. 1] | Installed capex of a 4-hour utility-scale lithium-ion system | 2024 (U.S. average, 2024 dollars) | 334 US$/kWh, from a bottom-up model. NREL itself says it is higher than many other recent estimates | Depends on duration (4 hours). It is system capex, not a cell price. We do not use the 2035 and 2050 "projections" here |
| PNNL, Energy Storage Cost and Performance Database v2024 [Refs. 2, 3 and 4] | LCOS by technology (output of a calculation) | 2023 values, 20-year analysis period | LCOS is output two ways: including charging cost and round-trip losses, and including losses only. It includes taxes, the investment tax credit and ARMO, and excludes decommissioning | The result changes with workbook inputs (capex, efficiency and so on); there is no single value |
| DOE, Storage Innovations 2030 methodology (2023) [Ref. 5] | LCOS (excluding charging cost) and a 2030 target | Target: 2030, 10 hours or longer | The Long-Duration Storage Shot target is to cut grid-scale storage cost 90% to an LCOS of 0.05 US$/kWh (10 hours or longer) | A target, not a result. Rests on DOE-specific premises: 25-year life, 80% depth of discharge, 7.6% nominal discount rate |
| Schmidt et al., Joule (2019) [Ref. 6] | LCOS estimates for 9 technologies in 12 applications, with capex outlook | 2015 to 2050 | Points out that LCOS still has no common definition and that studies differ in which costs and performance items they include | The paper's values include future outlooks. We use only its discussion of definitions, not its values |
All Sourced (key points of each agency's publications). Do not set values with different boundaries side by side and rank them.
Three rules of reading follow from the table.
- Do not mix "pack" and "system". A pack is cells plus battery management, thermal management and enclosure (what NREL calls the "cabinet"); a system adds inverter, site, electrical equipment, labor, permitting, tax and profit [Ref. 1]. A fall in pack prices does not necessarily mean the same fall in system capex.
- Match the year and the currency. NREL uses 2024 dollars, PNNL values for 2023, and the IEA calendar years.
- Separate "present" from "target or outlook". The DOE's 0.05 US$/kWh is a target and NREL's 2035 and 2050 numbers are projections. Do not put them in the same column as results.
9. Our calculation 3: duration, and capex times cycles
(1) Changing the duration
NREL splits the 2024 system capex into a part that scales with energy and a part that scales with power, with total cost (US$/kW) = energy cost (US$/kWh) × duration + power cost (US$/kW). Fitting a straight line across durations of one to ten hours gives an energy cost of 241 US$/kWh and a power cost of 372 US$/kW (after an adjustment so that four hours equals 334 US$/kWh) Sourced [Ref. 1]. We overlay the rest of the base-case assumptions to get LCOS by duration, with fixed O&M held at 4% of capex per year, life at 15 years and one full cycle a day Our calculation.
| Duration | Capex (US$/kWh) = 241 + 372 ÷ duration | LCOS, definition A (US$/MWh) | LCOS, definition B (US$/MWh) |
|---|---|---|---|
| 2 h | 427 | 222 | 180 |
| 4 h | 334 | 184 | 141 |
| 6 h | 303 | 171 | 129 |
| 8 h | 288 | 165 | 122 |
| 10 h | 278 | 161 | 119 |
All Our calculation. The capex formula is NREL's fit [Ref. 1]. Definition A includes charging at 40 US$/MWh; definition B counts the round-trip loss only (25 US$/MWh).
LCOS falls as duration rises, but even at 10 hours it is 119 US$/MWh under definition B. Although the scales differ from the DOE's 0.05 US$/kWh (50 US$/MWh) target, the gap is large. This table is a simple extrapolation that keeps lithium-ion price structure at longer duration; whether a 10-hour lithium-ion plant could run with the same life, cycling and degradation is a separate question we do not judge. Long-duration approaches (iron-air, zinc and others) are covered in our explainer on long-duration storage.
(2) Capex and cycles together
| Capex (4 h) \ cycles per day | 0.5 | 1 | 2 |
|---|---|---|---|
| 234 US$/kWh | 239 | 143 | 95 |
| 334 US$/kWh (base) | 321 | 184 | 116 |
| 434 US$/kWh | 403 | 225 | 136 |
All Our calculation (LCOS definition A, US$/MWh). Everything else at base values. The 2-a-day column is a favorable estimate that leaves out worse degradation (limit in Chapter 6).
Even at a capex of 434 US$/kWh, two cycles a day gives 136 US$/MWh, while at a capex of 234 US$/kWh half a cycle a day gives 239 US$/MWh Our calculation. Whether the plant can work every day matters more to LCOS than whether it is cheap. This is the same structure as the utilization rate in the hydrogen explainer.
10. Materials costs: what does the lithium price touch?
Materials prices enter system capex through the cost of cells. We use no price forecasts; we show past public prices and a sensitivity computed from them.
(1) Materials price swings described by public agencies
- The U.S. Geological Survey (USGS) reports the U.S. annual average price (real) of battery-grade lithium carbonate as 11,700 US$/tonne in 2021, 63,700 in 2022, 39,000 in 2023, 11,800 in 2024 and 9,000 in 2025 (estimate). It says the 2025 annual average was 31% below 2024, that fears of oversupply kept prices low in the first half of 2025, and that growth in EV sales in China and Europe and in demand for battery energy storage systems contributed to price increases in the second half Sourced [Ref. 9].
- The IEA says lithium prices fell about 20% in 2024 and battery pack prices fell 20% (low critical-mineral prices and competition) [Ref. 7]. The 2026 edition says average battery prices fell 8% in 2025, that lithium and cobalt prices rose over the year, and that lithium prices at the start of 2026 were more than twice those of a year earlier but still about 70% below the 2022 peak. It adds that if the rise continues it could put upward pressure on battery prices Sourced [Ref. 8].
So the annual average lithium price moved across a range of about seven times (9,000 to 63,700 US$/t) between 2021 and 2025 (estimate) Our calculation (63,700 ÷ 9,000 = 7.1).
(2) How much lithium is in one cell-kWh? (our calculation)
We compute from stoichiometry how much a lithium price swing touches capex Our calculation.
• Cathode material: lithium iron phosphate (LiFePO4), specific capacity 150 mAh/g, mean voltage 3.2 V (our assumption; real values vary with material and design). The cathode material needed per cell-kWh is 1,000 Wh ÷ (0.15 Ah/g × 3.2 V) = about 2.08 kg.
• Molar mass of LiFePO4 157.76 g/mol, atomic mass of Li 6.94, so lithium is 4.40% by mass, giving 0.0916 kg of lithium in 2.08 kg.
• Converted to lithium carbonate (Li2CO3, 73.89 g/mol): 5.32 kg per kg of Li, so 0.49 kg of lithium carbonate per cell-kWh.
• Excess charge, refining and processing losses and other materials (such as LiPF6 in the electrolyte) are not included. Assuming 1.2 kg of electrolyte per kWh and 12 wt% LiPF6, the lithium in the electrolyte is about 0.035 kg of lithium-carbonate equivalent per kWh, about 7% of the cathode's.
| Year | Annual average lithium carbonate price (US$/t) | Lithium cost per cell-kWh (US$) | Share of the 334 US$/kWh system capex |
|---|---|---|---|
| 2021 | 11,700 | 5.7 | 1.7% |
| 2022 | 63,700 | 31.1 | 9.3% |
| 2023 | 39,000 | 19.0 | 5.7% |
| 2024 | 11,800 | 5.8 | 1.7% |
| 2025 (estimate) | 9,000 | 4.4 | 1.3% |
Prices are Sourced (USGS [Ref. 9]). The other columns are Our calculation. Shares are a rough estimate against NREL's 2024 system capex (334 US$/kWh, 2024 dollars), without adjusting for the dollar year.
Between 2022 and 2025 (estimate), the lithium content of a cell moves by about 26.7 US$/kWh. If that were passed through to system capex one for one, the base-case LCOS would move by about 11 US$/MWh (about 6%) Our calculation (capex 334 to 361 US$/kWh). Real battery selling prices are not set by the lithium price alone; they depend on inventory, long-term contracts, manufacturing capacity, competition and tariffs. The IEA also writes that long-term contracts and vertical integration can temper the effect of price rises [Ref. 8]. Our calculation is a sensitivity to "what if the materials price moved", not a forecast of actual prices.
For NMC811 (LiNi0.8Mn0.1Co0.1O2) with an assumed specific capacity of 200 mAh/g and mean voltage of 3.7 V (our assumption), one cell-kWh needs about 1.35 kg of cathode material, about 0.096 kg of lithium and about 0.51 kg of lithium-carbonate equivalent Our calculation. That is almost the same as LFP's 0.49 kg. Exposure to the lithium price per kWh does not differ much between the two chemistries. The difference lies in nickel and cobalt prices and in the amount of cathode material per unit of capacity. The IEA says LFP packs are about 30% cheaper per kWh than NMC [Ref. 7], and this gap can be read as coming mainly from costs other than lithium (Commentary).
11. A materials engineer's view 2: separate price from quantity
The lithium price swung across about a sevenfold range between 2021 and 2025. Yet even at the 2022 peak the lithium in a cell is only about 9% of system capex (our calculation). Materials price swings do not move LCOS very much.
The quantity of material, on the other hand, is a design matter. The cathode needed per cell-kWh follows from specific capacity and voltage; the higher they are, the less material gives the same energy. But the conclusion of Chapter 6 was that reducing that quantity does not change the big terms of LCOS (annualized capital, cycles, life). For LCOS, the real value of a material lies less in being cheap than in lasting longer, being fully usable every day and having small losses (Commentary).
That is a statement about ordinary conditions. When lithium prices stay high or supply is interrupted, other capex terms (tariffs, transport, whether long-term contracts exist) also move, so the effect of materials prices can be larger or smaller than a simple one-for-one pass-through (Commentary). Supply and procurement risk is covered in our explainer on resources and sourcing of battery materials. Sodium-ion batteries, which use no lithium, are treated in our sodium-ion explainer as an option for reducing exposure to the lithium price (the IEA also writes that high lithium prices could strengthen the momentum behind sodium-ion batteries [Ref. 8]).
Electrolyte materials (solvent, lithium salt, additives) weigh less than the cathode per kWh, and their lithium is about 7% of the cathode's (our calculation), but they strongly affect life and cycling performance, so their effect on cost should be judged by their contribution to life rather than by their price (see our explainer on electrolytes and separators).
12. Limits, and what we could not confirm
- Our formula is a simplified form. It leaves out taxes, subsidies, financing structure, inflation, decommissioning and revenue. It is not on the same scale as the public LCOS calculations (PNNL, DOE).
- The discount rate (7%) and charging price (40 US$/MWh) in the base case are our assumptions, not values for any specific market.
- The treatment of degradation is coarse. We use NREL's approach (augmentation and replacement inside fixed O&M) as it is and do not include the worse degradation that comes with more cycling (Chapter 6).
- We do not quote PNNL's LCOS values or the IEA's specific pack prices in US$/kWh. PNNL's is a workbook whose result depends on inputs, and the IEA's price values sit in charts, from which we could read only percentage changes in the text.
- NREL's 334 US$/kWh is a value NREL itself says is higher than many other recent estimates, so it may be higher than recent actual bid prices or prices of projects abroad. It reflects U.S. installations in Q1 2024 and, per NREL's note, does not include tariff changes since then [Ref. 1].
- We do not cover the revenue side (arbitrage, capacity payments, frequency regulation). LCOS is a cost metric; profitability, which compares it with revenue, is a separate matter.
- The materials calculation (Chapter 10) uses ideal stoichiometry; the cathode's specific capacity and voltage and lithium utilization are assumptions. Pass-through to battery selling prices is a one-for-one sensitivity, not a statement of the real relationship.
- We use no price forecasts. NREL's 2035 and 2050 outlook, the 2030 and 2050 estimates of Schmidt et al. and the DOE's 2030 target are not in our values (the target is mentioned only, as Not yet confirmed).
- LCOS is the total life-cycle cost divided by the energy discharged, and there is still no common definition Sourced
- For the same battery, counting or not counting the charging energy gives 184 or 141 US$/MWh Our calculation
- The biggest lever is how many times a day it is used (321 US$/MWh at 0.5, 116 at 2), then charging price and capex Our calculation
- Five more years of life is worth about the same as a 10% cut in capex Our calculation
- Cell, pack, system and LCOS are numbers with different boundaries; NREL's 334 US$/kWh is capex of a 4-hour system Sourced
- The lithium price change from 2022 to 2025 is about 8% of system capex, with an effect of about 11 US$/MWh (about 6%) on LCOS (a one-for-one sensitivity) Our calculation
13. How to read evaluations and standards
Before comparing which number is larger, align the basis of comparison in the following order. This is an editorial reading checklist, not a set of test conditions or acceptance limits prescribed by a standard.
- 1. What was measured?
- capital cost, LCOS, utilisation and replacement cost. Check the units and whether the result describes a material, component or complete system.
- 2. Under which conditions?
- currency and year, discount rate, lifetime, charging electricity, cycles and residual value. Treat results under different conditions as separate results before comparing them.
- 3. The comparison trap
- Do not confuse installed cost per kWh with LCOS per kWh delivered.
- 4. What does the standard cover?
- Check the identifier, title, edition and scope in the issuing body’s material. Distinguish test methods, safety, interoperability and management requirements. Naming a standard alone does not establish that a test, conformity assessment or certification has been completed.
Keep a comparison note containing the object, units, conditions, sample count and variation, comparator, standard edition and unresolved points. Do not invent numerical conditions or acceptance limits from a public abstract of a standard.
14. Glossary
- LCOS
- Levelized cost of storage. Total life-cycle cost divided by energy discharged. There is still no common definition.
- CRF (capital recovery factor)
- A factor that turns capex into a fixed annual amount given a discount rate and life: r(1+r)n ÷ ((1+r)n − 1).
- Round-trip efficiency
- Energy returned on discharge divided by energy used to charge. The value differs depending on whether the whole system (cooling and controls included) or the DC side is meant.
- Depth of discharge (DoD)
- The share of rated capacity used in one discharge.
- ARMO
- Augmentation, replacement and major overhaul. A term in PNNL's calculation.
- Fixed and variable O&M
- Operating and maintenance costs. Fixed is per kW of power per year; variable is per unit of energy discharged.
- Calendar life
- Life set by the ageing that proceeds with time even when the cell is not used.
- Cycle life
- Life set by the number of charge-discharge cycles. Read it together with its conditions (depth of discharge, rate, temperature, end-point capacity retention).
- Duration
- How long the plant can keep discharging at rated power. For 4 hours, rated energy is rated power times 4 hours.
- MMP and MSP
- NREL terms: Modeled Market Price and Minimum Sustainable Price (the lowest price at which a business stays solvent).
- LCE
- Lithium carbonate equivalent. Lithium quantity expressed as the mass of lithium carbonate.
- LCOH
- Levelized cost of hydrogen. Covered in our explainer on hydrogen production cost.
15. References
- NREL (now the National Laboratory of the Rockies) Cole, Ramasamy and Turan, "Cost Projections for Utility-Scale Battery Storage: 2025 Update", NREL/TP-6A40-93281, June 2025 (DOI 10.2172/2583471) — https://www.osti.gov/biblio/2583471
- PNNL "Energy Storage Cost and Performance Database: LCOS Estimates" (database v2024, 2023 values) — https://www.pnnl.gov/projects/esgc-cost-performance/lcos-estimates
- PNNL "Energy Storage Cost and Performance Assessment: LCOS Workbook v.2024 Documentation", April 2024 (PDF) — https://www.pnnl.gov/sites/default/files/media/file/ESGC_LCOS_Workbook_v2024_Documentation.pdf
- PNNL "ESGC LCOS Workbook v2024" (calculation workbook; assumptions sheet checked) — https://www.pnnl.gov/sites/default/files/media/file/ESGC_LCOS_Workbook_v2024.xlsx
- U.S. Department of Energy (DOE) "Technology Strategy Assessment Methodology: Storage Innovations 2030 Technical Process", DOE/OE-0030, July 2023 (PDF) — https://www.energy.gov/sites/default/files/2023-07/Technology%20Strategy%20Assessment%20-%20Methodology.pdf
- Schmidt, Melchior, Hawkes and Staffell "Projecting the Future Levelized Cost of Electricity Storage Technologies", Joule 3, 81–100 (2019; DOI 10.1016/j.joule.2018.12.008) — https://www.cell.com/joule/fulltext/S2542-4351(18)30583-X
- IEA "Global EV Outlook 2025: Electric vehicle batteries" — https://www.iea.org/reports/global-ev-outlook-2025/electric-vehicle-batteries
- IEA "Global EV Outlook 2026: Electric vehicle batteries" — https://www.iea.org/reports/global-ev-outlook-2026/electric-vehicle-batteries
- U.S. Geological Survey (USGS) "Mineral Commodity Summaries 2026: Lithium", February 2026 (PDF) — https://pubs.usgs.gov/periodicals/mcs2026/mcs2026-lithium.pdf
16. Claim-to-source audit
| Claim in the text | Basis | Label |
|---|---|---|
| That LCOS is a cost per unit of discharge energy throughput (US$/kWh) that compares technologies on a more equal footing than installed cost per unit of rated energy; that PNNL's LCOS estimates are based on 2023 values with a 20-year analysis period, exclude decommissioning and include ARMO | PNNL LCOS Estimates[Reference 2] https://www.pnnl.gov/projects/esgc-cost-performance/lcos-estimates | Sourced |
| That LCOS is the average price at which discharged energy must be sold to recover the total project revenue requirement, which includes installation, financing, O&M, taxes and depreciation, the investment tax credit, charging cost (with round-trip losses) and ARMO; how annual energy output is derived (cycles, rest time, depth of discharge); one-way efficiencies of inverter, rectifier and transformer | PNNL LCOS Workbook Documentation (April 2024)[Reference 3] https://www.pnnl.gov/sites/default/files/media/file/ESGC_LCOS_Workbook_v2024_Documentation.pdf | Sourced |
| That the PNNL workbook gives LCOS in two outputs, including charging cost and round-trip losses, and including losses only; the weighted average cost of capital (nominal 9.47%, real 6.49%), tax rate 25.7%, electricity cost 0.03 US$/kWh, 20-year analysis period, 98% one-way efficiencies and 2% annual escalation of fixed O&M | PNNL LCOS Workbook v2024[Reference 4] https://www.pnnl.gov/sites/default/files/media/file/ESGC_LCOS_Workbook_v2024.xlsx | Sourced |
| That NREL's 2024 capex of a 4-hour utility-scale lithium-ion system is 334 US$/kWh (2024 dollars), based on a bottom-up model (modeled market price, U.S. average of Q1 2024 installations); the ten-item breakdown; that NREL says it is higher than many other recent estimates; fixed O&M of 4% of capex (US$/kW) including augmentation and replacement, variable O&M of 0, a 15-year life, 85% round-trip efficiency and one cycle a day; the energy cost of 241 US$/kWh and power cost of 372 US$/kW; the need to state duration; that the work was completed in January and February 2025 and excludes later tariff changes | NREL (June 2025)[Reference 1] https://www.osti.gov/biblio/2583471 | Sourced |
| The DOE Long-Duration Storage Shot (90% cost reduction, 0.05 US$/kWh for 10 hours or longer, 2030); the LCOS formula (from the ARPA-E DAYS program); that charging cost is not included in LCOS and only the round-trip loss is counted at 0.025 US$/kWh; a 25-year project life, 80% depth of discharge, 7.6% nominal discount rate and 2.0% inflation; that the life of replaceable parts is the smaller of calendar life and cycle life | DOE Storage Innovations 2030 methodology (July 2023)[Reference 5] https://www.energy.gov/sites/default/files/2023-07/Technology%20Strategy%20Assessment%20-%20Methodology.pdf | Sourced |
| The DOE's 2030 target (0.05 US$/kWh for 10 hours or longer) | A DOE target, not a result[Reference 5] https://www.energy.gov/sites/default/files/2023-07/Technology%20Strategy%20Assessment%20-%20Methodology.pdf | Not yet confirmed |
| That LCOS still has no common definition; that some studies neglect replacement or disposal costs and others exclude capacity degradation; that the paper covers 9 technologies, 12 applications and 2015 to 2050 | Schmidt et al., Joule (2019)[Reference 6] https://www.cell.com/joule/fulltext/S2542-4351(18)30583-X | Sourced |
| That battery pack prices fell 20% in 2024 (the largest drop since 2017) and lithium prices about 20%; that LFP is almost 30% cheaper per kWh than NMC and LFP packs are about one-fifth lower by mass and one-third lower by volume in energy density; that pack price is a volume-weighted average across EV and storage and that the IEA analysis is based on BloombergNEF survey data | IEA Global EV Outlook 2025[Reference 7] https://www.iea.org/reports/global-ev-outlook-2025/electric-vehicle-batteries | Sourced |
| That average battery prices fell 8% in 2025; that lithium prices at the start of 2026 were more than twice those of a year earlier and about 70% below the 2022 peak; that the rise could put upward pressure on battery prices; that long-term contracts and vertical integration can temper the effect; that sodium-ion batteries could gain momentum | IEA Global EV Outlook 2026[Reference 8] https://www.iea.org/reports/global-ev-outlook-2026/electric-vehicle-batteries | Sourced |
| That the U.S. annual average price (real) of battery-grade lithium carbonate was 11,700 (2021), 63,700 (2022), 39,000 (2023), 11,800 (2024) and 9,000 (2025, estimate) US$/tonne; that 2025 was 31% below 2024; that prices rose in the second half of 2025 | USGS Mineral Commodity Summaries 2026[Reference 9] https://pubs.usgs.gov/periodicals/mcs2026/mcs2026-lithium.pdf | Sourced |
| A base-case LCOS (definition A) of 184.1 US$/MWh (annualized capital 100.5, fixed O&M 36.6, charging energy 47.1) and 141.5 US$/MWh for definition B; a CRF (7%, 15 years) of 0.1098; every value in the sensitivity analysis; about 181 US$/MWh when degradation is entered as a capacity decline; LCOS by duration; the capex-by-cycles table | Our calculation. The assumptions (capex 334 US$/kWh, fixed O&M 4%, 15-year life, 85% round-trip efficiency, one cycle a day, 7% real discount rate, charging price 40 US$/MWh, a 25 US$/MWh loss calculation for definition B) are in Chapters 4 and 5. Taxes, subsidies, financing, decommissioning and revenue are left out, so it is not on the same scale as public LCOS calculations | Our calculation |
| The lithium content of a cell-kWh (LFP: 0.49 kg of lithium carbonate; NMC811: 0.51 kg; from the electrolyte about 0.035 kg), the lithium cost in each year (5.7, 31.1, 19.0, 5.8 and 4.4 US$/kWh), the shares of system capex, the effect of about 11 US$/MWh under one-for-one pass-through, and the 7.1-fold price range | Our calculation. Specific capacity, voltage, electrolyte mass and LiPF6 fraction are our assumptions and ideal stoichiometry. Pass-through to selling prices is a sensitivity, not a price forecast | Our calculation |
| The four checks when reading an LCOS number, why cycles matter, the comparison of the value of life and of capex, the two ways of entering degradation, separating material price from material quantity, the reading that lithium exposure per kWh is similar for LFP and NMC, and the rules for separating pack from system | Commentary: our own organization of published material. Not views stated by any agency | Commentary |
| PNNL's LCOS values, the specific pack prices of the IEA (US$/kWh), the revenue side (arbitrage and so on), recent bid prices, and the relation between actual battery selling prices and lithium prices | Could not be confirmed from primary sources, or left out of scope, so none is stated (Commentary) | Commentary |
| That Figs. 1 and 7 are AI-generated images and Figs. 2 to 6 are explanatory drawings, not real facilities or measured data | Our note | Commentary |
Last updated 10 October 2026. Sources are limited to primary material (publications of NREL, PNNL, the DOE, the IEA and USGS, and a peer-reviewed paper). We use no price forecasts. Our calculations (Chapters 4 to 6, 9 and 10) are simplified forms with every assumption written down; they are not on the same scale as the public agencies' LCOS and do not show the values of a real project or market. PNNL's LCOS values, the IEA's specific pack prices and the revenue side could not be confirmed or are out of scope and are not stated. Figs. 1 and 7 are AI-generated images and Figs. 2 to 6 are vector drawings; none of them shows a real facility or measured data.