TECHNOLOGY EXPLAINER
Graphite Anodes and Electrode Design
— a material working just above 0 V, and the trade between thickness and porosity
The anode of a lithium-ion battery is still mostly graphite. Graphite takes up lithium at a potential just above the one at which lithium deposits as metal (0 V vs Li/Li⁺). So when the anode potential falls below 0 V because of low temperature, fast charging or a thick electrode, metallic lithium can plate out. This article covers the structure and staging of graphite, how natural and synthetic graphite are made, electrode thickness and porosity, the negative-to-positive capacity ratio (N/P ratio), lithium plating and the limits of fast charging, from a materials engineer's point of view and built on peer-reviewed papers, an Argonne National Laboratory report and a U.S. Department of Energy report. Silicon anodes are left to the “Silicon Anodes and Nanostructured Electrodes” article in this series. Nothing here is investment, procurement or design advice.
- What a graphite anode is (the short version)
- The structure of graphite, and staging
- Natural and synthetic graphite — how they are made
- Electrode design variables — thickness, porosity, areal capacity
- Our calculation: from areal capacity to electrode thickness
- A materials engineer's view (1): a thick electrode is set by transport, not by the material
- Negative-to-positive capacity ratio (N/P ratio) and lithium plating
- Our calculation: N/P ratio and the headroom in graphite's lithium filling
- The limits of fast charging — seen as current density
- A materials engineer's view (2): low temperature and fast charging are the same anode-potential problem
- Strengths and weaknesses; how this article divides work with others in the series
- How to read evaluations and standards
- Glossary
- References (primary sources)
- Claim-to-source audit
Sourced = content stated in published material (link given)
Our calculation = a figure this article derived, with the assumptions spelled out
Not yet confirmed = a plan or target with no confirmed track record
Structural readings and materials-design interpretations are marked separately as Commentary. An Inference is shown in bold.
Every battery figure is accompanied by whether it is a material, electrode or cell value. Simulations and results under particular conditions are never written as general rules.
1. What a graphite anode is (the short version)
Graphite is “a layered carbon crystal that takes lithium in between its layers”. The Argonne National Laboratory BatPaC report says that carbon materials in the form of graphite and/or hard carbon are still used in the vast majority of commercial cells, with graphite offering the greatest energy density and hard carbon said to enable high rate capability with a decreased risk of lithium plating (an undesired side reaction) during high charge ratesSourced.
- What happens: Dahn determined the LixC6 phase diagram with lithium/graphite cells and in situ X-ray diffraction and reported that as lithium increases, the material moves through stage 4, stage 3, stage 2 and finally filled stage 1Sourced
- What is hard: graphite's potential is close to that at which lithium metal deposits, so when the anode potential falls below 0 V vs Li/Li⁺, the formation of metallic lithium is thermodynamically feasibleSourced. High current, low temperature and thick electrodes push toward that state
- What design decides: the type of graphite (natural, synthetic or blended), particle shape and surface, electrode thickness and porosity, and the capacity margin over the cathode (the N/P ratio). This article takes these four in turn
Graphite anode design is a trade between “gaining capacity (thick, dense)” and “keeping the anode potential above 0 V (thin, with margin)”. The BatPaC report states that a fast-charge requirement may call for a lower-loading (thinner electrode) design, at the price of more inactive material, a more expensive and less energy-dense batterySourced.
2. The structure of graphite, and staging
Graphite is a crystal built of stacked hexagonal carbon sheets (graphene layers). Lithium goes between the layers (intercalation). The review by Winter and co-authors says insertion electrode materials are used in most ambient-temperature rechargeable batteries because electrochemical insertion reactions are intrinsically simple and reversibleSourced.
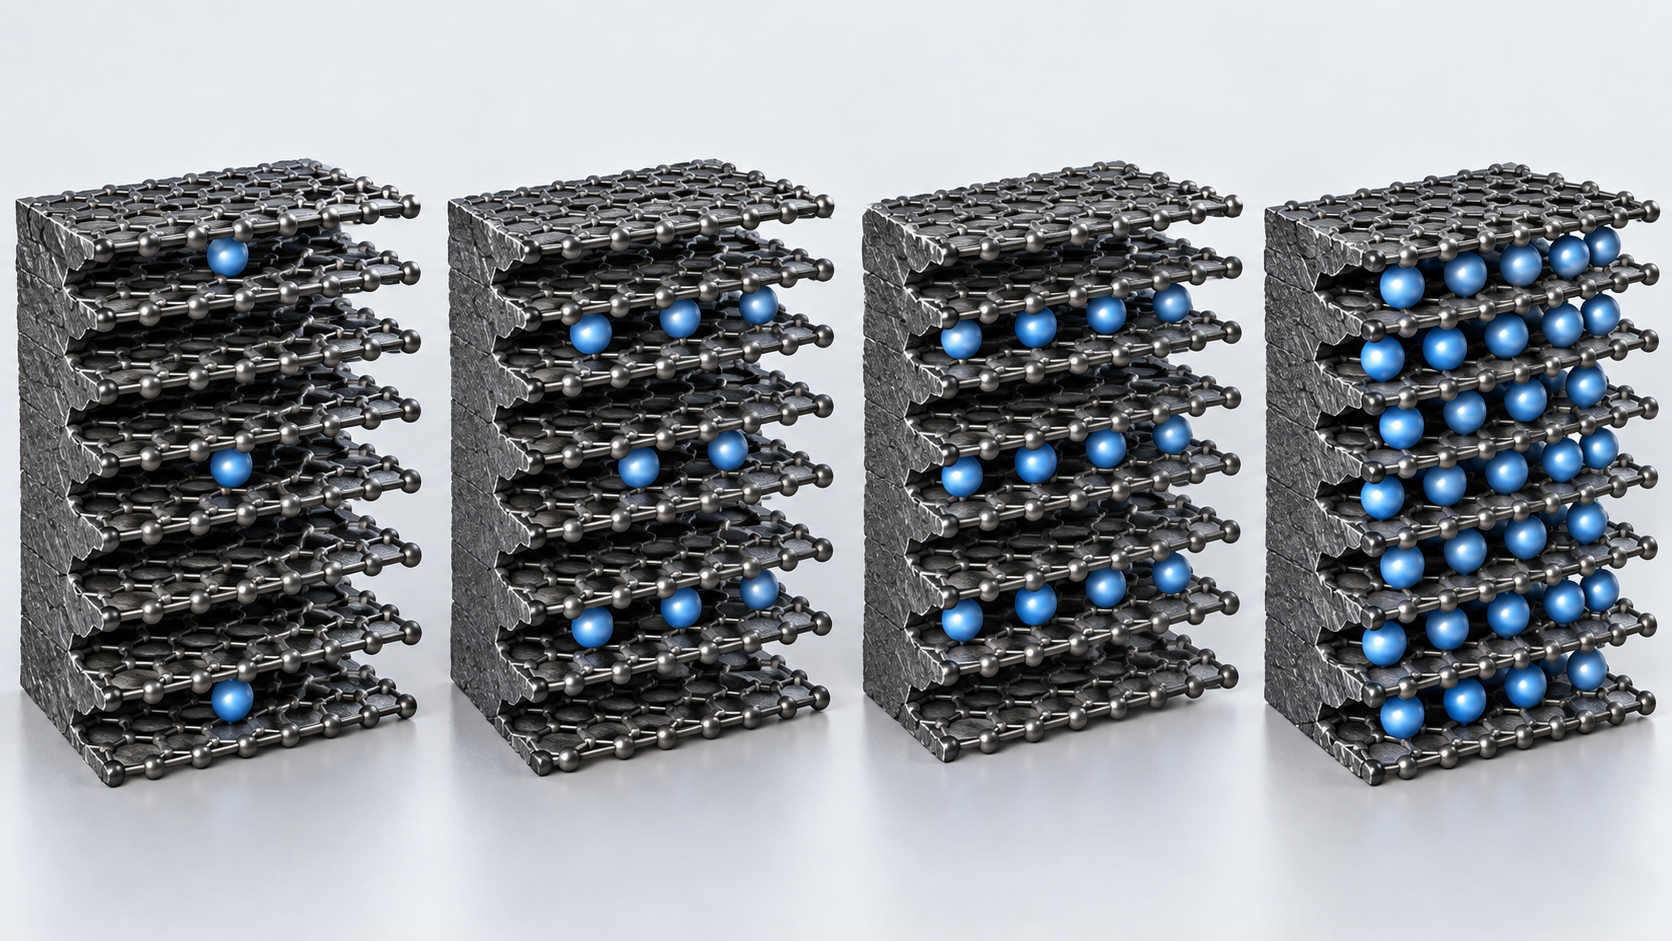
Dahn determined the phase diagram of LixC6 (0 ≤ x ≤ 1) with lithium/graphite cells and in situ X-ray diffraction. As x passes 0.04, a dilute stage-1 phase and a stage-4 phase coexist, and as x increases further the material moves to stage 3, a “liquid-like” 2L phase, stage 2 and filled stage 1. Clear coexisting-phase regions (first-order transitions) were seen for all transitions except stage 4 to 3Sourced. This stepwise filling shows up as plateaus and steps in graphite's voltage curve (Commentary). Hahn and co-authors showed with electrochemical dilatometry on powder-type graphite electrodes that the thickness-change curves reveal the same major staging features seen in the potential profilesSourced.
Theoretical capacity comes from dividing the Faraday constant (96,485 C/mol = 26,801 mAh/mol) by the molar mass of carbon per lithiumOur calculation. In LiC6, six carbons hold one lithium, so the molar mass is 6 × 12.01 = 72.07 g/mol. 26,801 ÷ 72.07 = about 372 mAh/g. In real graphite electrodes roughly 90% or more of this is used reversibly, but practical values differ by graphite, electrode and conditions, so this article assumes a reversible capacity of 350 mAh/g (about 94% of theory) in its calculations (an assumption, not the value of any particular product).
Qi and Harris, in in situ strain measurements on a composite electrode, showed that the increase in graphite crystallite volume on lithiation is accommodated primarily by a decrease in the composite (particle) porositySourced. They add that the porosity change can substantially affect power, yet has generally been ignored in cell performance models.
Something else happens on the first charge. Hahn and co-authors showed that for all the graphites studied, expansion starts well above 0.5 V (vs Li), which they explain by solvent co-intercalation before SEI formation (the Besenhard model)Sourced. Goodenough and Park's review says the passivation layer formed on the anode robs lithium from the cathode irreversibly on the first chargeSourced. The SEI is covered in the “SEI” article in this series.
3. Natural and synthetic graphite — how they are made
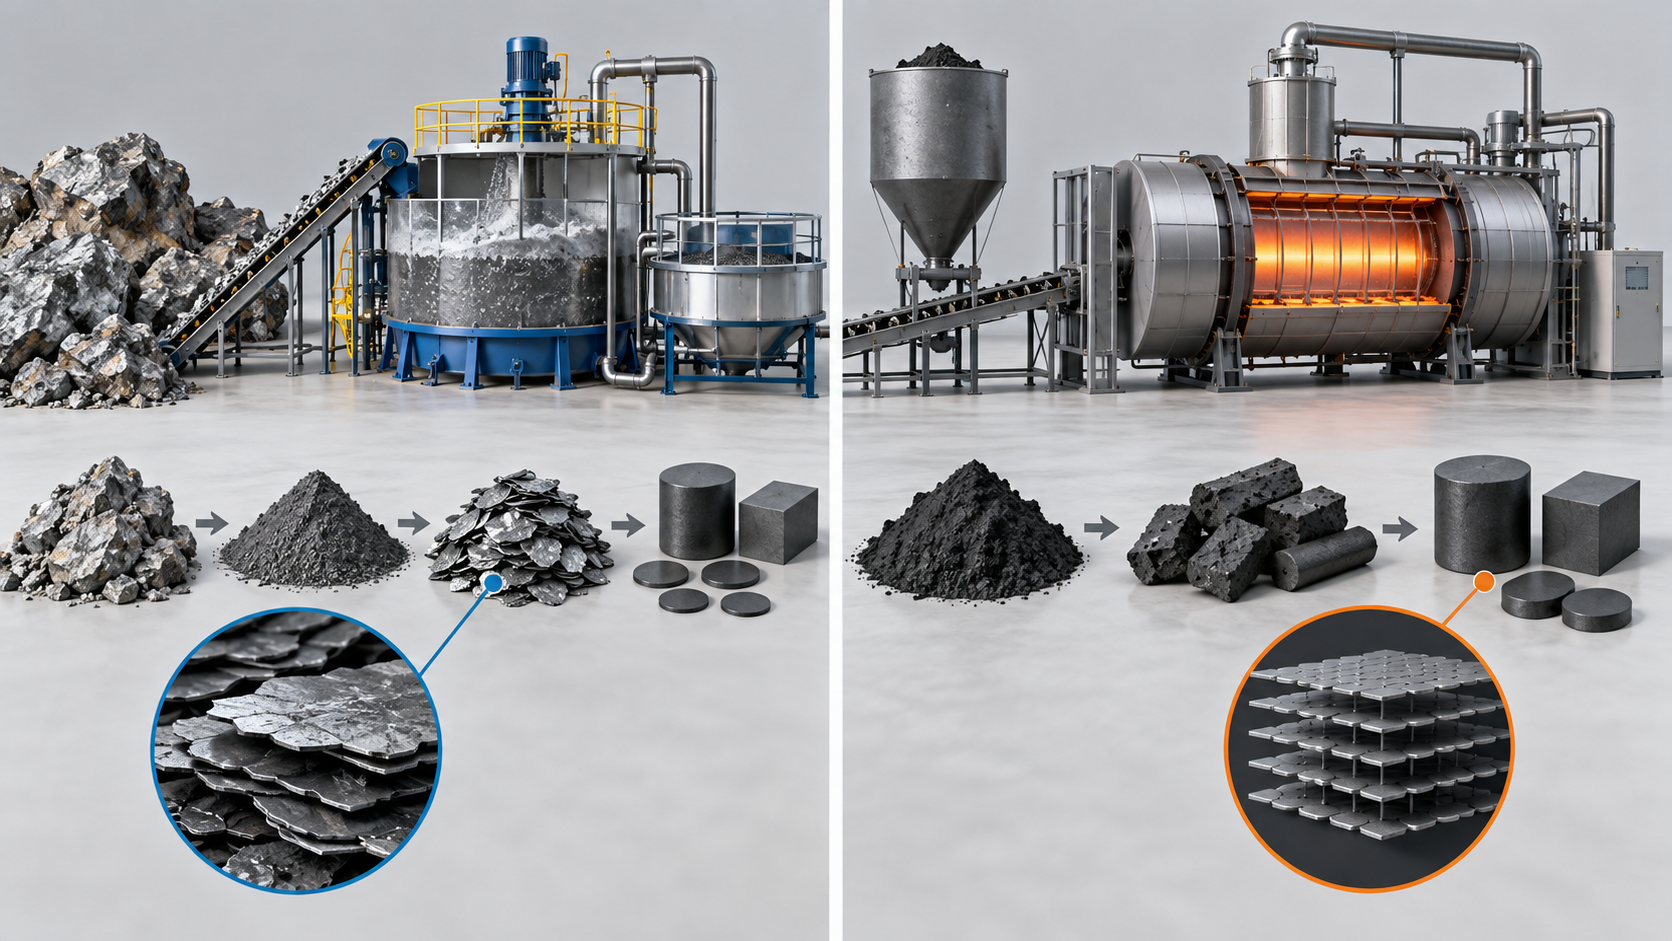
For its cost and performance calculations the BatPaC report chose synthetic graphite as the standard, noting that there are significant differences in cost and performance between synthetic, natural and coated-natural graphite, and that many manufacturers use a proprietary blend of natural and synthetic graphite, sometimes with hard carbon, in the negative electrodeSourced.
View the original SVG schematic and exact annotations
| Item | Natural graphite | Synthetic graphite | Reference |
|---|---|---|---|
| Feedstock and process | Ore is taken through mining, flotation, purification, spheronising and heat treatment to battery-grade purity (above 99.95% C) | Carbon feedstocks such as petroleum coke or coal tar pitch are graphitised at high temperature (the Acheson process: up to about 3000°C for days) | [Refs. 12, 13] |
| Cost structure (as the literature puts it) | Generally lower production cost but lower purity and quality. A cited figure has up to 70% of feedstock lost in spheronising | Higher production cost but higher purity and uniformity. Graphitisation is high-temperature and energy-intensive | [Ref. 13] |
| Crystal orientation (as the literature puts it) | Anisotropic crystal structure that can shorten cycle life; larger domains and a tendency to higher capacity | Isotropic, with better thermal stability and charge/discharge kinetics and a tendency to longer cycle life; smaller domains and lower capacity | [Ref. 13] |
| How they are actually used | Many manufacturers use a proprietary blend of natural and synthetic (sometimes with hard carbon) | BatPaC picks synthetic graphite as its standard | [Ref. 2] |
All Sourced. However, “cost structure” and “crystal orientation” are secondary statements summarised in the introduction of the Quebec LCA paper and show tendencies. The performance of any individual graphite changes greatly with particle shape, surface treatment and size distribution (Commentary).
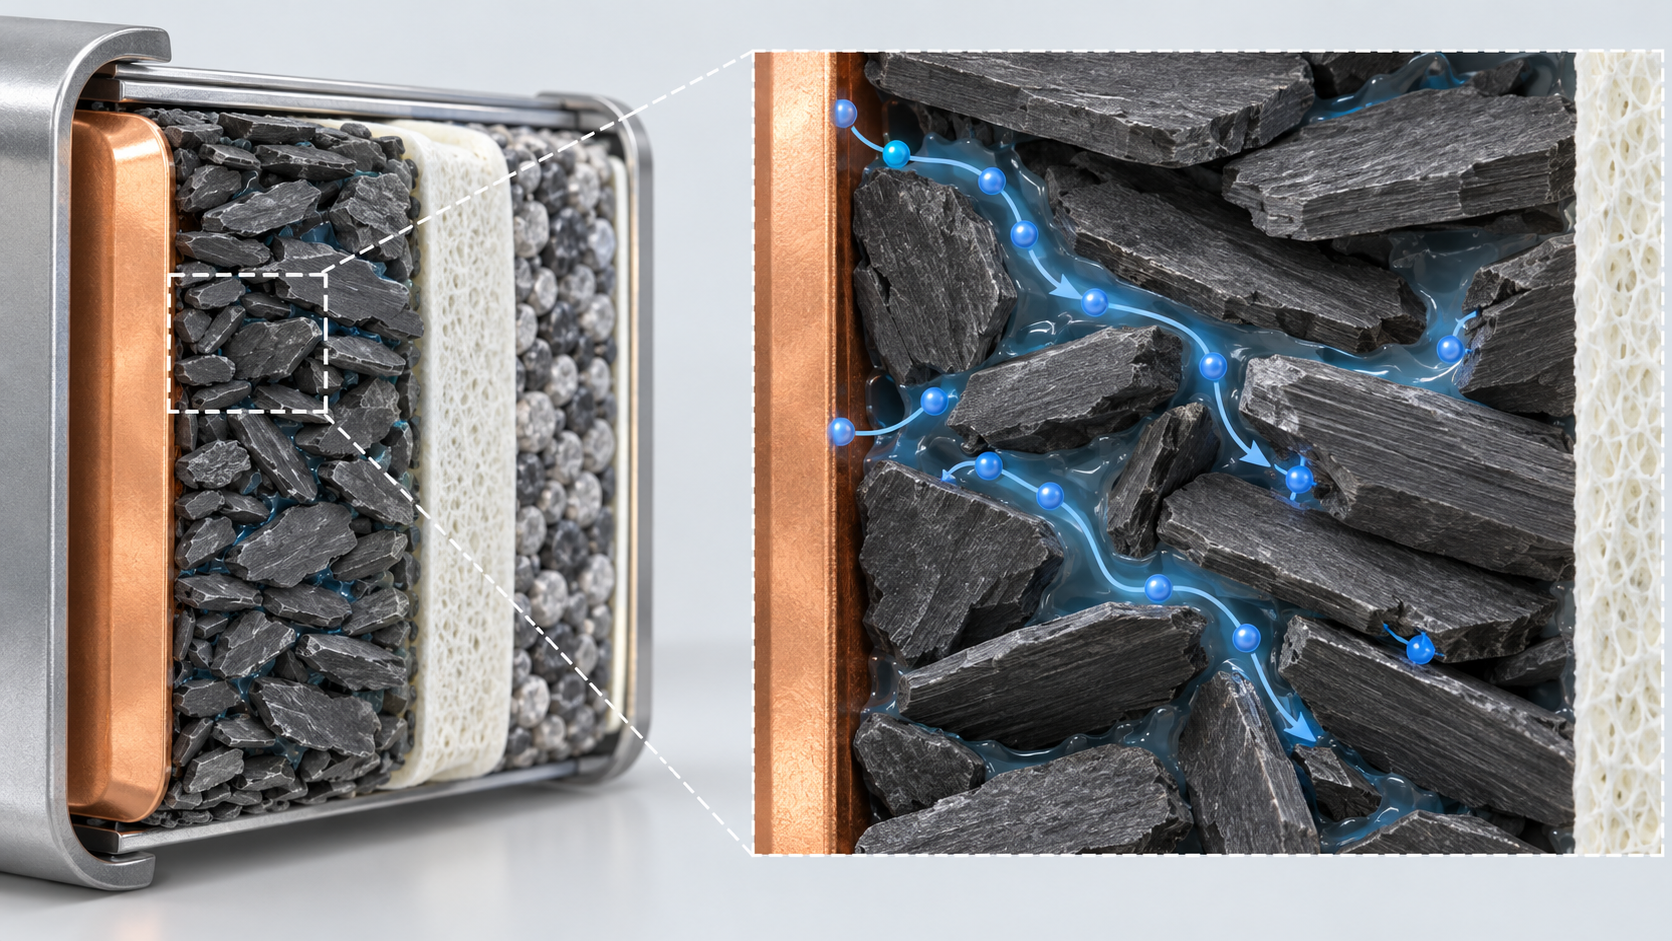
Even for “graphite”, behaviour in the electrode changes with particle shape (flake or sphere), crystal orientation, surface (coated or not) and size distribution. Ebner and co-authors used synchrotron X-ray tomography on electrode microstructures and showed that particle shape and fabrication-induced alignment cause tortuosity anisotropy, which can impact battery performanceSourced. The reading from the materials side is that flake-like particles tend to lie flat parallel to the foil through coating and calendering, which tends to lengthen the path ions take through the thickness of the electrode (Commentary). The spheronising step in natural-graphite processing is probably there for this reason (Inference).
One more point: blending natural and synthetic is not only a compromise between a cheap and a high-performance material. Manufacturers keep blends proprietary probably because they tune electrode density, fast charging and cycle life together through the combination of particle shape, size and surface (Inference). The contents of such blends could not be confirmed in public material.
4. Electrode design variables — thickness, porosity, areal capacity
The (negative) electrode is a composite of graphite particles, binder, conductive additive (a little or none in the anode) and pores filled with electrolyte, coated on copper foil [Reference 2]. There are three main design variables.
- Areal capacity (mAh/cm²): the charge stored per unit electrode area, also called “loading”
- Thickness (µm): areal capacity divided by the capacity per unit electrode volume. The thicker it is, the lower the share of metal foil and separator, which helps energy density and cost
- Porosity (%): the fraction of electrode volume that is void space for electrolyte. It is the path for ions and is traded against electrode density (Wh/L)
The BatPaC report says that 100 µm appears to be the general electrode thickness used for EV-type cells, sets 100 µm as the model's default maximum, notes that this represents a graphite electrode balanced to a positive loading of 3.5 mAh/cm² and is the largest thickness at which Argonne has validated ASI (area-specific impedance) measurementsSourced. It also records that one domestic OEM suggested that state-of-the-art loadings for PHEV applications were under 2 mAh/cm² at the time, chosen on cold-start performance and lifeSourced.
View the original SVG schematic and exact annotations
What does a thicker electrode gain, and what does it lose?
Singh and co-authors compared cells with NMC-based cathodes and graphite-based anodes (with low binder and carbon black contents) at 70 µm and 320 µm single-side thickness. At C/10 and C/5 both lost only about 6% capacity on cycling, but at C/2 the thick electrodes lost 37% and the thin ones 8%. Pouch cells with thick electrodes had 19% higher volumetric energy density at C/5Sourced (conditions of that study). Wood and co-authors estimate that doubling the electrode thickness lets half of the inactive current collectors and separators be removed and cuts processing cost (together with aqueous electrode processing and a shorter formation time, a reduction of pack cost from US$502.8/kWh-usable to US$370.3/kWh-usable)Sourced.
Gallagher and co-authors, on the other hand, showed by experiment and theory that on discharge electrolyte transport limits utilisation of the positive electrode, while on charge a combination of electrolyte transport and polarisation leads to lithium plating in the graphite electrodeSourced. The BatPaC report likewise shows that beyond 100 µm the fraction of theoretical capacity falls markedly on a C/1 discharge (the positive electrode becomes starved of electrolyte salt), and in a simulation that above an electrode loading of 3.4 mAh/cm² the graphite potential approaches lithium plating in a 5C charge pulse (NCA/graphite cell, those conditions)Sourced.
5. Our calculation: from areal capacity to electrode thickness
Thickness (µm) = areal capacity (mAh/cm²) ÷ [reversible capacity (mAh/g) × active-material mass fraction × coating density (g/cm³)] × 10,000Our calculation. Assumptions: reversible capacity 350 mAh/g, active-material mass fraction 96%, coating density (after calendering) 1.5 g/cm³. Capacity per unit volume is then 350 × 0.96 × 1.5 = 504 mAh/cm³. Taking the density of the solid part of the coating as 2.2 g/cm³, porosity is 1 − 1.5 ÷ 2.2 = about 32%.
| Anode areal capacity (mAh/cm²) | Thickness (one side, µm) | Note |
|---|---|---|
| 2.0 | about 40 | Close to the “under 2 mAh/cm²” PHEV loading an OEM described (a cathode-side value) |
| 3.0 | about 60 | |
| 4.4 (= 3.5 × N/P 1.25) | about 87 | Same order as BatPaC's “graphite electrode balanced to 3.5 mAh/cm² of cathode = 100 µm” (100 µm if the density is about 1.3 g/cm³) |
| 6.0 | about 119 | Exceeds BatPaC's default maximum of 100 µm |
| 8.0 | about 159 | About half the thick electrode (320 µm single side) of Singh et al. |
Areal capacities are assumed values and thicknesses are Our calculation (assuming 350 mAh/g, 96% active material and 1.5 g/cm³ coating density). The BatPaC, OEM and Singh et al. values are Sourced, but their conditions (cathode areal capacity or not, single side or not) differ, so the comparison is only of order of magnitude.
Taking the average cell voltage as 3.7 V (an assumption), 1 kWh = 1,000 ÷ 3.7 = 270 Ah of charge. With an N/P ratio of 1.25 and a reversible capacity of 350 mAh/g, the graphite required is 270 × 1.25 ÷ 0.350 = about 0.96 kg/kWhOur calculation. The Quebec natural-graphite LCA paper writes “roughly 1.2 kg of graphite per kWh of cell capacity” (a cited value), the same order of magnitudeSourced. Assumptions and limits: first-cycle irreversible capacity, electrode-edge margins and the masses of conductive additive and binder are not included, and the basis of the 1.2 kg/kWh figure is not stated in that paper.
6. A materials engineer's view (1): a thick electrode is set by transport, not by the material
Gallagher and co-authors traced the loss of output in thick electrodes to electrolyte transport. The Argonne BatPaC report also shows a thick positive electrode becoming starved of electrolyte salt, and says the remedy is to engineer significantly reduced tortuosity or to use an electrolyte with better mass-transfer characteristicsSourced. So the places where a materials engineer can act are not only the graphite crystal but particle shape and alignment (tortuosity), porosity and pore size, and the transport properties of the electrolyte (Commentary).
- Porosity changes with lithiation: as Qi and Harris showed, the volume growth of graphite crystals is taken up by a loss of porosity. The more it is charged (the more graphite swells), the fewer the pores and the narrower the ion pathSourced. Porosity should be seen not only as a design value but as changing with state of charge (Commentary)
- Flake or sphere: the tortuosity anisotropy shown by Ebner and co-authors comes from particle shape and alignmentSourced. This is probably part of the background to the use of spheronised graphite (Inference)
- The cost of going thin: a thinner electrode eases transport problems, but as BatPaC states, more inactive material (foil, separator) is used and the battery is more expensive and less energy-dense. The estimate by Wood and co-authors shows the gain in the opposite (thicker) directionSourced
Inference: high-energy-density cells and fast-charge cells probably differ in electrode thickness and graphite choice because they place their design point differently on this trade. Electrode thickness and porosity of individual products could not be confirmed in public material.
7. Negative-to-positive capacity ratio (N/P ratio) and lithium plating
The N/P ratio is the reversible capacity of the negative electrode divided by that of the positive electrode. Above 1 the anode has margin. The BatPaC report decides the negative-electrode thickness by “the designed excess capacity to prevent lithium plating” and uses N/P = 1.25 as the default for graphite-negative cells. It sets 1.25 for layered-oxide positives (NCA, NMC441, NMC333) because of their lower first-cycle efficiency of about 88%, 1.20 for spinel LMO and lithium iron phosphate because of their high first-cycle efficiency, and 1.1 for lithium titanate (LTO) negatives, which form no SEI and have little chance of platingSourced (BatPaC's assumed values).
On the conditions for lithium plating, primary sources say the following.
- Potential: when the anode surface potential falls below 0 V vs Li/Li⁺, the formation of metallic lithium becomes thermodynamically feasible. High currents and low temperatures raise the chance of platingSourced (abstract of the review by Janakiraman et al.)
- Low temperature: Yang and co-authors write that none of today's EVs allow fast charging in cold or even cool temperatures because of the risk of lithium plating, and present an approach for 15-minute fast charging even at −50°C while preserving 4,500 cycles (equivalent to over 12 years and over 280,000 miles of EV lifetime)Sourced (the authors' report; see the paper for the method and conditions)
- How much lithium it takes before plating starts: Downie and co-authors, from the heat flow of graphite/NMC cells on charge, measured the onset of lithium plating at 336 mAh/g for G25 graphite (Li0.888C6) and 297 mAh/g for MCMB graphite (Li0.804C6)Sourced (the graphites and conditions of that study). Plating can begin before the graphite is fully lithiated, depending on conditions
8. Our calculation: N/P ratio and the headroom in graphite's lithium filling
When all the lithium leaving the cathode goes into the anode at full charge, the anode filling is 1 ÷ (N/P) of its reversible capacity. Assuming a reversible capacity of 350 mAh/g (about 94% of the theoretical 372 mAh/g), x = (1 ÷ N/P) × 0.94Our calculation.
- N/P = 1.00: x = about 0.94
- N/P = 1.10: x = about 0.86
- N/P = 1.20: x = about 0.78
- N/P = 1.25: x = about 0.75
Assumptions and limits: first-cycle irreversible capacity (lithium consumed in the SEI), irreversible capacity of the cathode, charge current, temperature and capacity differences from degradation are not included. The plating onsets reported by Downie et al. (x about 0.80 to 0.89) are for the graphites and conditions of that study and are not a general rule.
What this calculation shows is that the N/P ratio is a margin against plating, and its size is set by the distance to the plating onset. At N/P = 1.25 the anode is at x of about 0.75 even at full charge, short of the onset reported by Downie et al. (about 0.80 to 0.89). The more N/P is cut to gain capacity, the smaller the margin becomes (Commentary). Meanwhile, with high current (fast charge), low temperature or a thick electrode, the anode potential falls below 0 V before the average filling gets there, so plating can occur at the same N/P ratio. The N/P ratio alone cannot guarantee safety (Commentary).
9. The limits of fast charging — seen as current density
A U.S. Department of Energy report (centred on Idaho National Laboratory) discusses 350 kW extreme fast charging (XFC), defined as recharging a battery in under 10 minutes for roughly 175 miles (about 280 km) of driving. It also notes that packs designed to meet XFC are expected to be significantly more expensive initially than BEV packs optimised for rangeSourced (a 2017 report).
From the graphite side, the issue is the current passed per unit anode area (current density). From experiment and theory, Gallagher and co-authors proposed a guideline that graphite cells should avoid charge current densities near or above about 4 mA/cm² unless additional precautions are takenSourced (derived for the electrodes and electrolyte of that study). Current density is C-rate × areal capacity of the electrode.
Current density (mA/cm²) = C-rate × areal capacity (mAh/cm²)Our calculation. We compare it with the guideline of Gallagher et al. (about 4 mA/cm²).
| Areal capacity (mAh/cm²) | 1C (about 60 min) | 2C (about 30 min) | 4C (about 15 min) | Highest C-rate allowed at 4 mA/cm² |
|---|---|---|---|---|
| 1.0 | 1.0 | 2.0 | 4.0 (reaches the guideline) | about 4C |
| 2.0 | 2.0 | 4.0 (reaches the guideline) | 8.0 | about 2C |
| 3.5 (BatPaC default cathode) | 3.5 | 7.0 | 14.0 | about 1.1C |
| 6.0 | 6.0 (exceeds the guideline) | 12.0 | 24.0 | about 0.7C |
Current densities and highest C-rates are Our calculation. “About 4 mA/cm²” is the guideline of Gallagher et al. Sourced, a value for the electrodes, electrolyte and temperature of that study, not a general rule. Areal capacity is taken per electrode area, with constant current throughout charge.
The table and figure show that a 15-minute (about 4C) charge of an electrode with an areal capacity of 3.5 mAh/cm² would mean 14 mA/cm², about 3.5 times the guideline. To stay within the guideline you must either reduce areal capacity to about 1 mAh/cm² or use other measures (electrolyte, temperature, particles, pore structure, a different anode material). The BatPaC report says fast charging may require a lower-loading design, and that this would not be true for LTO negatives or possibly even non-graphitic carbon such as hard carbonSourced. Yang and co-authors report that a method of controlling temperature made 15-minute charging possible even at low temperatureSourced. Hard carbon is covered in the “Hard Carbon Anodes” article in this series.
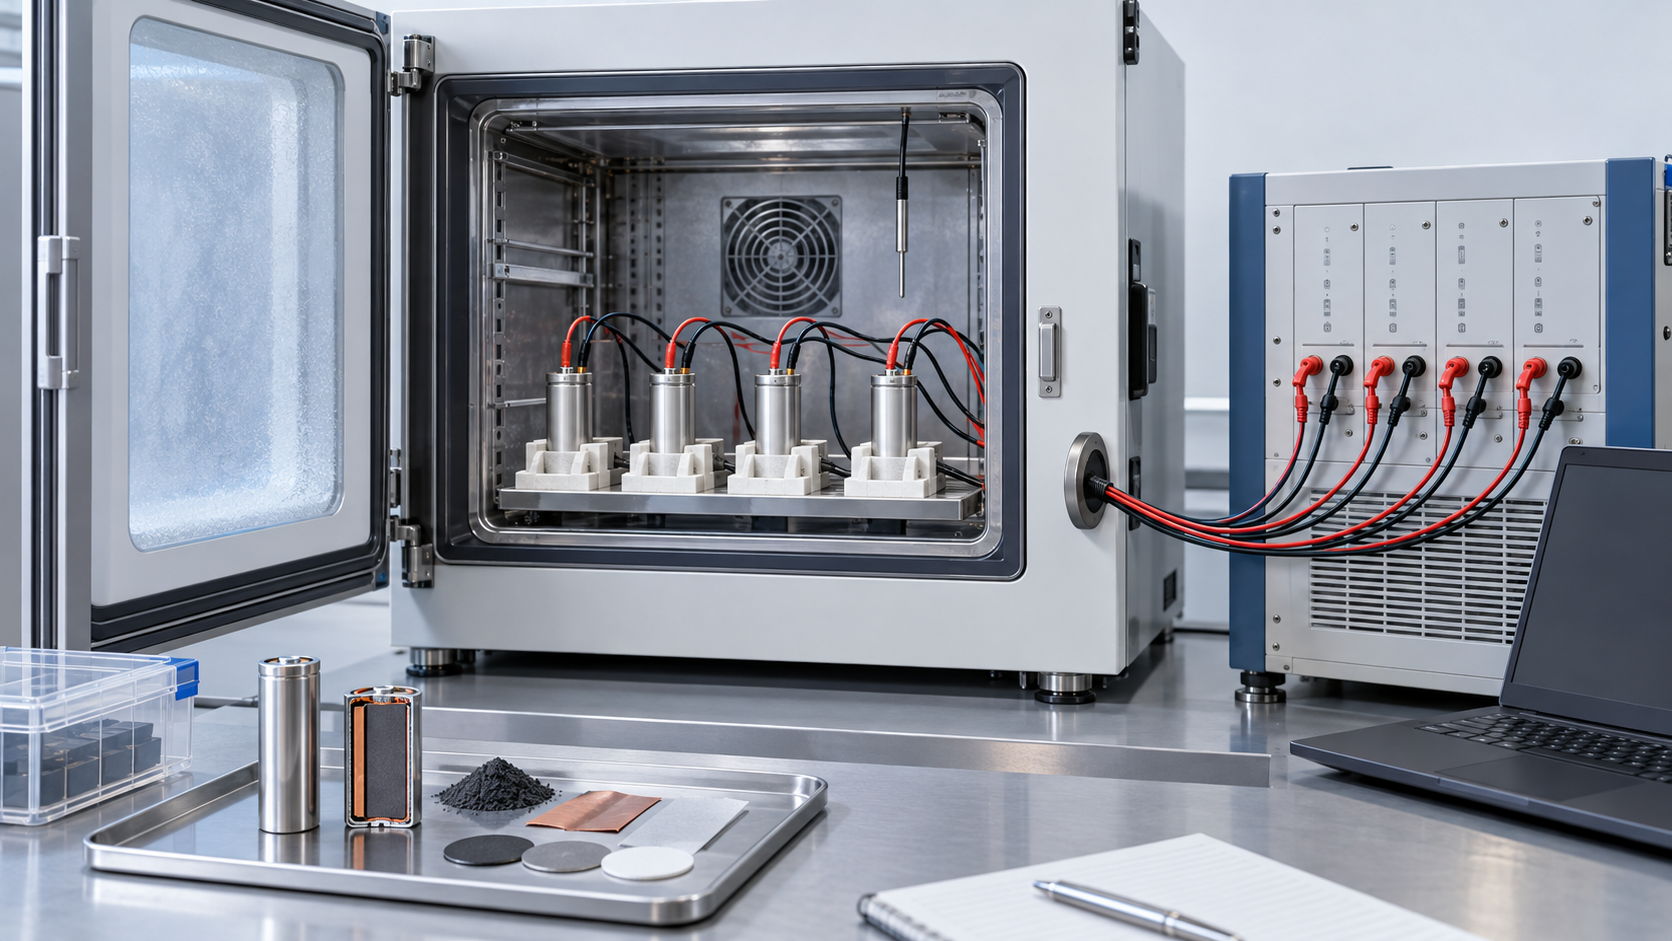
10. A materials engineer's view (2): low temperature and fast charging are the same anode-potential problem
Lithium plating happens when the anode potential falls below 0 V vs Li/Li⁺Sourced. The nearer graphite is to full charge, the closer its potential is to 0 V, so the larger the current (more polarisation), the lower the temperature (slower reaction and transport) and the thicker the electrode (slower electrolyte transport), the earlier part of the electrode drops below 0 V, before the average filling gets there (Commentary).
- Low temperature: the BatPaC report says the limit from electrolyte transport is worsened at low temperatures such as winter drivingSourced. Yang and co-authors give the risk of lithium plating as the reason today's EVs do not allow fast charging in the coldSourced
- The evaluation side: plating is hard to judge. The review by Janakiraman and co-authors says there are various electrochemical and analytical methods for determining the plating boundary and that knowledge gaps remainSourced. The heat-flow measurement by Downie and co-authors is one of them
- The link to life: Downie and co-authors measured that plated lithium raises reactivity with the electrolyte, leading to lower coulombic efficiency, parasitic thermal energy and capacity fade, and reported that the efficiency of lithium plating on the graphite surface was 0.98 (G25) and 0.97 (MCMB)Sourced (conditions of that study). In their framing part of the plated lithium comes back (reversible) and part does not
Inference: when evaluating a graphite for materials development, it is probably wise to check that charge rate, temperature, areal capacity and N/P ratio are all given in the same table. A value that says only “fast charging possible” cannot be compared unless these conditions are known (Commentary). Fast-charge limits of individual commercial graphites could not be confirmed in public material.
11. Strengths and weaknesses; how this article divides work with others in the series
- Strengths: the carbon material that gives the greatest energy density and is still used in the vast majority of commercial cells, with stepwise, reversible intercalation through stagingSourced
- Challenges: the potential is close to 0 V, so there is a danger of lithium plating at low temperature, on fast charging and with thick electrodes. Thicker electrodes favour energy density and cost, but output drops through electrolyte transport. In manufacturing, the literature says synthetic graphite uses much energy in high-temperature graphitisation and natural graphite loses yield in spheronisingSourced
- Pitfalls in reading: do not compare “fast charging possible” or “high energy density” without areal capacity, C-rate, temperature and N/P ratio (sections 9 and 10)
What this article does not cover
- Silicon anodes: designs that blend silicon into graphite are covered in the “Silicon Anodes and Nanostructured Electrodes” article. The N/P calculations here assume a graphite-only anode
- Hard carbon and lithium titanate: hard carbon as an anode with less plating is covered in “Hard Carbon Anodes”, and other anodes in “Next-Generation Battery Chemistries Compared”
- SEI, electrolytes and binders: left to the “SEI”, “Electrolytes and Separators” and “Conductive Additives and Binders” articles. That the anode binder is water-based is stated by BatPaC [Reference 2]
- Electrode manufacturing: coating, drying and calendering are left to “Electrode Manufacturing”
- Graphite resources and sourcing: the IEA says graphite anodes are among the parts of the supply chain that rely heavily on Chinese manufacturing capacity [Reference 17]. Resources, price and supply are left to “Battery Raw Materials and Supply Chains”
- What could not be confirmed: properties of individual commercial graphites (particle size, tap density, specific surface area), anode thickness, porosity and N/P ratio in commercial cells, the market share and blend ratio of natural and synthetic graphite, and fast-charge limit values. None of these is filled in by guesswork
- Graphite takes up lithium stepwise through staging. The theoretical capacity is about 372 mAh/g (LiC6)Our calculation. The potential is close to 0 V, and when the anode potential falls below 0 V, plating of metallic lithium can occurSourced
- Natural and synthetic graphite are made differently. Natural graphite is purified, spheronised and coated; synthetic is graphitised at up to about 3000°C. Many manufacturers blend the twoSourced
- Electrode thickness is set by transport. In a comparison of 70 µm and 320 µm electrodes, the capacity loss at C/2 was 8% against 37%, while the thick electrode had 19% higher volumetric energy densitySourced
- The N/P ratio is a margin against plating. At N/P = 1.25 the anode is at x of about 0.75 even at full charge (our calculation), short of the reported plating onset (x about 0.80 to 0.89), but this changes with current, temperature and thicknessOur calculation
- Fast charging is a matter of current density. At 4C with an areal capacity of 3.5 mAh/cm², 14 mA/cm² is about 3.5 times the guideline of Gallagher et al. (about 4 mA/cm²)Our calculation
12. How to read evaluations and standards
Before comparing which number is larger, align the basis of comparison in the following order. This is an editorial reading checklist, not a set of test conditions or acceptance limits prescribed by a standard.
- 1. What was measured?
- reversible capacity, initial efficiency, plating during fast charging and life. Check the units and whether the result describes a material, component or complete system.
- 2. Under which conditions?
- particles, electrode density, loading, temperature, charging current and electrode balance. Treat results under different conditions as separate results before comparing them.
- 3. The comparison trap
- Distinguish graphite-powder performance from performance in a dense electrode.
- 4. What does the standard cover?
- Check the identifier, title, edition and scope in the issuing body’s material. Distinguish test methods, safety, interoperability and management requirements. Naming a standard alone does not establish that a test, conformity assessment or certification has been completed.
Keep a comparison note containing the object, units, conditions, sample count and variation, comparator, standard edition and unresolved points. Do not invent numerical conditions or acceptance limits from a public abstract of a standard.
13. Glossary
- Graphite
- A layered crystal of stacked hexagonal carbon sheets. Lithium goes between the layers.
- Staging
- A structure in which lithium-filled gaps and empty gaps alternate periodically. Stage 1 has every gap filled (LiC6).
- Natural / synthetic graphite
- Graphite purified from ore / graphite made by graphitising carbon feedstocks such as petroleum coke at high temperature.
- Spheronising
- A step that rounds flaky graphite particles into spheres.
- Graphitisation (Acheson process)
- Heating a carbon feedstock for a long time at about 3000°C to turn it into graphite crystal.
- Areal capacity (loading)
- The capacity per unit electrode area (mAh/cm²).
- Porosity
- The fraction of electrode volume that is void space. Electrolyte fills it and it carries ions.
- Tortuosity
- How winding the pore paths are. The larger it is, the slower the effective ion diffusion.
- N/P ratio
- The reversible capacity of the negative electrode divided by that of the positive electrode. Above 1 the negative electrode has margin.
- Lithium plating
- Metallic lithium forming on the surface when the negative-electrode potential falls below 0 V vs Li/Li⁺.
- Current density
- Current per unit electrode area (mA/cm²): C-rate × areal capacity.
- C-rate
- A way to express current. 1C charges fully in one hour; 4C in about 15 minutes.
- ASI
- Area-specific impedance: cell resistance multiplied by area (Ω·cm²).
- XFC
- Extreme fast charging. Discussed as 350 kW charging in under 10 minutes.
- SEI
- Solid electrolyte interphase. A thin film formed on the anode surface.
14. References (primary sources)
- Dahn "Phase diagram of LixC6," Physical Review B 44, 9170–9177 (1991) — doi.org/10.1103/PhysRevB.44.9170
- Nelson, Gallagher, Bloom, Dees (Argonne National Laboratory) "Modeling the Performance and Cost of Lithium-Ion Batteries for Electric-Drive Vehicles (Second Edition)," ANL-12/55 (2012) (PDF) — osti.gov
- Gallagher, Trask, Bauer, Woehrle et al. "Optimizing Areal Capacities through Understanding the Limitations of Lithium-Ion Electrodes," Journal of The Electrochemical Society 163, A138–A149 (2016) — doi.org/10.1149/2.0321602jes
- Singh, Kaiser, Hahn "Thick Electrodes for High Energy Lithium Ion Batteries," Journal of The Electrochemical Society 162, A1196–A1201 (2015) — doi.org/10.1149/2.0401507jes
- Wood, Li, Daniel "Prospects for reducing the processing cost of lithium ion batteries," Journal of Power Sources 275, 234–242 (2015) — doi.org/10.1016/j.jpowsour.2014.11.019
- Ebner, Chung, García, Wood "Tortuosity Anisotropy in Lithium-Ion Battery Electrodes," Advanced Energy Materials 4, 1301278 (2014) — doi.org/10.1002/aenm.201301278
- Qi, Harris "In Situ Observation of Strains during Lithiation of a Graphite Electrode," Journal of The Electrochemical Society 157, A741 (2010) — doi.org/10.1149/1.3377130
- Hahn, Buqa, Ruch, Goers et al. "A Dilatometric Study of Lithium Intercalation into Powder-Type Graphite Electrodes," Electrochemical and Solid-State Letters 11, A151 (2008) — doi.org/10.1149/1.2940573
- Downie, Krause, Burns, Jensen, Chevrier, Dahn "In Situ Detection of Lithium Plating on Graphite Electrodes by Electrochemical Calorimetry," Journal of The Electrochemical Society 160, A588–A594 (2013) — doi.org/10.1149/2.049304jes
- Janakiraman, Garrick, Fortier "Review—Lithium Plating Detection Methods in Li-Ion Batteries," Journal of The Electrochemical Society 167, 160552 (2020) — doi.org/10.1149/1945-7111/abd3b8
- Yang, Zhang, Ge, Wang "Fast charging of lithium-ion batteries at all temperatures," Proceedings of the National Academy of Sciences 115, 7266–7271 (2018) — doi.org/10.1073/pnas.1807115115
- Kulkarni, Huang, Thapaliya, Luo, Dai, Zhao "Prospective Life Cycle Assessment of Synthetic Graphite Manufactured via Electrochemical Graphitization," ACS Sustainable Chemistry & Engineering 10, 13607–13618 (2022) — doi.org/10.1021/acssuschemeng.2c02937
- Vegh, Kantor, Amine, Srivastava, Rezayi, Madikere Raghunatha Reddy, Zaghib et al. "Toward Sustainable Anode Materials: LCA of Natural Graphite Processing in Québec," Batteries 12, 68 (2026) — doi.org/10.3390/batteries12020068
- Michelbacher, Ahmed et al. (Idaho National Laboratory, U.S. Department of Energy EERE Vehicle Technologies Office) "Enabling Fast Charging: A Technology Gap Assessment," report (October 2017) — doi.org/10.2172/1466683
- Winter, Besenhard, Spahr, Novák "Insertion Electrode Materials for Rechargeable Lithium Batteries," Advanced Materials 10, 725–763 (1998) — doi.org/10.1002/(SICI)1521-4095(199807)10:10<725::AID-ADMA725>3.0.CO;2-Z
- Goodenough, Park "The Li-Ion Rechargeable Battery: A Perspective," Journal of the American Chemical Society 135, 1167–1176 (2013) — doi.org/10.1021/ja3091438
- International Energy Agency (IEA) "Global EV Outlook 2026," chapter "Electric vehicle batteries," published 20 May 2026 — iea.org
15. Claim-to-source audit
| Claim in the text | Basis | Label |
|---|---|---|
| That the LixC6 (0 ≤ x ≤ 1) phase diagram was determined with lithium/graphite cells and in situ X-ray diffraction; that at x above 0.04 dilute stage 1 and stage 4 coexist, followed by stage 3, the “liquid-like” 2L phase, stage 2 and filled stage 1; and that clear coexistence regions (first-order transitions) were seen except for stage 4 to 3 | Dahn 1991, abstractReference 1 https://doi.org/10.1103/PhysRevB.44.9170 | Sourced |
| That graphite and hard carbon are used in the vast majority of commercial cells; that graphite gives the greatest energy density and hard carbon is said to give high rate capability with lower plating risk; that BatPaC chose synthetic graphite as its standard, with large differences among synthetic, natural and coated-natural graphite, and many manufacturers using proprietary blends of natural and synthetic with hard carbon; that LTO is at about 1.5 V vs Li and forms little SEI; the electrode make-up (foil, bound active material, electrolyte in pores); that electrode thickness is about 100 µm at present, the model's maximum is 100 µm, it corresponds to a graphite electrode balanced to a 3.5 mAh/cm² cathode and is the largest thickness at which ASI measurements were validated; that an OEM described PHEV loadings under 2 mAh/cm²; that beyond 100 µm the fraction of theoretical capacity falls (NCA/graphite, C/1), with starvation of electrolyte salt, remedies of reduced tortuosity or a better-transport electrolyte, and worsening at low temperature; that above 3.4 mAh/cm² the graphite potential approaches plating in a 5C charge pulse (NCA/graphite, those conditions); that fast charging may require a low-loading design with its penalties, not necessarily for LTO or hard carbon; the default N/P values (graphite 1.25, LMO and LFP 1.20, LTO 1.1) and the reason (first-cycle efficiency of about 88%); that the anode binder is water; and that it is the 2012 second edition | Argonne National Laboratory BatPaC report ANL-12/55Reference 2 https://www.osti.gov/biblio/1209682 | Sourced |
| That electrolyte transport limits utilisation of the positive electrode on discharge and that electrolyte transport plus polarisation lead to plating in the graphite electrode on charge; the comparison of experiment and theory; the analytical design criterion; and the guideline that graphite cells should avoid charge current densities near or above about 4 mA/cm² unless additional precautions are taken | Gallagher et al., abstractReference 3 https://doi.org/10.1149/2.0321602jes | Sourced |
| That in cells with 70 µm and 320 µm single-side NMC-based cathodes and graphite anodes, capacity loss was about 6% at C/10 and C/5, and at C/2 37% for thick and 8% for thin electrodes; and that pouch cells with thick electrodes had 19% higher volumetric energy density at C/5 | Singh et al. 2015, abstractReference 4 https://doi.org/10.1149/2.0401507jes | Sourced |
| That doubling electrode thickness lets half the inactive collectors and separators be removed, and that together with aqueous electrode processing and shorter formation time pack price falls from US$502.8 to US$370.3 per kWh-usable (an estimate) | Wood et al. 2015, abstractReference 5 https://doi.org/10.1016/j.jpowsour.2014.11.019 | Sourced |
| That particle shape and fabrication-induced alignment cause tortuosity anisotropy that can affect battery performance (synchrotron X-ray tomography) | Ebner et al., abstractReference 6 https://doi.org/10.1002/aenm.201301278 | Sourced |
| That the volume increase of graphite crystallites on lithiation is accommodated primarily by a decrease in composite porosity, and that the porosity change can affect power yet has been ignored in models | Qi and Harris 2010, abstractReference 7 https://doi.org/10.1149/1.3377130 | Sourced |
| That for all graphites expansion starts well above 0.5 V vs Li, explained by solvent co-intercalation before SEI formation (the Besenhard model); and that in the unsolvated intercalation region the dilation curves show the same staging features as the potential profiles | Hahn et al. 2008, abstractReference 8 https://doi.org/10.1149/1.2940573 | Sourced |
| That from the heat flow of graphite/NMC cells the onset of lithium plating was 336 mAh/g for G25 graphite (Li0.888C6) and 297 mAh/g for MCMB graphite (Li0.804C6); that plated lithium raises reactivity with the electrolyte, affecting coulombic efficiency, parasitic heat and capacity fade; and that plating efficiency was 0.98 (G25) and 0.97 (MCMB) | Downie et al. 2013, abstractReference 9 https://doi.org/10.1149/2.049304jes | Sourced |
| That metallic lithium formation is thermodynamically feasible when the anode surface potential falls below 0 V vs Li/Li⁺, that high current and low temperature raise the chance of plating, and that there are knowledge gaps in determining the plating boundary | Janakiraman et al. 2020, review abstractReference 10 https://doi.org/10.1149/1945-7111/abd3b8 | Sourced |
| That no EV today allows fast charging in cold or cool temperatures because of the risk of lithium plating, and that the authors present an approach enabling 15-minute fast charging even at −50°C while preserving 4,500 cycles (equivalent to over 12 years and over 280,000 miles) | Yang et al. 2018, PNASReference 11 https://doi.org/10.1073/pnas.1807115115 | Sourced |
| That in the Acheson process petroleum coke and similar feedstocks are graphitised at up to about 3000°C for days (3 to 5), and the statement that synthetic graphite is chosen for many LIBs because high-purity natural sources are scarce | Kulkarni et al. 2022, abstractReference 12 https://doi.org/10.1021/acssuschemeng.2c02937 | Sourced |
| That natural graphite goes through mining, flotation, purification, spheronising and heat treatment to battery-grade purity (above 99.95% C), the cited loss of up to 70% of feedstock in spheronising, the introduction's summary of cost and crystal orientation of natural and synthetic graphite (secondary statements), synthetic graphite from petroleum or needle coke and coal tar pitch graphitised at about 2,800 to 3,000°C, and the statement of about 1.2 kg graphite per kWh of cell capacity | Vegh et al. 2026, introduction (secondary statements including cited values)Reference 13 https://doi.org/10.3390/batteries12020068 | Sourced |
| That 350 kW extreme fast charging (XFC) is discussed as recharging in under 10 minutes for about 175 miles, and that XFC packs are expected to be significantly more expensive initially than range-optimised BEV packs | Michelbacher, Ahmed et al. 2017 report, abstractReference 14 https://doi.org/10.2172/1466683 | Sourced |
| That insertion electrode materials are used in most ambient-temperature rechargeable batteries because electrochemical insertion reactions are intrinsically simple and reversible | Winter et al. 1998, abstractReference 15 https://doi.org/10.1002/(SICI)1521-4095(199807)10:10<725::AID-ADMA725>3.0.CO;2-Z | Sourced |
| That the passivation layer formed on the anode robs lithium from the cathode irreversibly on the first charge | Goodenough and Park 2013, abstractReference 16 https://doi.org/10.1021/ja3091438 | Sourced |
| That graphite anodes are among the parts of the supply chain that rely heavily on Chinese manufacturing capacity and expertise | IEA Global EV Outlook 2026Reference 17 https://www.iea.org/reports/global-ev-outlook-2026/electric-vehicle-batteries | Sourced |
| Graphite's (LiC6) theoretical capacity of about 372 mAh/g; the table of areal capacity and thickness (350 mAh/g, 96% active material, 1.5 g/cm³ coating density, porosity about 32%); about 0.96 kg of graphite per kWh; the filling x at full charge by N/P ratio (about 0.94 at 1.00, about 0.86 at 1.10, about 0.78 at 1.20, about 0.75 at 1.25); and the table of current density from C-rate × areal capacity (14 mA/cm² at 3.5 mAh/cm² and 4C, about 3.5 times the guideline) | Our calculation. The Faraday constant of 96,485 C/mol, the molar mass of carbon of 12.01, the reversible capacity of 350 mAh/g (about 94% of theory), the 96% active fraction, the coating density of 1.5 g/cm³, the 2.2 g/cm³ density of the solid part, the 3.7 V average voltage, N/P of 1.25, the exclusion of first-cycle irreversible capacity and the constant current throughout charge are all assumptions made in this article. These are not values of a real cell. The plating onsets of Downie et al. are for that study's graphites and conditions, not a general rule | Our calculation |
| Properties of individual commercial graphites, anode thickness, porosity and N/P ratio in commercial cells, the market share and blend ratio of natural and synthetic graphite, and fast-charge limit values | Not stated in the primary sources opened for this article, so not given | Commentary |
| That graphite is the result of particle design and surface treatment; that flake particles tend to lie flat and the reason for spheronising (an Inference); that the limit of the electrode is transport in the pores; the view that porosity changes with state of charge; the summary that current, temperature and thickness all come down to anode potential; the advice to check that evaluation conditions are reported together (an Inference); and the summary of strengths and challenges | Our summary and commentary based on published content, and an Inference. Not views stated by any company or institution | Commentary |
| That Figs. 1, 2, 3, 4 and 5 are explanatory drawings rather than real observations or design drawings, and that Fig. 6 and the hero image are AI-generated images | Our note | Commentary |
Last updated 10 October 2026. Sources are limited to primary material (abstracts and bibliographic records of peer-reviewed papers, an Argonne National Laboratory report, a U.S. Department of Energy and Idaho National Laboratory report and IEA reports). Because the article includes structural readings and materials-design interpretations, those are marked as Commentary and kept separate from sourced fact. Properties of individual commercial graphites, anode thickness, porosity and N/P ratio in commercial cells, the market share of natural and synthetic graphite and fast-charge limit values are not stated here because no published primary source could be confirmed. Paper values are from abstracts, and conditions (electrode, electrolyte, temperature, type of graphite) differ from paper to paper. The BatPaC values and simulations are the report's assumptions and results under its conditions. The comparison of natural and synthetic graphite is a secondary statement summarised in the introduction of an LCA paper. All figures are explanatory concept graphics. Figs. 1, 2, 3, 4 and 5 are vector drawings; Fig. 6 and the hero image are AI-generated images, and none of them shows a real cross-section, micrograph or physical product.