TECHNOLOGY EXPLAINER
AI Accelerators
- How GPUs, TPUs and NPUs differ in design, and how to read "peak" versus "achieved" performance
Most AI computation is multiplication of very large matrices. AI accelerators exist to do it fast and with little power. But a catalogue figure such as "x PFLOPS" changes meaning completely depending on which precision, whether sparsity is assumed, and whether it is a peak value. Moreover, in inference for today's large language models, memory bandwidth, not arithmetic speed, often sets the pace. This article covers how GPUs, TPUs, NPUs, custom chips and wafer-scale chips differ in design, numerical precision (FP16, FP8, FP4), the memory hierarchy and HBM, why memory bandwidth becomes the bottleneck (the roofline), the difference between peak and achieved performance, and the links to packaging, heat and cooling that a materials engineer will care about, within what could be confirmed in official material.
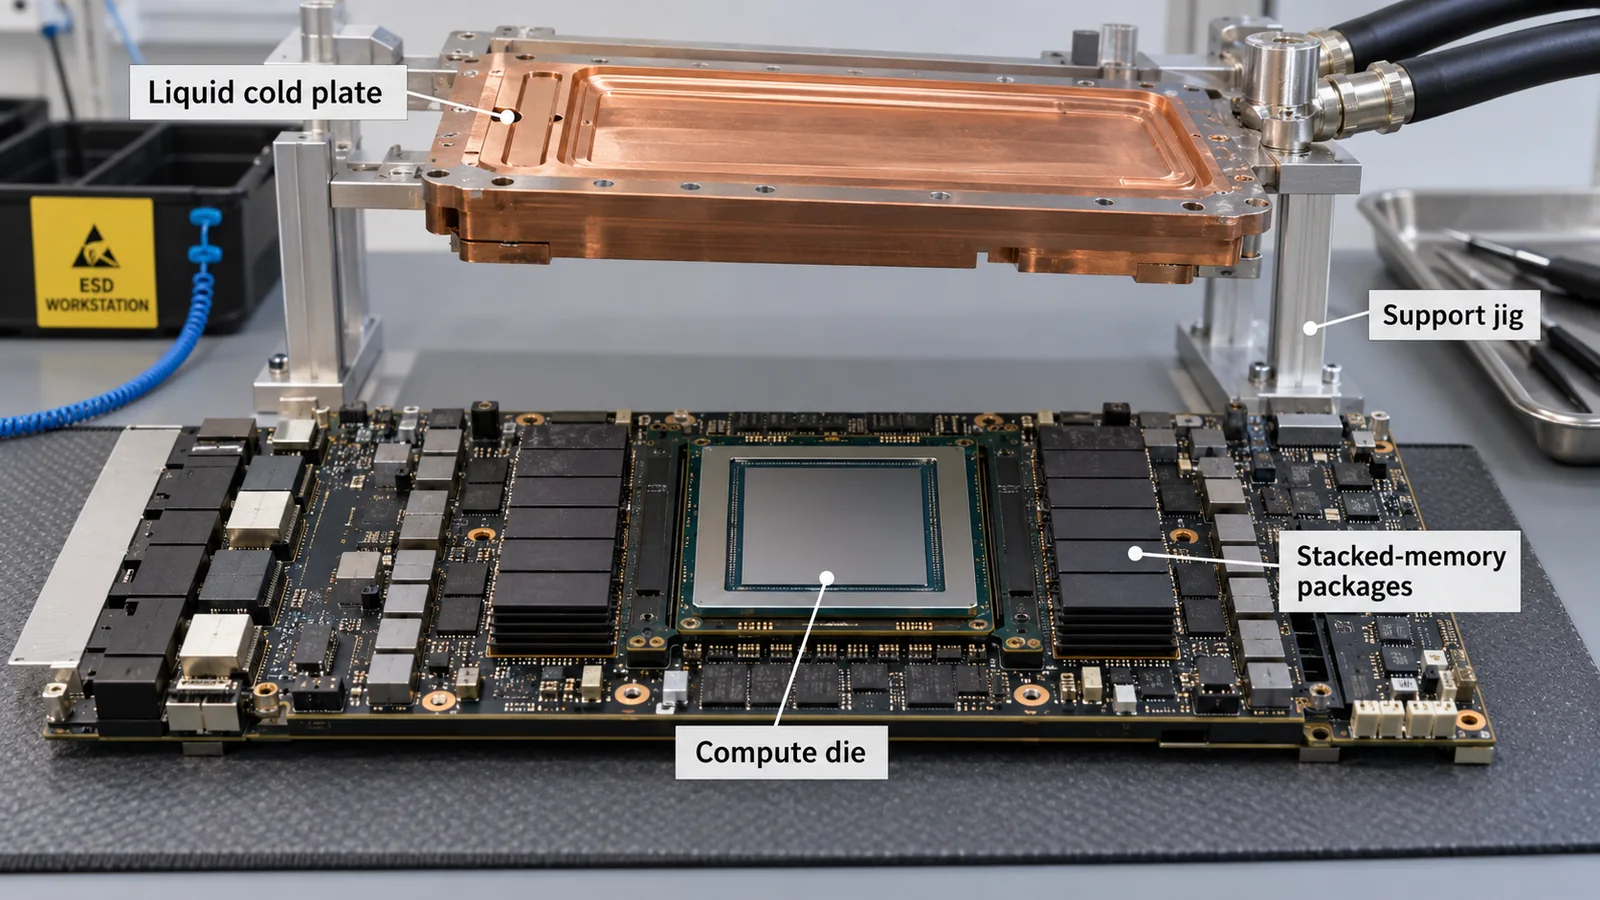
- What is an AI accelerator? (in three points)
- Design families: GPU, TPU, NPU, custom chips, wafer-scale
- Numerical precision: from FP32 to FP16, FP8 and FP4
- The memory hierarchy and HBM
- Why memory bandwidth becomes the bottleneck: the roofline
- Peak versus achieved performance: reading spec sheets and MLPerf
- A materials engineer's view: packaging, heat and cooling
- Limits, and what could not be confirmed
- How to read evaluations and standards
- Glossary
- References (primary sources)
- Claim-to-source audit
Sourced = stated in an official document, paper or standards page (with a link)
Our calculation = a value this article derived from stated assumptions
Not yet confirmed = plans, previews or work in progress for which a final specification or track record could not be confirmed
Interpretation is marked as commentary. Inference appears in bold.
Chip specifications are manufacturers' stated values, and each value differs in precision, whether sparsity is used, whether it is peak or achieved, and shipping status. This article gives conditions with every figure and does not line up values measured under different conditions to rank them. Whether a product is "shipping" or "announced or in preview" is stated only as far as official material and MLCommons' categories show. Individual technologies such as HBM, CoWoS and chiplets have their own explainers in this series.
1. What is an AI accelerator? (in three points)
- A pairing of dedicated matrix-math engines with the memory that feeds them: an AI accelerator lines up units that multiply matrices (such as Tensor Cores) and places fast memory (such as HBM) beside them. NVIDIA describes its Rubin GPU as having 224 streaming multiprocessors, 896 Tensor Cores and 288 GB of HBM4 Sourced [Ref. 1].
- There are several design families: GPUs, TPUs, NPUs for devices, custom chips from cloud operators, and chips that make a whole wafer one die. They differ in what they are built around (Chapter 2).
- "Peak" and "achieved" are different: the peak in a spec sheet is an upper limit when every arithmetic unit is running. Actual speed is set by memory bandwidth, communication and software (Chapters 5 and 6).
A figure in a spec sheet means something only once you read its three conditions: precision, sparsity, and peak versus achieved. The same chip can look several times faster depending on which value is chosen, and if memory bandwidth falls short, that speed is not reached.
2. Design families: GPU, TPU, NPU, custom chips, wafer-scale
| Family | What it is built around (as official material describes it) | Notes for readers |
|---|---|---|
| GPU | NVIDIA describes the Rubin GPU as two reticle-limited compute dies joined in one package by a high-speed die-to-die link, with 224 SMs, 896 Tensor Cores, a large central L2 cache and HBM4 [Ref. 1] | Derived from general-purpose parallel computing, with a deep software base. AI-specific features (Tensor Cores, precision switching) grow each year |
| TPU | The first-generation TPU paper describes an ASIC with a matrix unit of 65,536 8-bit multiply-accumulators (peak 92 TOPS) and 28 MiB of software-managed on-chip memory, and says its deterministic execution model suits response-time requirements [Ref. 3]. TPU7x (Ironwood) has two TensorCores and four SparseCores per chip [Ref. 2]. The TPU v4 paper says its SparseCore speeds up embedding-heavy models by 5x to 7x while using only 5% of die area and power [Ref. 21] | Specialized for matrix math, leaving on-chip memory management to software. Intended for use in the cloud; Google's documentation lists JAX and PyTorch as supported and TensorFlow as not supported [Ref. 2] |
| NPU | A chip for AI processing inside a device SoC. Microsoft describes Copilot+ PCs as a new class of Windows 11 hardware with an NPU that can perform more than 40 trillion operations per second (TOPS) [Ref. 4] | Built for low-power devices, differing from data-center parts in scale and purpose. On-device AI is covered in our explainer on edge and on-device AI |
| Custom chips | AWS describes Trainium3 as having eight large cores with four specialized engines each (Tensor, Vector, Scalar, GPSIMD), 144 GB of HBM3e per chip at 4.9 TB/s, a two-level on-chip SRAM between HBM and the compute engines, and communication cores physically separate from compute [Ref. 5] | Designed by a cloud operator for its own workloads. What is known is limited to what the operator publishes for its own service |
| Wafer-scale | Cerebras describes the WSE-3 Turbo as a chip of 46,225 mm2 with 4 trillion transistors, 900,000 cores and 250 PFLOPS of AI compute. The WSE-3 is said to have 44 GB of on-chip SRAM with 43.2 PB/s of bandwidth [Ref. 6] | The company says it handles yield by designing to withstand defects rather than avoid them (redundant cores and routing, and a structure that routes around faults) |
All Sourced (manufacturers' and operators' stated values, and papers). Parts of the right-hand column that official material does not state are commentary. Cerebras's comparison ("19x the transistors and 56x the compute of the NVIDIA B300") is not used here, because the page does not state the conditions (precision, sparsity) of the comparison.
Rubin uses two compute dies, TPU7x two chiplets (each with its own memory space), and AMD's MI455X compute dies stacked with 3D bonding. Joining several dies in one package, instead of making one large chip, is a direction seen across several families [Refs. 1, 2, 12]. See our explainers on chiplets, CoWoS and heterogeneous integration.
3. Numerical precision: from FP32 to FP16, FP8 and FP4
Much of AI computation can drop digits (bits) without a large loss in result quality. Fewer bits mean less data to read from memory, more arithmetic units in the same area, and more operations per watt, so precision has fallen with each generation.
| Format | Bit layout (sign, exponent, mantissa) | What was confirmed |
|---|---|---|
| FP32, FP16 | 1-8-23 / 1-5-10 | IEEE 754 floating-point formats. FP16 has only five exponent bits and a narrow range; for training, Micikevicius et al. proposed two remedies, keeping an FP32 copy of the weights and loss scaling (reporting nearly halved memory use) [Refs. 8, 20, 24] |
| BF16 (bfloat16) | 1-8-7 | The exponent range matches FP32 and conversion to and from FP32 is simple; Kalamkar et al. report that it needs no hyperparameter tuning to converge. Maximum 3.38e38 [Ref. 8] |
| FP8 (E4M3, E5M2) | 1-4-3 / 1-5-2 | Proposed by Micikevicius et al., who recommend E4M3 for weights and activations and E5M2 for gradients. Maximum values are 448 and 57,344. They report result quality matching 16-bit training, including language models of up to 175B parameters [Ref. 9] |
| FP4 (E2M1) and microscaling | 1-2-1, with a scale per block of 32 (MX) or 16 (NVFP4) elements | The OCP MX specification v1.0 defines MXFP8, MXFP6, MXFP4 and MXINT8. MXFP4 uses an 8-bit scale (E8M0) per 32 elements, which is 4.25 bits per element (our calculation) [Refs. 10, 25]. NVFP4 uses an E4M3 scale per 16 elements plus an FP32 scale for the whole tensor; NVIDIA reports training a 12-billion-parameter model on 10 trillion tokens [Ref. 11] |
All Sourced (the papers and the OCP announcement). The 4.25 bits for microscaling is Our calculation.
After precision, read sparsity and whether it is a peak value
- Structured sparsity: a feature that skips computation by assuming zeros in the matrix. NVIDIA's HGX spec table gives some values as the sparse specification and notes in a footnote that the dense value is half of the sparse value shown [Ref. 7]. AMD's MI355X page lists dense and structured-sparsity values in separate rows (for example, BF16 at 2.5 PFLOPS and 5 PFLOPS) [Ref. 13].
- Conditions mix even within one document: in NVIDIA's Rubin specification, the 50 PFLOPS for NVFP4 "inference" is a sparse value, while 35 PFLOPS for NVFP4 "training", 17.5 PFLOPS for FP8/FP6 and 4 PFLOPS for FP16/BF16 are marked in footnotes as dense [Ref. 7]. Picking only the headline number mixes up sparse and dense.
- Peak values: Google Cloud's TPU7x table gives "peak compute per chip" of 2,307 TFLOPs for BF16 and 4,614 for FP8, but states no sparsity condition in that table [Ref. 2]. Conditions that are not written are treated as not confirmed.
- Movement in standards: IEEE Std 754 (floating-point arithmetic) has a 2019 edition [Ref. 24], and IEEE P3109, which defines narrow-bit-width formats for machine learning, appears on the IEEE SA page as an "Active PAR" (approved 15 February 2023), a project still in development Not yet confirmed [Ref. 26].
Low precision is not automatically safe for every model and layer. The FP4 paper notes challenges for training stability, convergence and implementation, and combines several techniques: random Hadamard transforms, two-dimensional quantization, stochastic rounding, and keeping selected layers in higher precision [Ref. 11]. The quality at lower precision must be checked per model and task (this article does not assess the quality of any specific model).
4. The memory hierarchy and HBM
Data on a chip is kept closer where it is faster and smaller, and farther where it is slower and larger. As an example of the tiers, the TPU7x documentation lists HBM (192 GB at about 7.37 TB/s), on-chip SRAM with far higher bandwidth than HBM (VMEM, a scratchpad managed by software), and host memory over PCIe, and says that managing data movement between the tiers is crucial for performance Sourced [Ref. 2].
- HBM is the tier that gains capacity and bandwidth together: NVIDIA says Rubin has up to 288 GB of HBM4 at up to 22 TB/s and that HBM4 doubles the interface width relative to HBM3e. It frames capacity as serving model residency, long context and the KV cache, and bandwidth as serving token-by-token generation Sourced [Ref. 1]. The structure and standard of HBM (JEDEC's HBM4, April 2025, 2,048 wires, up to 2 TB/s per stack) are covered in our explainer on HBM [Refs. 27, 28].
- SRAM is fast but small: Cerebras says the WSE-3 uses 44 GB of SRAM at 43.2 PB/s [Ref. 6]. Against a GPU's 288 GB of HBM at 22 TB/s, the capacity is about 15% (about 1/6.5, 44 / 288) and the bandwidth about 2,000 times (43,200 / 22, taking 1 PB/s as 1,000 TB/s). This compares stated values of different chips and implies no ranking Our calculation.
- Reducing data movement: FlashAttention is an exact attention algorithm that is aware of IO, counting and reducing reads and writes between a GPU's HBM and on-chip SRAM; it is reported to give a 15% end-to-end speedup when training BERT-large by reducing HBM accesses Sourced [Ref. 19]. It shows that the same computation can run faster simply by using memory differently.
5. Why memory bandwidth becomes the bottleneck: the roofline
Gholami et al. summarize that over the past 20 years peak server compute grew at 3.0x every two years while DRAM bandwidth grew only 1.6x and interconnect bandwidth 1.4x, and they argue that memory bandwidth becomes the main bottleneck, especially for decoder Transformers (text generation) Sourced [Ref. 17]. The roofline draws this relationship. With attainable performance on the vertical axis and "operations per byte of data read" (arithmetic intensity) on the horizontal axis, the left side is capped by memory bandwidth and the right side by the compute peak [Ref. 18].
Generating each token requires reading the model's weights. If weights are read in BF16 (2 bytes per parameter) and each parameter takes two operations (a multiply and an add), the arithmetic intensity is 2 / 2 = 1 FLOP per byte, and with batch size B (the number of requests processed together) it is roughly B FLOP per byte (an idealization counting weights only) Our calculation.
| Condition (example from TPU7x stated values) | Attainable ceiling (our calculation) | Share of peak |
|---|---|---|
| Batch 1 (BF16, intensity 1) | 7.4 TFLOPS | 0.3% |
| Batch 32 (intensity 32) | 236 TFLOPS | 10.2% |
| Batch 256 (intensity 256) | 1,889 TFLOPS | 81.9% |
| Ridge point | about 313 FLOP/byte (BF16), about 625 (FP8) | - |
All Our calculation, from the values Google Cloud states for TPU7x (BF16 2,307 TFLOPS, FP8 4,614 TFLOPS, HBM 7,380 GB/s) [Ref. 2]: ridge point = peak / bandwidth, ceiling = bandwidth x intensity. An idealization that excludes the KV cache, activations and communication; not a speed on real hardware.
Another view: a ceiling on token generation
Suppose a dense model of 70 billion parameters whose weights all sit in the chip's HBM, generating at batch 1. Each token reads all the weights once, so the ceiling is bandwidth divided by weight size Our calculation. With TPU7x's 7.38 TB/s:
- BF16 (140 GB of weights): about 52.7 tokens per second
- FP8 (70 GB): about 105 tokens per second
- 4-bit (35 GB, ignoring scales): about 211 tokens per second
Lowering precision cuts the bytes read, so the ceiling in the memory-bound regime rises in inverse proportion to precision (the quality at lower precision must be checked separately). Raising the batch lets several requests share one read of the weights, so total tokens per chip increase. Conversely, a long context and a large KV cache add reads beyond the weights and lower the ceiling (illustrative assumptions, not values for any particular model or hardware). Inference optimization is covered in our explainer on inference optimization and serving.
6. Peak versus achieved performance: reading spec sheets and MLPerf
(1) Reading the spec sheet with its conditions
The table below transcribes values from official manufacturer and operator pages with their conditions. Because values under different conditions sit side by side, no ranking between rows or columns should be read from it.
| Chip (status) | Compute peak (as stated; precision and sparse/dense) | Memory (capacity, bandwidth) | Power | How to read this row |
|---|---|---|---|---|
| NVIDIA H100 SXM (Hopper; listed on the product page) [Ref. 14] | BF16 1,979 TFLOPS, FP8 3,958 TFLOPS (both with sparsity; the page notes "With sparsity") | 80 GB (HBM3), 3.35 TB/s | TDP up to 700 W (configurable) | The dense values are not on the page. FP4 does not appear in the page's list of precisions |
| NVIDIA B200 (Blackwell; the page says HGX B200 is "shipping") [Refs. 7, 16] | Published for 8 GPUs combined: FP16/BF16 36 PFLOPS and FP8/FP6 72 PFLOPS (both sparse; dense is half), FP4 144 (sparse) | 72 (dense) PFLOPS. Per GPU (/ 8): BF16 4.5 (sparse) / 2.25 (dense), FP8 9 / 4.5, FP4 18 / 9 PFLOPS Our calculation | DGX B200 has 1,440 GB and 64 TB/s for 8 GPUs (180 GB and 8 TB/s per GPU Our calculation). The GB200 NVL72 page gives 372 GB and 16 TB/s per two GPUs [Ref. 15] | About 14.3 kW maximum for the whole DGX B200 system (air-cooled; includes CPUs and more) | A TDP for a single GPU could not be confirmed. System power divided by 8 is not the power of a GPU alone |
| NVIDIA Rubin (HGX Rubin NVL8; in the "preview" category in MLPerf Inference v6.1) [Refs. 7, 23] | Per GPU: NVFP4 inference 50 PFLOPS (sparse); NVFP4 training 35, FP8/FP6 training 17.5, FP16/BF16 4 PFLOPS (all dense) | 288 GB (HBM4), 22 TB/s | GPU-alone power could not be confirmed. Inlet liquid temperature 45 C (HGX page) | Inference is sparse and training is dense in the same table. These are announced or preview-stage values; shipping status could not be confirmed Not yet confirmed |
| AMD Instinct MI355X (CDNA 4; launch date on the page is 12 June 2025) [Ref. 13] | BF16 2.5 (dense) / 5 (structured sparsity), FP8 5 (dense) / 10.1 (sparsity), MXFP4 10.1 PFLOPS (no sparse/dense distinction stated) | 288 GB (HBM3E), 8 TB/s | TBP 1,400 W | Whether the MXFP4 value is sparse or dense is not stated on the page |
| Google TPU7x (Ironwood; listed in Google Cloud documentation) [Ref. 2] | Peak per chip: BF16 2,307, FP8 4,614 TFLOPs (no sparsity condition stated) | 192 GiB (HBM), 7,380 GB/s; chip-to-chip 1,200 GB/s (bidirectional) | Not stated | A pod has 9,216 chips. Intended for use in the cloud, not sold as a standalone chip |
| AWS Trainium3 (offered as UltraServers, per the company page) [Ref. 5] | 362 PFLOPs MXFP8 per UltraServer (144 chips), or about 2.5 PFLOPS per chip Our calculation (no sparsity statement) | 144 GB (HBM3e) per chip, 4.9 TB/s | Not stated | A standalone per-chip compute peak could not be confirmed |
| Cerebras WSE-3 Turbo (company page) [Ref. 6] | 250 PFLOPS (precision and sparsity not stated) | WSE-3: on-chip SRAM 44 GB, 43.2 PB/s | Not stated | The company's "x times other vendors" comparison states no conditions and is not usable |
All Sourced (manufacturers' and operators' stated values). Values marked Our calculation (/ 8, / 144) are rough figures from dividing whole-system values by counts. TDP (thermal design power), TBP (typical board power) and system power are not the same quantity.
What the table shows is that what counts as "peak" differs by company and product: some give only sparse values, some separate dense and sparse, some use sparse for inference and dense for training, and some state no conditions. This article treats unstated conditions as "not confirmed" and makes no row-to-row comparison.
NVIDIA's H100 page, citing third-party SemiAnalysis InferenceX (as of April 2026), says H100 inference costs about US$0.09 per million tokens (GPT-OSS-120B, vLLM, 66 TPS per user) and B200 about US$0.02 (same model, TensorRT-LLM, 55 TPS per user), roughly 4.5x cheaper. The software (vLLM versus TensorRT-LLM) and the per-user speed differ, as the page's own wording shows, so this is not a comparison that isolates the chip Sourced [Ref. 14]. Comparisons on a manufacturer's page should be read after checking their conditions.
(2) Achieved performance: MLPerf
MLCommons' MLPerf compares speeds actually measured on common tasks, not peaks. For MLPerf Training v6.0, published on 16 June 2026, the announcement says 24 organizations submitted 95 systems using 13 types of accelerators, two tasks were added (DeepSeek V3, 671B total and 37B active parameters per token, and GPT-OSS 20B, 21B total and 3.6B active), and several FP4 recipes appeared Sourced [Ref. 22]. MLPerf Inference v6.1, published on 16 September 2026, had a record 30 participating organizations, a largest submitted configuration of 512 accelerators, and new RAG and edge agentic tasks. The same announcement classifies AMD Instinct MI350P and others as "available" and NVIDIA's Rubin and Vera Rubin NVL72 as "preview" Sourced [Ref. 23].
- Only submissions that meet an accuracy bar are comparable: the MLPerf Training announcement explains that submissions must meet an accuracy threshold, which is why performance differences from hardware and implementation choices can be compared fairly [Ref. 22].
- Read the category and system configuration: a result changes meaning with the accelerator type, the number of units, the software, and whether it is "available" (purchasable) or "preview" (expected by the next round) [Ref. 23]. This article reports only the "available / preview" categories it could confirm (details of the closed and open divisions were not checked).
- Beware comparisons across versions: the headline improvements in the Inference v6.1 announcement (5.7x for DeepSeek-R1 against v5.1 a year earlier, 2.99x for VLM against v6.0) compare best results from different versions, not identical configurations under identical conditions (this article's caution; the figures are from MLCommons' announcement) [Ref. 23].
- Differences from manufacturers' own comparisons: NVIDIA says Rubin delivers up to 10x more agentic throughput per unit of energy than Blackwell, but that measurement uses an internal 2-trillion-parameter MoE workload under the company's own conditions [Ref. 1]. Read it separately from MLPerf submissions.
7. A materials engineer's view: packaging, heat and cooling
View original SVG, values and source annotations
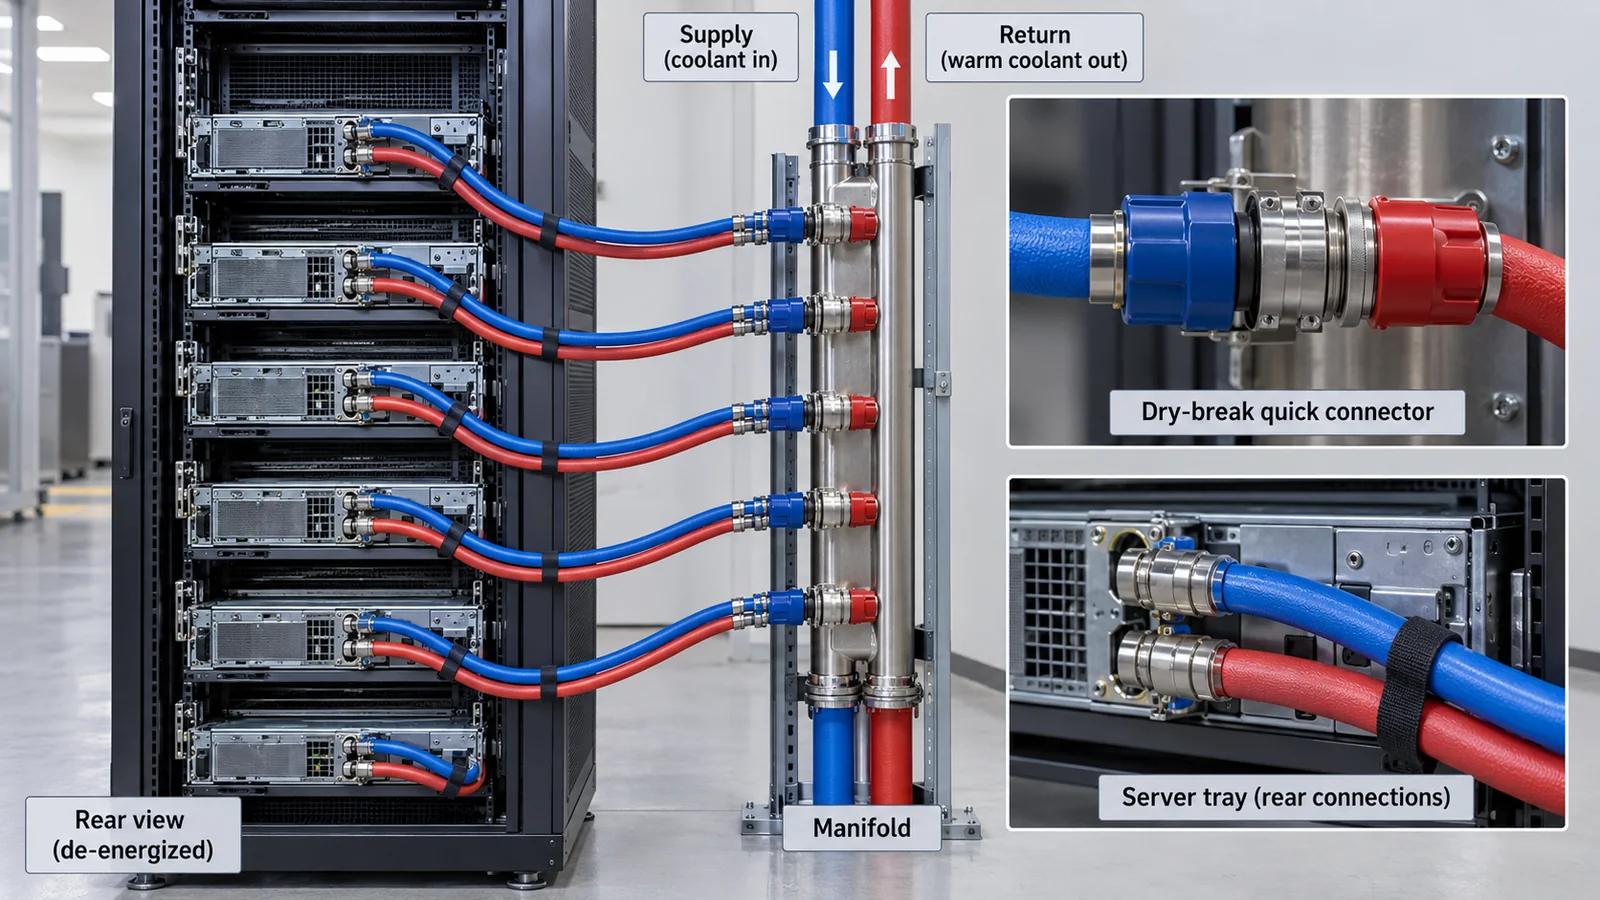
Lined up, the stated figures show power levels moving a long way across generations. The H100 SXM's TDP is up to 700 W [Ref. 14] and the MI355X's TBP is 1,400 W [Ref. 13], twice as much Our calculation (TDP and TBP are defined differently, so this is not a strict comparison). The air-cooled 8-GPU system DGX B200 is up to about 14.3 kW [Ref. 16], or about 1.8 kW per GPU slot Our calculation (an upper bound that includes CPUs, networking and fans). NVIDIA's Rubin rack (Vera Rubin NVL72) is described as relying on liquid cooling with a 45 C inlet [Refs. 1, 7].
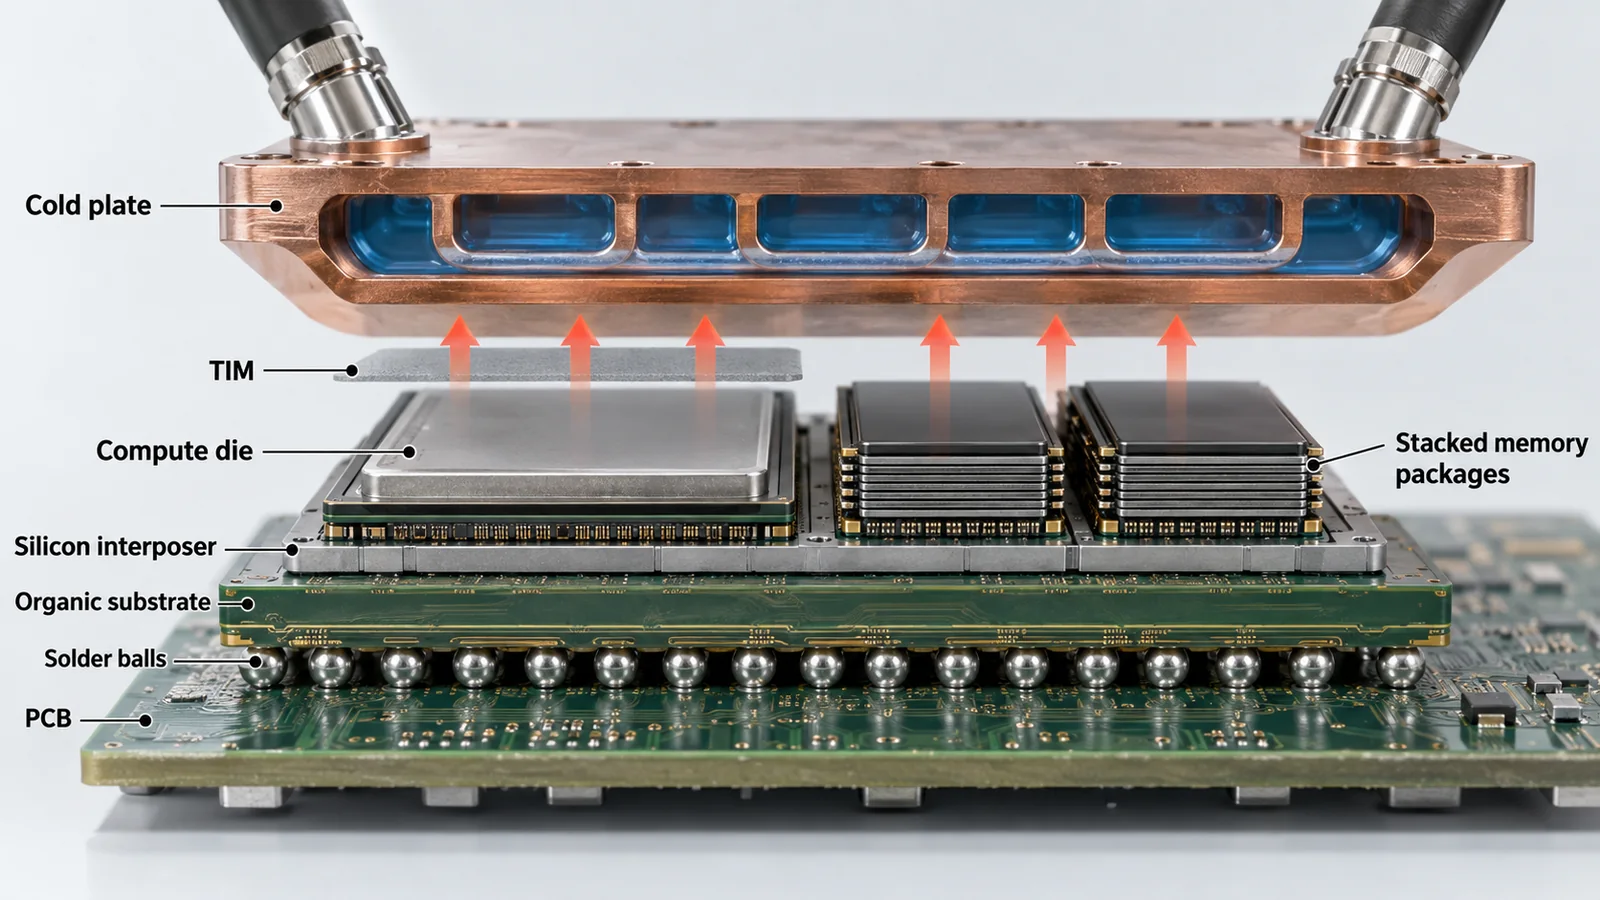
For materials, this means the thermal resistance of the heat path from die to cold plate (the layers in Fig. 6) directly sets the allowable power and operating temperature. Each layer is a material interface, and the thermal interface material (TIM) is the layer that fills the gap between die and plate. As power rises, the thermal resistance of the TIM and its reliability under temperature cycling, such as pump-out, matter more (commentary by this article; the performance of specific materials is not assessed here). TIM is covered in our explainer on thermal interface materials, and data centers including cooling in our explainer on power and cooling for AI data centers.
As Chapter 2 showed, several families are heading toward joining multiple dies and HBM in one package rather than one large die. Rubin has two compute dies [Ref. 1], TPU7x two chiplets [Ref. 2], and AMD's MI455X is described as joining 3D hybrid-bonded compute dies and 12 stacks of HBM4 (432 GB, 23.3 TB/s) in a CoWoS-L package Sourced [Ref. 12].
This means that the substrates and interposers for wiring, the bonds between dies, the stacking of memory, the encapsulation, and the materials that carry heat away become part of an AI accelerator's performance. The more layers there are, the more warpage from differences in thermal expansion, the reliability of the joints, and the resistance of the heat path become design constraints (commentary by this article; Inference: which material limits which generation could not be confirmed from public material). The individual technologies are covered in our explainers on HBM, CoWoS, chiplets and heterogeneous integration.
8. Limits, and what could not be confirmed
(1) Coverage of specifications
This article transcribes some of the values on official pages as of the confirmation date and is not a survey of all products. A product's absence does not mean it is inferior, and products are not ranked.
(2) Values without stated conditions
For values whose sparsity or precision conditions are not written (parts of TPU7x, Trainium3 and Cerebras), conditions were not inferred and are shown as "not stated". Where power is not stated, it is treated as not confirmed.
(3) Shipping and availability
Rubin is at a stage MLCommons classifies as "preview", and its availability could not be confirmed. For announced products such as MI455X, no shipment record was checked.
(4) Achieved performance
Per-submission MLPerf scores are not given, because configurations, software and versions differ and cannot be lined up. The roofline calculation is an idealization from stated peak values.
(5) Materials-level assessment
The performance of TIMs, substrates and interposers, and which material is rate-limiting, could not be confirmed from official material and is not assessed.
(6) Texts of standards
The texts of IEEE 754, IEEE P3109 and the OCP MX specification were not checked (only titles, status and scope of the proposals).
- There are several design families: GPU, TPU, NPU, custom chips and wafer-scale. Joining several dies in one package is a direction seen across them Sourced
- Precision has fallen from FP32 to FP16/BF16, FP8 and FP4. One must read as far as sparsity and per-block scaling Sourced
- Text generation tends to be limited by memory bandwidth. With TPU7x's stated values, the batch-1 ceiling is about 0.3% of peak and the ridge point is about 313 FLOP/byte for BF16 Our calculation
- Read spec-sheet numbers with their precision, sparse/dense and peak/achieved conditions, and never rank values under different conditions. MLPerf is a measurement with an accuracy threshold, but its version, category and configuration must be read Sourced
- As power rises, the layers that conduct heat become the performance. From up to 700 W for the H100 to 1,400 W for the MI355X Sourced
9. How to read evaluations and standards
The performance of an AI accelerator is evaluated along four lines: (1) stated peak performance (with its precision and sparsity conditions), (2) achieved performance on common tasks (MLPerf), (3) conformance to standards for number formats, memory and so on, and (4) power and cooling conditions. Line 1 is the manufacturer's own statement rather than a standard, line 2 is MLCommons' results, and line 3 involves standards from IEEE, OCP and JEDEC. As of the confirmation date (15 October 2026) we could not confirm a finalized international standard that defines how peak performance is to be stated.
| What is evaluated | Representative benchmarks and methods (name, source) | Standards and guidance (IEEE, OCP, JEDEC, ISO/IEC and so on) | Notes on reading |
|---|---|---|---|
| Stated peak performance Sourced | Each company's spec sheet (NVIDIA, AMD, Google Cloud, AWS, Cerebras) [Refs. 2, 5-7, 13-16] | No finalized international standard on how to state it could be confirmed | Check precision, sparse/dense, peak versus achieved, and chip versus system for each value (Chapters 3 and 6). These are manufacturers' stated values, not third-party measurements |
| Achieved performance (training and inference) Sourced | MLPerf Training v6.0 (16 June 2026) [Ref. 22]. MLPerf Inference v6.1 (16 September 2026) [Ref. 23]. Both published by MLCommons | MLPerf is a benchmark of the industry consortium MLCommons, not an ISO/IEC or IEEE standard | Only submissions meeting the accuracy threshold are comparable. Read the category (available / preview), number of units, software and version. Improvement rates across versions are not like-for-like. Do not use results to assert hardware superiority |
| Number formats SourcedNot yet confirmed | The FP8 format proposal (arXiv 2209.05433) [Ref. 9]. The BF16 study (arXiv 1905.12322) [Ref. 8]. The MX formats evaluation (arXiv 2310.10537) [Ref. 10]. NVFP4 training (arXiv 2509.25149) [Ref. 11] | IEEE Std 754-2019 "IEEE Standard for Floating-Point Arithmetic" [Ref. 24]. OCP "Microscaling Formats (MX) Specification v1.0" (OCP announcement of 17 October 2023; MXFP8, MXFP6, MXFP4, MXINT8) [Ref. 25]. IEEE P3109 "Standard for Arithmetic Formats for Machine Learning" (Active PAR, approved 15 February 2023, in development) [Ref. 26] | Details of FP8 (E4M3/E5M2) and NVFP4 may be led by vendors' and proposers' specifications. IEEE P3109 is in development and not a final requirement. The texts of the standards were not checked |
| Memory (HBM) Sourced | Manufacturers' stated values (in this article NVIDIA, AMD and Google) | The JEDEC HBM4 standard JESD270-4 (published April 2025; 2,048 wires; up to 2 TB/s per stack). JESD270-4A (Version 1.1, December 2025) [Refs. 27, 28] | The JEDEC figures are a compatibility baseline, and products can exceed them. HBM details are in our explainer on HBM |
| Power and cooling Sourced | Stated TDP, TBP and system power [Refs. 13, 14, 16]. NVIDIA describes liquid cooling of the Rubin rack with a 45 C inlet [Refs. 1, 7] | No finalized international standard that defines how power is stated or the liquid-cooling conditions could be confirmed in this article | TDP, TBP and maximum system power are different quantities. Rack and data-center power and cooling are in our explainer on power and cooling for AI data centers |
The arrangement of the table is Our calculation (editing by this article). The standards' texts were not checked, so no requirements are described.
Notes on reading
- Benchmark values change with settings and evaluator. An MLPerf result is a value tied to its configuration, software, version and category. A manufacturer's own "x times" is a value under the workload and conditions the company chose, to be read separately from MLPerf submissions.
- Watch for saturation and contamination. MLPerf updates its tasks to match current workloads (this round added MoE models and RAG and agentic tasks) [Refs. 22, 23]. Results on old tasks may not represent the latest workloads.
- A "standard", an "industry-consortium specification" and a "manufacturer's stated value" are different things. IEEE 754 is a standard, OCP MX is a consortium specification, IEEE P3109 is in development, MLPerf is a consortium benchmark, and spec sheets are manufacturers' statements. None of them is itself law.
- Declared versus measured. The peak PFLOPS is an upper limit for when every arithmetic unit runs and data arrives in time. Actual speed is set by memory bandwidth, communication and software (Chapter 5).
10. Glossary
- GPU / TPU / NPU
- A chip derived from general parallel computing / Google's matrix-specialized chip / an AI engine for devices.
- Tensor Core
- A dedicated unit in NVIDIA GPUs that performs matrix multiply-accumulate.
- FP8 / FP4
- 8-bit and 4-bit floating point, written as E4M3 and so on by exponent and mantissa bits.
- BF16
- A 16-bit format with the same exponent range as FP32.
- Microscaling (MX, NVFP4)
- Keeping a scale per block of elements so that narrow formats retain range.
- Sparsity
- A feature that skips computation on zeros. The dense value is often half the sparse value.
- Peak / achieved performance
- An upper limit with every unit running / the speed actually measured.
- HBM
- High bandwidth memory: stacked DRAM placed beside the chip.
- SRAM / KV cache
- Fast, small on-chip memory / the record of past attention that accumulates during text generation.
- Roofline
- A plot of attainable performance versus arithmetic intensity, with a memory ceiling and a compute ceiling.
- Arithmetic intensity
- Operations per byte of data read (FLOP/byte).
- TDP / TBP
- Thermal design power / typical board power. Definitions differ by manufacturer.
- MLPerf
- MLCommons' benchmark on common tasks, with an accuracy threshold.
- TOPS / FLOPS
- Operations per second (integer / floating point).
11. References (primary sources)
- NVIDIA "Inside NVIDIA Rubin GPU Architecture: Powering the Era of Agentic AI", NVIDIA Technical Blog (21 July 2026) — developer.nvidia.com/blog/inside-nvidia-rubin-gpu-architecture-powering-the-era-of-agentic-ai/
- Google Cloud "TPU7x (Ironwood)", Cloud TPU documentation — docs.cloud.google.com/tpu/docs/tpu7x
- Jouppi N. P. et al. "In-Datacenter Performance Analysis of a Tensor Processing Unit", arXiv:1704.04760 — arxiv.org/abs/1704.04760
- Microsoft "Copilot+ PCs developer guide" (Microsoft Learn) — learn.microsoft.com/en-us/windows/ai/npu-devices/
- AWS "AI Accelerator - AWS Trainium" — aws.amazon.com/ai/machine-learning/trainium/
- Cerebras "Cerebras WSE-3 Turbo | Wafer-Scale AI Chip" — www.cerebras.ai/chip
- NVIDIA "NVIDIA HGX Platform" (specifications of HGX Rubin NVL8, B300 and B200) — www.nvidia.com/en-us/data-center/hgx/
- Kalamkar D. et al. "A Study of BFLOAT16 for Deep Learning Training", arXiv:1905.12322 — arxiv.org/abs/1905.12322
- Micikevicius P. et al. "FP8 Formats for Deep Learning", arXiv:2209.05433 — arxiv.org/abs/2209.05433
- Rouhani B. D. et al. "Microscaling Data Formats for Deep Learning", arXiv:2310.10537 — arxiv.org/abs/2310.10537
- NVIDIA et al. "Pretraining Large Language Models with NVFP4", arXiv:2509.25149 — arxiv.org/abs/2509.25149
- AMD "AMD Instinct MI400 Series GPUs" — www.amd.com/en/products/accelerators/instinct/mi400.html
- AMD "AMD Instinct MI355X GPUs" — www.amd.com/en/products/accelerators/instinct/mi350/mi355x.html
- NVIDIA "H100 GPU" — www.nvidia.com/en-us/data-center/h100/
- NVIDIA "GB200 NVL72" — www.nvidia.com/en-us/data-center/gb200-nvl72/
- NVIDIA "DGX B200: The Foundation for Your AI Factory" — www.nvidia.com/en-us/data-center/dgx-b200/
- Gholami A. et al. "AI and Memory Wall", arXiv:2403.14123 — arxiv.org/abs/2403.14123
- Williams S. et al. "Roofline: An Insightful Visual Performance Model for Multicore Architectures", Commun. ACM 52(4), 65-76 (2009), DOI 10.1145/1498765.1498785 — doi.org/10.1145/1498765.1498785
- Dao T. et al. "FlashAttention: Fast and Memory-Efficient Exact Attention with IO-Awareness", arXiv:2205.14135 — arxiv.org/abs/2205.14135
- Micikevicius P. et al. "Mixed Precision Training", arXiv:1710.03740 — arxiv.org/abs/1710.03740
- Jouppi N. P. et al. "TPU v4: An Optically Reconfigurable Supercomputer for Machine Learning with Hardware Support for Embeddings", arXiv:2304.01433 — arxiv.org/abs/2304.01433
- MLCommons "MLCommons Releases MLPerf Training v6.0 Results" (16 June 2026) — mlcommons.org/2026/06/mlperf-training-v6-0-results/
- MLCommons "MLCommons Sets Participation Record with New MLPerf Inference v6.1 Benchmark Results" (16 September 2026) — mlcommons.org/2026/09/mlperf-inference-v6-1-results/
- IEEE "IEEE Standard for Floating-Point Arithmetic" (IEEE Std 754-2019) — doi.org/10.1109/IEEESTD.2019.8766229
- Open Compute Project "AMD, Arm, Intel, Meta, Microsoft, NVIDIA, and Qualcomm Standardize Next-Generation Narrow Precision Data Formats for AI" (OCP Microscaling Formats (MX) Specification v1.0) (17 October 2023) — opencompute.org/news/…narrow-precision-data-formats-for-ai/
- IEEE SA "Standard for Arithmetic Formats for Machine Learning" (P3109) (Active PAR, approved 2023-02-15) — standards.ieee.org/ieee/3109/11165/
- JEDEC "JEDEC and Industry Leaders Collaborate to Release JESD270-4 HBM4 Standard" (April 2025) — jedec.org/news/pressreleases/…jesd270-4-hbm4-standard-advancing
- JEDEC "High Bandwidth Memory (HBM4) DRAM", JESD270-4A (Version 1.1, December 2025) — www.jedec.org/standards-documents/docs/jesd270-4a
12. Claim-to-source audit
| Claim in the text | Basis | Category |
|---|---|---|
| Rubin GPU configuration (336B transistors, 224 SMs, 896 Tensor Cores, two reticle-limited dies, HBM4 288 GB at 22 TB/s, NVLink 6 at 3.6 TB/s, NVLink-C2C 1.8 TB/s, PCIe Gen6 x16 256 GB/s, 45 C liquid cooling, the roles of capacity and bandwidth, and that the up-to-10x claim rests on an internal 2T-parameter MoE workload) | NVIDIA technical blog (21 July 2026) Reference 1 https://developer.nvidia.com/blog/inside-nvidia-rubin-gpu-architecture-powering-the-era-of-agentic-ai/ | Sourced |
| TPU7x (BF16 2,307 and FP8 4,614 TFLOPs, HBM 192 GiB at 7,380 GB/s, ICI 1,200 GB/s, 9,216 chips per pod, 2 TensorCores and 4 SparseCores, two chiplets, memory hierarchy, JAX and PyTorch support), the first TPU (65,536 8-bit MACs, 92 TOPS, 28 MiB) and the TPU v4 SparseCore | Google Cloud documentation and the TPU papers Reference 2 https://docs.cloud.google.com/tpu/docs/tpu7x Reference 3 https://arxiv.org/abs/1704.04760 Reference 21 https://arxiv.org/abs/2304.01433 | Sourced |
| The Copilot+ PC NPU requirement (over 40 TOPS), the Trainium3 configuration (8 cores, 144 GB HBM3e, 4.9 TB/s, 362 MXFP8 PFLOPs, 20.7 TB and 706 TB/s for a 144-chip UltraServer), Cerebras WSE-3 Turbo (46,225 mm2, 4 trillion transistors, 900,000 cores, 250 PFLOPS), WSE-3 SRAM of 44 GB at 43.2 PB/s, and the defect-tolerant design | Official Microsoft, AWS and Cerebras pages Reference 4 https://learn.microsoft.com/en-us/windows/ai/npu-devices/ Reference 5 https://aws.amazon.com/ai/machine-learning/trainium/ Reference 6 https://www.cerebras.ai/chip | Sourced |
| HGX B300 / B200 specifications (FP4 sparse | dense; FP8 and FP16 given as sparse with dense at half; total memory; NVLink), per-GPU HGX Rubin NVL8 specifications (NVFP4 inference 50 PFLOPS [sparse], training 35, FP8/FP6 17.5, BF16 4 PFLOPS [dense]; 288 GB at 22 TB/s; 45 C inlet), and the note that HGX B200 is shipping | NVIDIA HGX page Reference 7 https://www.nvidia.com/en-us/data-center/hgx/ | Sourced |
| H100 SXM specifications (BF16 1,979 and FP8 3,958 TFLOPS with sparsity, 80 GB, 3.35 TB/s, TDP up to 700 W, NVLink 900 GB/s) and the cost comparison (different software and per-user speed) | NVIDIA H100 page Reference 14 https://www.nvidia.com/en-us/data-center/h100/ | Sourced |
| GB200 NVL72 memory (372 GB and 16 TB/s per two GPUs) and DGX B200 (1,440 GB and 64 TB/s for 8 GPUs, about 14.3 kW maximum) | NVIDIA product pages Reference 15 https://www.nvidia.com/en-us/data-center/gb200-nvl72/ Reference 16 https://www.nvidia.com/en-us/data-center/dgx-b200/ | Sourced |
| MI355X specifications (BF16 2.5 / 5, FP8 5 / 10.1, MXFP4 10.1 PFLOPS, 288 GB HBM3E, 8 TB/s, TBP 1,400 W, launch date 12 June 2025) and MI455X (432 GB HBM4 at 23.3 TB/s, 12 stacks, CoWoS-L, 3D hybrid-bonded compute dies) | AMD product pages Reference 12 https://www.amd.com/en/products/accelerators/instinct/mi400.html Reference 13 https://www.amd.com/en/products/accelerators/instinct/mi350/mi355x.html | Sourced |
| Bit layouts and maximum values (FP32 1-8-23, FP16 1-5-10, BF16 1-8-7, FP8 E4M3 max 448 and E5M2 max 57,344, representable FP4 E2M1 values) and mixed-precision training (an FP32 copy of the weights and loss scaling) | The papers Reference 8 https://arxiv.org/abs/1905.12322 Reference 9 https://arxiv.org/abs/2209.05433 Reference 11 https://arxiv.org/abs/2509.25149 Reference 20 https://arxiv.org/abs/1710.03740 | Sourced |
| MX formats (block of 32, E8M0 scale, MXFP8, MXFP6, MXFP4, MXINT8), NVFP4 (block of 16, E4M3 scale, tensor-level FP32 scale, 12B parameters on 10T tokens), the title of IEEE Std 754-2019, the date of OCP MX Specification v1.0, and the status of IEEE P3109 | Papers and IEEE and OCP pages Reference 10 https://arxiv.org/abs/2310.10537 Reference 11 https://arxiv.org/abs/2509.25149 Reference 24 https://doi.org/10.1109/IEEESTD.2019.8766229 Reference 25 http://www.opencompute.org/news/amd-arm-intel-meta-microsoft-nvidia-and-qualcomm-standardize-next-generation-narrow-precision-data-formats-for-ai/ Reference 26 https://standards.ieee.org/ieee/3109/11165/ | Sourced |
| The memory wall (over 20 years peak compute grew 3.0x per two years versus 1.6x for DRAM bandwidth and 1.4x for interconnect), the roofline idea, and FlashAttention (fewer HBM-SRAM reads and writes, 15% speedup on BERT-large) | The papers Reference 17 https://arxiv.org/abs/2403.14123 Reference 18 https://doi.org/10.1145/1498765.1498785 Reference 19 https://arxiv.org/abs/2205.14135 | Sourced |
| MLPerf Training v6.0 (16 June 2026; 24 organizations, 95 systems, 13 accelerator types; DeepSeek V3 and GPT-OSS 20B added; several FP4 recipes; accuracy threshold) and MLPerf Inference v6.1 (16 September 2026; 30 organizations; up to 512 accelerators; RAG and Edge Agentic added; available and preview categories) | MLCommons announcements Reference 22 https://mlcommons.org/2026/06/mlperf-training-v6-0-results/ Reference 23 https://mlcommons.org/2026/09/mlperf-inference-v6-1-results/ | Sourced |
| The JEDEC HBM4 standard (JESD270-4, April 2025, 2,048 bits, up to 2 TB/s) and JESD270-4A (Version 1.1, December 2025) | JEDEC pages Reference 27 https://www.jedec.org/news/pressreleases/jedec%C2%AE-and-industry-leaders-collaborate-release-jesd270-4-hbm4-standard-advancing Reference 28 https://www.jedec.org/standards-documents/docs/jesd270-4a | Sourced |
| The comparison of power levels (1,400 W for MI355X against 700 W for H100, 2x; about 14.3 kW / 8 = about 1.8 kW for DGX B200), the roofline numbers (ridge points about 313 and 625; ceilings of 7.4, 236 and 1,889 TFLOPS by batch), token-generation ceilings (52.7, 105 and 211 tokens per second), 43,200 / 22, 44 / 288, 4.25 bits for MXFP4, and the per-GPU conversions (/ 8, / 144) | Our calculation. An idealization from stated values counting weights only, excluding KV cache and communication; TDP and TBP are defined differently | Our calculation |
| Rankings between chips, values with no stated conditions, shipment records, materials-level evaluation, per-submission MLPerf scores, and the texts of standards | Not checked within this article's scope, or omitted to avoid asserting rankings | Commentary |
| The readings that "as power rises, the heat-conducting layers become the performance" and that "several dies and memories are joined by materials", the remarks on TIM reliability, the grouping of design families and the organization of the figures | This article's organization and commentary based on published material; not views stated by any company | Commentary |
| That Figs. 2 to 6 are explanatory drawings, not real product structures or data, and that Figs. 1 and 7 are AI-generated images | Note by this article | Commentary |
Last updated: 15 October 2026 / Sources are limited to primary material (official NVIDIA, AMD, Google Cloud, AWS, Cerebras and Microsoft material, MLCommons announcements, arXiv papers, and IEEE, OCP and JEDEC pages). The texts of the standards were not checked. This field moves fast, and specifications, shipping status and versions are those of the confirmation date (15 October 2026). Rankings between chips, values with no stated conditions, materials-level assessment, per-submission MLPerf scores and the texts of standards are not given, either because they could not be confirmed or to avoid asserting superiority. Figs. 2 to 6 are vector drawings and Figs. 1 and 7 are AI-generated images; none of them depicts a real facility, product or measurement result.