TECHNOLOGY EXPLAINER
Power and Cooling for AI Data Centers
— reading "how many MW" and "how many kW per rack" with the definitions aligned
AI computing produces far more power and heat at every scale, from one server to one rack to one building. Terms that used to belong to facility engineers, such as IT load versus utility capacity, PUE, the line between air and liquid cooling, and the copper, coolants, piping and seals used in cooling, have become part of the cost of AI computing. Using reports from the IEA and the U.S. Department of Energy's Lawrence Berkeley National Laboratory (LBNL), vendor documentation, and ASHRAE, OCP and ISO documents, this article aligns what the numbers mean and sets out the cooling-materials issues from a materials engineer's point of view.
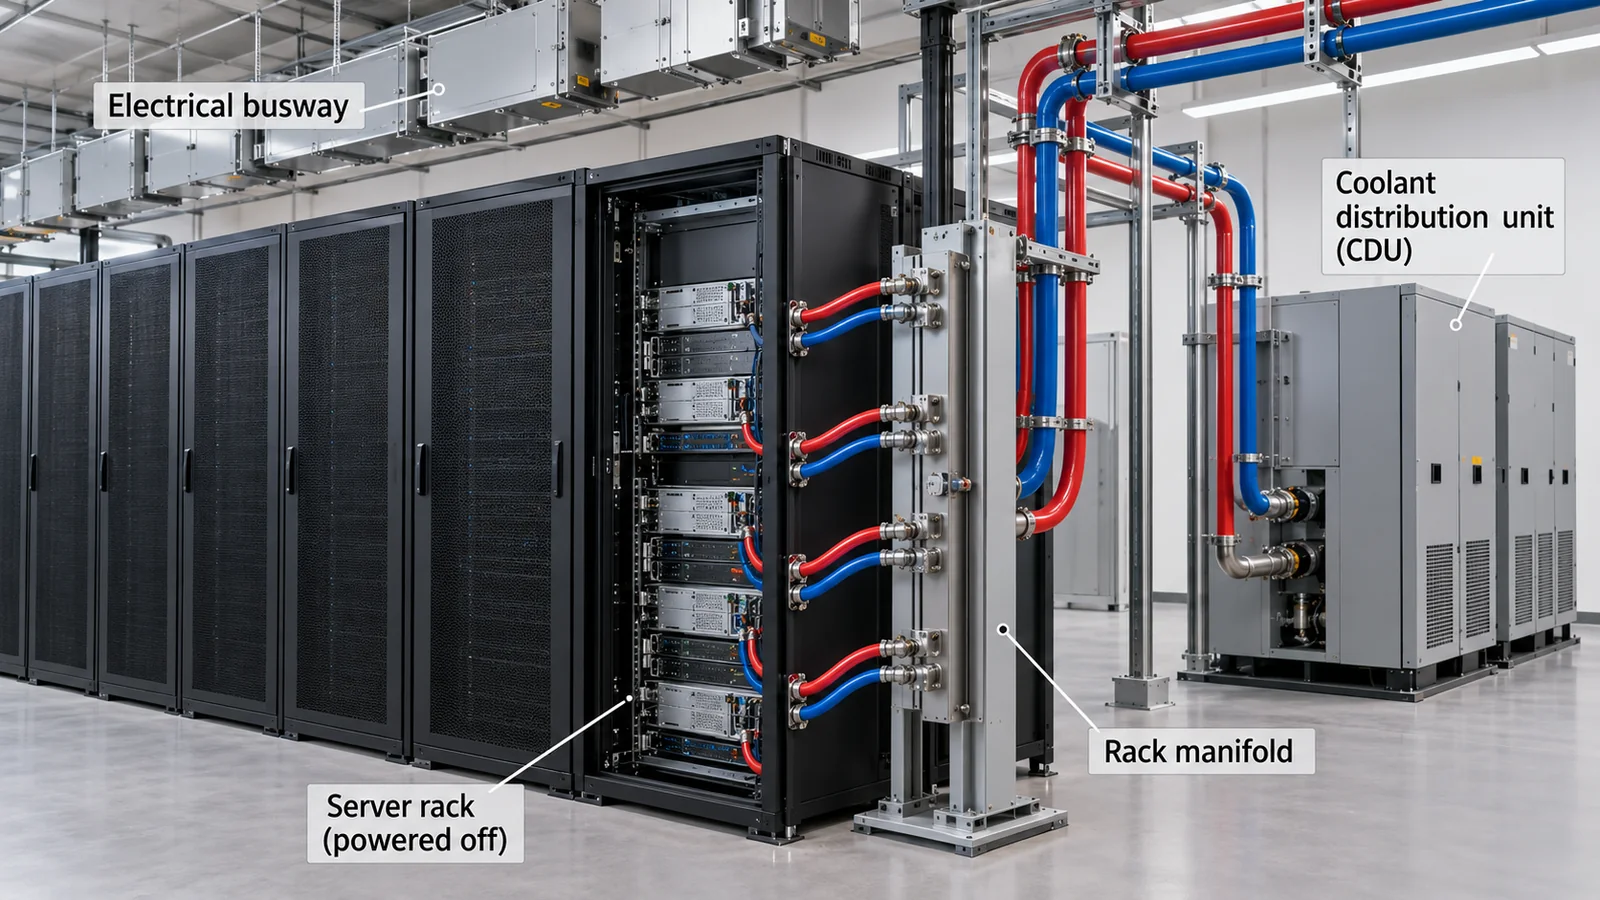
- Power and cooling for AI data centers (the short version)
- Aligning terms: IT load, utility capacity and PUE
- How much power: estimates from international bodies and laboratories
- Rack power density and GPUs: from a few kW to over a hundred
- Why air stops being enough: the physics of heat
- Cooling methods: air, rear-door, direct liquid and immersion
- A materials engineer's view: materials around cooling, from wetted materials to coolants, seals and fluorinated fluids
- Reading PUE: why 1.09 and 1.4 should not be lined up
- Power supply constraints: the grid, equipment lead times and future power architectures
- Limits, and what could not be confirmed
- How to read evaluations and standards
- Glossary
- References
- Claim-to-source audit
Sourced = stated in a published source (linked)
Our calculation = a value this article derives from stated assumptions
Not yet confirmed = plans, schedules or proposals not yet confirmed as results
Interpretation and organization are marked as commentary. An inference is shown in bold.
The same word can mean different things depending on whose power it is (IT equipment only, or the whole facility), whether it is rated or measured, and whether it is energy (TWh) or power (MW, GW). Vendor values are "stated" values, figures from international bodies and laboratories are estimates, and future figures are projections or scenarios. Planned, contracted or announced capacity is treated as "not yet confirmed" and kept apart from capacity under construction or in operation. No companies or sites are ranked. This article is not advice on design, purchasing or safety.
1. Power and cooling for AI data centers (the short version)
- Electricity ends up as heat: the power a server uses leaves as heat. Receiving power and rejecting heat are two sides of the same quantity, and once a rack reaches tens to over a hundred kW, air can no longer carry it away (our calculation in Chapter 5).Our calculation
- Read numbers by their definition: the IEA estimates that data centres worldwide used about 415 TWh in 2024 (about 1.5% of world electricity) and about 945 TWh by 2030 in its Base Case.Sourced[Ref. 1] For the United States, LBNL estimates 176 TWh in 2023 (4.4%).Sourced[Ref. 3] Both are energy, a different quantity from a building's "MW".
- Materials hold up the cooling: with direct liquid cooling, heat from the chip passes through thermal interface material, a copper cold plate, coolant, piping and seals on its way out. The OCP guidelines of September 2026 ask designers and operators to verify the compatibility of these wetted materials.Sourced[Ref. 15]
A "100 MW data center" is a completely different statement depending on whether it means IT load, utility capacity or a plan. At a PUE of 1.2, a facility with 100 MW of IT load needs about 120 MW overall (our calculation in Chapter 2). And MW that are planned, contracted or announced must be read separately from MW under construction or operating.
2. Aligning terms: IT load, utility capacity and PUE
At least four different "MW" figures are used interchangeably for data center power, and the number can differ by tens of percent depending on which is meant. ISO maintains a family of standards for data centre facilities and infrastructures (ISO/IEC 22237) and one for key performance indicators (ISO/IEC 30134), and in 2025 it published technical specifications on provisioning, forecasting and management of data centre IT equipment and facility infrastructure (ISO/IEC TS 8236-1 and -2).Sourced[Ref. 17] The texts were not read for this article, so the usage below is general terminology that we organize ourselves (commentary).
| Term | Meaning (common usage) | What to watch |
|---|---|---|
| IT load | Power used by IT equipment: servers, storage and network gear | Check whether it is the design maximum (rated) or actual operation. Servers rarely draw their rated power (LBNL statement below) |
| Facility power | IT load plus cooling, power-conversion losses, lighting and so on for the whole building. IT load x PUE is a guide | Facility power exceeds IT load by more as PUE worsens |
| Utility / contracted capacity | The capacity available from, or contracted with, the utility or grid operator | May include redundancy and room for expansion. Even if contracted, it may not be usable until grid works are finished (Chapter 9) |
| Planned or announced capacity | Capacity that a company or developer has planned or announced; often does not say whether IT load or utility capacity | Treat as Not yet confirmed and keep apart from capacity under construction or in operation |
This four-term summary is our commentary. It reflects general usage and is not a definition taken from the text of ISO or other standards.
PUE (power usage effectiveness) is the ratio of total facility energy to IT equipment energy; the closer to 1.0, the smaller the non-IT energy for cooling, power conversion and the like (our summary). The international standard ISO/IEC 30134-2 defines PUE, its measurement categories, calculation, reporting and interpretation.Sourced[Ref. 16] Google's official page describes PUE as a standard industry ratio comparing non-computing overhead energy, used for things like cooling and power distribution.Sourced[Ref. 18]
Our calculation Facility power: at a PUE of 1.2 this is 100 x 1.2 = 120 MW; at 1.4 (LBNL's estimate of the 2023 U.S. averageSourced[Ref. 3]) it is 140 MW. For the same IT load, the PUE alone makes a 20 MW difference.
GPU count: NVIDIA's official guide gives the GB200 NVL72 rack's power consumption as approximately 120 kW with 72 GPUs per rack.Sourced[Ref. 7][Ref. 9] 100 MW / 0.12 MW = about 833 racks, x 72 = about 60,000.0 GPUs is an upper-bound estimate that assumes all IT load is such racks.
Assumptions and limits: in practice there are storage, front-end networks and cooling-plant power, and rack consumption varies with configuration. The count also changes depending on whether rack power is treated as rated or as actual operating power (LBNL cites an analysis in which 8-GPU H100 nodes averaged 74% of rated thermal design power under workload).Sourced[Ref. 3] This is not a prediction of the size or GPU count of any facility.
3. How much power: estimates from international bodies and laboratories
The IEA's "Energy and AI" estimates global data centre electricity consumption at about 415 TWh in 2024 (about 1.5% of world electricity consumption), up 12% a year over the last five years.Sourced[Ref. 2] Its Base Case reaches about 945 TWh in 2030 (just under 3% of the world total), growing about 15% a year from 2024 to 2030, and about 1,200 TWh in 2035, with a 2035 range of 700 to 1,700 TWh across its sensitivity cases.Sourced[Ref. 1]Sourced[Ref. 2] The IEA itself notes uncertainty about both present and future figures.
In 2024 servers accounted on average for about 60% of electricity, storage about 5% and networking up to 5%; cooling ranges from about 7% in efficient hyperscale data centres to over 30% in less efficient enterprise ones.Sourced[Ref. 2] The Base Case sees accelerated servers (such as GPU servers) accounting for almost half of the increase to 2030.Sourced[Ref. 2]
For the United States, the LBNL report published by the DOE on 20 December 2024 estimates 58 TWh in 2014, about 76 TWh in 2018 (1.9%) and 176 TWh in 2023 (4.4%), and gives a 2028 scenario range of 325 to 580 TWh (6.7% to 12.0%).Sourced[Ref. 3]Sourced[Ref. 4] The spread reflects scenarios for GPU shipments, how AI servers are operated (60% to 80% of rated power) and the choice of cooling systems, such as a shift to liquid cooling.Sourced[Ref. 3] The report states that little data is public in this sector and that its estimates depend on assumptions (LBNL statement).
| Figure | Value | As average power (our calculation) |
|---|---|---|
| World 2024 (IEA estimate) | about 415 TWh | about 47 GW |
| World 2030 (IEA Base Case) | about 945 TWh Not yet confirmed | about 108 GW |
| U.S. 2023 (LBNL estimate) | 176 TWh | about 20 GW |
| U.S. 2028 (LBNL scenario range) | 325 to 580 TWh Not yet confirmed | about 37 to 66 GW; LBNL converts to 74 to 132 GW of installed demand assuming 50% capacity utilization |
Average power is TWh divided by 8,760 hours (Our calculation). The world (IEA) and U.S. (LBNL) figures differ in scope and method and are not added or compared directly. LBNL's "74 to 132 GW" is stated in the report as a conversion assuming 50% capacity utilization.Sourced[Ref. 3]
The key point is that energy (TWh) is an annual total while power (GW, MW) is the size needed at the same moment. Electrical equipment is built for the simultaneous peak, not the average, so the same TWh can need different amounts of equipment depending on utilization (which is why LBNL converts at 50% utilization).
4. Rack power density and GPUs: from a few kW to over a hundred
NVIDIA's DGX H100 (eight GPUs) user guide states a maximum power consumption of 10.2 kW, airflow of 1,105 CFM (at 80% fan) and heat output of 38,557 BTU/hr (about 11.3 kW).Sourced[Ref. 5] These are stated values for one air-cooled server. Four of them in one rack would be 4 x 10.2 = about 40.8 kW.Our calculation
By contrast, for the GB200 NVL72, a rack-scale liquid-cooled design with 72 GPUs and 36 CPUs in one rack,Sourced[Ref. 9] NVIDIA's DGX GB rack guide states that rack power consumption is approximately 120 kW, with compute trays liquid-cooled and networking and storage devices air-cooled.Sourced[Ref. 7] NVIDIA's technical blog on its contribution to the Open Compute Project says direct liquid cooling handles the 120 kW cooling capacity required for the rack, with a busbar rated for 1,400 A, over 100 lbs of added steel reinforcement and liquid quick disconnects.Sourced[Ref. 8]
For the next generation, the DGX Vera Rubin NVL72 guide (updated 7 October 2026) says each rack carries four power shelves, each rated at 110 kW with six air-cooled 18.3 kW power supplies, but does not state the rack's power consumption.Sourced[Ref. 11] A shelf rating is power-supply capacity, a different quantity from rack consumption, so this article does not estimate consumption. Looking further ahead, NVIDIA says it is moving to an 800 VDC power design to support "1 MW IT racks" starting in 2027, in step with its Kyber rack-scale systems (the company's plan).Sourced[Ref. 10]
The LBNL report explains that a server's "rated power" is a conservative value used to design power and electrical systems, assuming every component runs at maximum at once, and that servers rarely draw that much.Sourced[Ref. 3] It cites an analysis in which measured 8-GPU nodes averaged 74% of the manufacturer's rated thermal design power and uses 60% to 80% of rated power for AI servers.Sourced[Ref. 3]
Cooling, however, has to be built to reject the rated heat. Cold plates, thermal interface materials, hoses and quick disconnects are chosen for the flow and temperature at the hottest moment, not the average. Even if a power discussion can say "in practice about 70% of rated", the materials and piping still need to satisfy the rated-side conditions (our commentary, not an individual design decision).
5. Why air stops being enough: the physics of heat
The amount of fluid needed to move heat follows Q = mass flow x specific heat x temperature rise. To carry the same heat at the same temperature rise, water, with its higher specific heat and density, needs far less volume than air. The white paper of ASHRAE Technical Committee 9.9 says liquid cooling is many times more effective than air at removing heat, and that as chip power rises the temperature difference between device and coolant demands lower thermal resistance, driving a shift from air to liquid.Sourced[Ref. 12]
Our calculation Check on air properties: NVIDIA lists the DGX H100 at 1,105 CFM (0.52 m³/s) airflow and 38,557 BTU/hr (11.3 kW) of heat.Sourced[Ref. 5] With air density 1.2 kg/m³ and specific heat 1,005 J/(kg·K), the air temperature rise is about 18 K.
Air for 120 kW: with the same 18 K rise, the airflow needed is 120,000 / (1.2 x 1,005 x 18) = about 5.5 m³/s (about 11,700 CFM), roughly 2.7 times the airflow of a rack of four DGX H100 (4 x 1,105 = 4,420 CFM).
Water for 120 kW: assuming a 10 K rise, the mass flow is 120,000 / (4,186 x 10) = about 2.87 kg/s, or about 172 L/min by volume, roughly 1/1,900.0 of the air volume flow.
Assumptions and limits: the temperature rises (18 K air, 10 K water) are assumptions, not design values. Coolants are often water-propylene glycol mixtures such as PG25, and this estimate uses water properties without correcting for the mixture. Not all of a rack's heat goes to liquid; as NVIDIA's guide states, some devices remain air-cooled.Sourced[Ref. 7]
The chip side points the same way. For chip power P, allowable case temperature Tc and coolant temperature Tf, the whole cooling path must have a thermal resistance no greater than (Tc - Tf) / P (the line of reasoning in the ASHRAE white paper).Sourced[Ref. 12] In our example (case limit 85 °C, coolant 35 °C, both assumed), a 700 W chip allows about 0.071 K/W, a 350 W chip about 0.143 K/W, and a hypothetical 1,400 W chip about 0.036 K/W.Our calculation NVIDIA states a maximum TDP of up to 700 W (configurable) for the H100 SXM.Sourced[Ref. 21] Doubling power halves the allowable thermal resistance.
6. Cooling methods: air, rear-door, direct liquid and immersion
The ASHRAE TC 9.9 white paper lists liquid-cooling approaches: direct on-chip cold plates, rear-door heat exchangers on the rack, and immersion cooling (single-phase and two-phase).Sourced[Ref. 12] The LBNL report likewise notes that liquid cooling (rear-door heat exchangers, direct-to-chip and immersion) allows higher cooling-water temperatures and therefore wider use of near-free cooling, and that liquid-cooled IT systems can often run at higher water temperatures than air-cooled ones.Sourced[Ref. 3]
| Method | Heat path (general summary) | Points raised in the ASHRAE white paper and OCP documents |
|---|---|---|
| Air cooling | Chip, heat sink, air, air handler | Fan power inside the server grows, reaching 10% to 20% in denser servers; in a 50 kW rack at least 5 kW is fan power (ASHRAE white paper) |
| Rear-door heat exchanger | Servers stay air-cooled; exhaust air is cooled by a water coil on the rack's rear door | In between air and liquid. Also used to capture the non-liquid-cooled heat (the LRZ SuperMUC-NG example) |
| Direct liquid cooling (on-chip cold plate) | Chip, thermal interface material, cold plate (copper), coolant, manifold, CDU | Key points are wetted-material compatibility, connector durability and fluid management (Chapter 7). NVIDIA uses it in the GB200 NVL72 |
| Immersion cooling (single- and two-phase) | The whole server is immersed in a non-conductive fluid that carries the heat | The ASHRAE white paper recommends a materials compatibility assessment and a warranty-impact evaluation before deployment and notes servicing tanks can need lifting equipment |
All Sourced (summary of the ASHRAE TC 9.9 white paper [12], LBNL [3] and NVIDIA [7]). The way the heat path is written in column 2 is our own summary.
| ASHRAE liquid-cooling class (5th edition, 2021) | Meaning of the name |
|---|---|
| W17, W27, W32, W40, W45, W+ | Formerly W1, W2, W3, (W40 is new), W4 and W5. Names now carry the upper supply-water temperature limit, and all classes have a lower limit of 2 °C. Equipment must deliver full performance across the whole range of the stated class |
Sourced (ASHRAE TC 9.9 white paper [12]). The detailed values for each class are in the paid text of the 5th edition; this article gives only the meaning of the names.
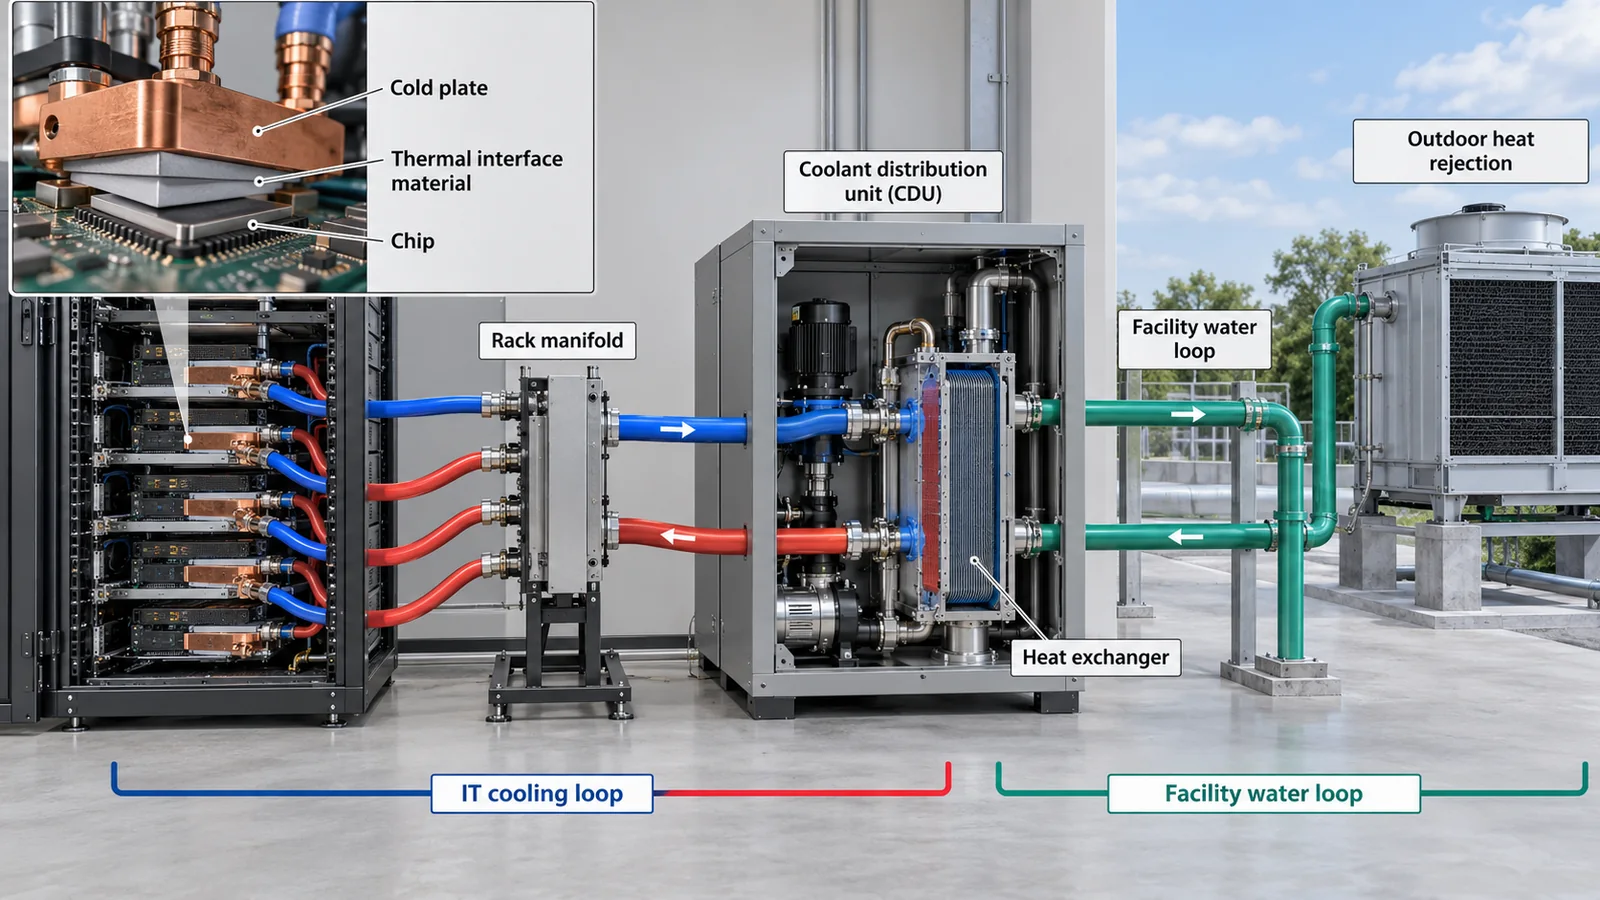
View original SVG, values and source annotations
7. A materials engineer's view: materials around cooling, from wetted materials to coolants, seals and fluorinated fluids
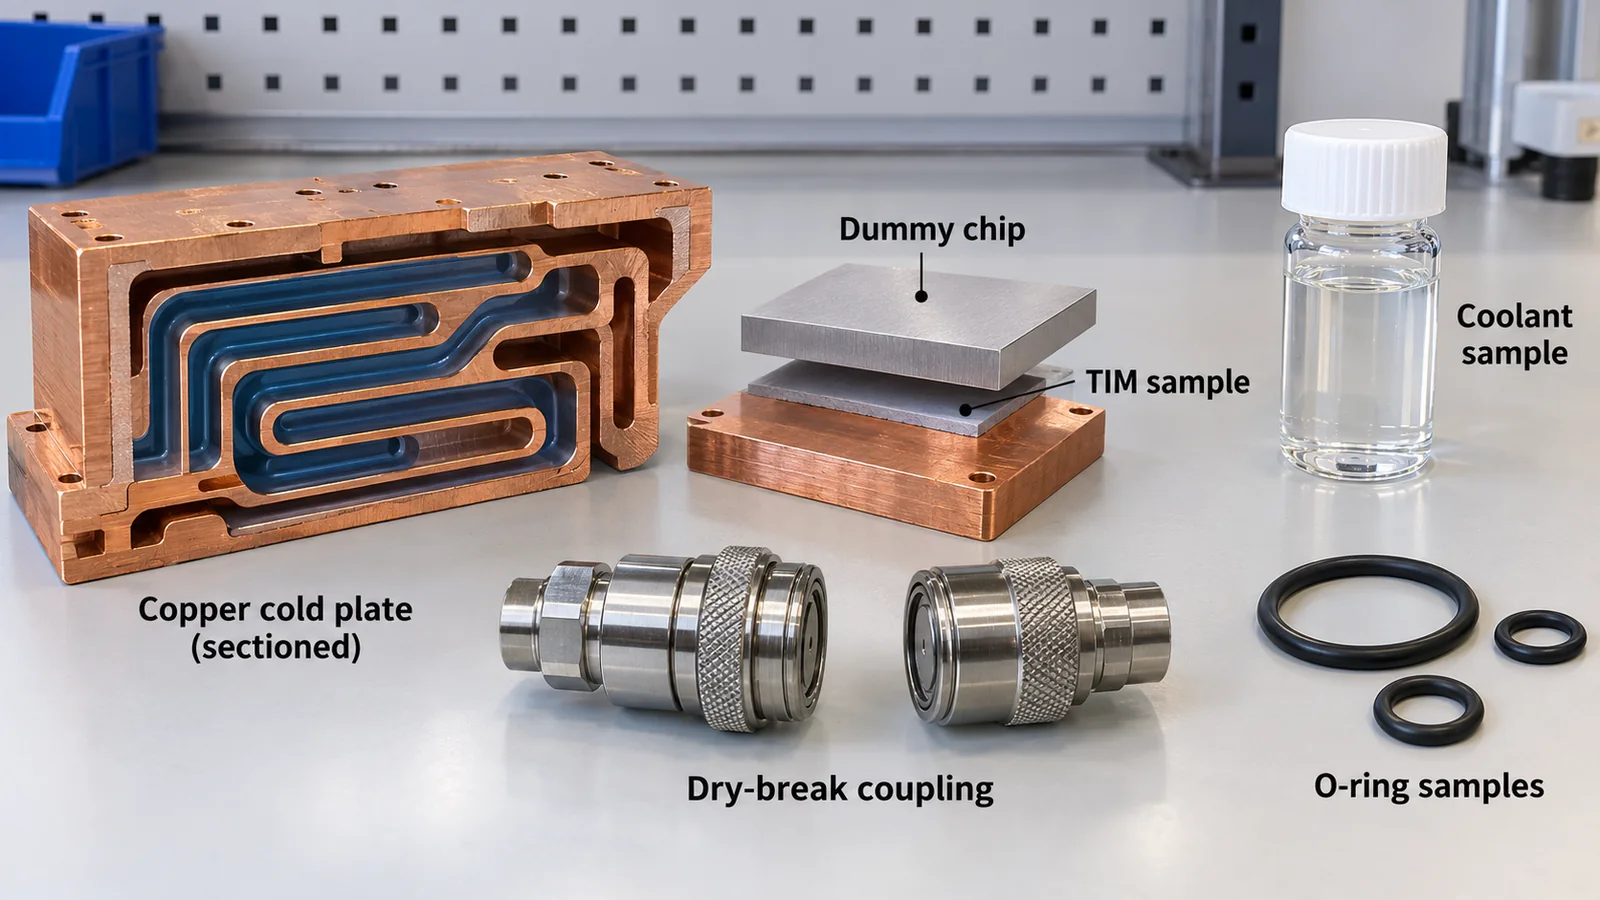
The OCP "Guidelines for Using Propylene Glycol-Based Heat Transfer Fluids in Liquid Cooled Racks" (revision 2.0, version 1.0.0, 15 September 2026) calls the parts the coolant touches "wetted materials", including cold plates, coolant distribution units (CDUs), hoses and piping, pump seals, heat exchangers and quick-disconnect seals, and asks designers, contractors and operators to verify compatibility with the chosen fluid. Compatibility is to be confirmed at the system's maximum operating temperature and re-verified whenever a component is replaced or the design changes.Sourced[Ref. 15]
| Material | OCP guideline statement (for PG25; representative, not comprehensive) |
|---|---|
| Copper | Lists copper grades such as CDA110, CDA1020 and CDA1220 as representative compatible materials; copper cold plates with brazing filler (a Cu-Sn-P-Ni example) |
| Brass | Below 15% zinc is preferred. Above 15% is more prone to dezincification; if used, verify dezincification resistance with ISO 6509 and consult the manufacturer |
| Stainless steel | 304L, 316L or higher grades preferred. Stainless steel quick connects recommended |
| Plated connectors | Avoid nickel- and chromium-plated connectors until proven. After many uses plating can wear and the exposed metal forms a galvanic couple that may raise corrosion; brass corrosion releases zinc and possibly copper into the fluid. The effect of dissolved zinc on the long-term performance of copper cold plates has not been determined |
| EPDM (elastomer) | Peroxide-cured EPDM recommended. Sulfur-cured EPDM can release sulfate into the fluid over time, leading to corrosion issues, so use with caution |
| Operating temperature | Closed-loop operating temperature is expected to be 17 to 66 °C. Above this range, compatibility of elastomers and plastics in particular must be reviewed |
All Sourced (summary of the OCP PG25 guidelines [15]). This is not design or standards advice; the materials listed are representative examples only and any choice must be confirmed with the fluid and component suppliers.
The same guidelines note that coolant carries corrosion inhibitors that form a protective layer on metal surfaces but are gradually consumed, so concentrations decline over time, and that precipitation of inhibitor compounds can cause fouling or blockages; they ask operators to keep records of inhibitor concentration, pH and contamination analysis.Sourced[Ref. 15] Coolant is not a fill-and-forget material but one whose condition is monitored throughout maintenance.
Quick disconnects are parts for which NVIDIA's technical blog describes design measures for alignment and reliable mating (such as blind-mate manifolds).Sourced[Ref. 8] Because they are plugged and unplugged repeatedly during rack servicing, seal set and plating wear (see the table above) are the materials-side issues behind leak risk (our commentary).
Immersion cooling and fluorinated fluids. The ASHRAE white paper says immersion cooling offers broad temperature support, high heat capture and high density, but adds complexity in deployment and service, and fluid-hardware compatibility can affect warranty, so it recommends a materials compatibility assessment and warranty-impact evaluation before deployment.Sourced[Ref. 12] Some fluids used in two-phase immersion cooling are fluorinated. 3M announced in December 2022 that it would exit all PFAS (per- and polyfluoroalkyl substances) manufacturing by the end of 2025, and its quarterly report (10-Q) for 30 September 2025 states it was progressing toward that exit.Sourced[Ref. 19] In the EU, for the broad PFAS restriction proposal, the ECHA page (checked 15 October 2026) shows that the consultation on SEAC's (Committee for Socio-economic Analysis) draft opinion ran until 25 May 2026 and that the agenda for the November SEAC meeting was published on 7 October 2026.Sourced[Ref. 20] The final content and timing of any rule could not be confirmed and are "not yet confirmed".Sourced Which fluids fall in scope needs checking substance by substance, and this article does not judge any individual coolant.
Raising coolant temperature reduces chiller use and allows wider free cooling, which helps on energy (statements in LBNL and ASHRAE).Sourced[Ref. 3][Ref. 12] But, as the OCP guidelines show, higher temperature widens what must be checked for elastomer and plastic compatibility.Sourced[Ref. 15] Energy efficiency and materials life or reliability can trade off through temperature (our commentary).
The role and degradation of thermal interface materials are in our explainer on TIM, the relation between UPS batteries and the grid is in the one on data centers and energy storage, and heat inside packages such as HBM is in those on HBM and CoWoS. This article supplies the facility-side yardsticks for power and cooling that connect them (our positioning).
8. Reading PUE: why 1.09 and 1.4 should not be lined up
PUE comes with several numbers whose scope and measurement differ. LBNL estimates the average PUE of U.S. data centers fell from about 1.6 in 2014 to about 1.4 in 2023, mainly through a shift to large hyperscale and colocation facilities, and gives a 2028 scenario of 1.15 to 1.35 that includes more liquid-cooled AI servers.Sourced[Ref. 3] LBNL's numbers are estimates based on simulations that assume facilities run as designed, and the report itself cautions that they differ from the measured PUE of individual facilities.Sourced[Ref. 3]
Google's official page, for its part, gives its global fleet's average annual PUE for 2025 as 1.09 (a trailing twelve-month value covering large-scale facilities that have reached stable operation).Sourced[Ref. 18] This is a company-reported value whose scope and method differ from LBNL's U.S.-wide estimate (about 1.4), so the two cannot be lined up to argue which is better.
PUE can also obscure things. The ASHRAE white paper shows that fan power inside a server can reach 10% to 20% in dense servers, and that the fans are fed from the same UPS as the server.Sourced[Ref. 12] Fans inside a server are part of the IT equipment and so generally fall on the IT side of the ratio (our commentary; the standard's text was not read). That means that switching from air to liquid and cutting fan power reduces both the denominator (IT energy) and total facility energy, so the PUE number alone does not show the full improvement (our commentary). PUE is an indicator of non-IT efficiency, not of energy per unit of computation.
9. Power supply constraints: the grid, equipment lead times and future power architectures
The IEA estimates that electricity grids are already strained in many places and that, unless these risks are addressed, around 20% of planned data centre projects could be at risk of delays. Grid connection queues are long and complex, new transmission lines can take four to eight years in advanced economies, wait times for critical equipment such as transformers and cables have doubled in the past three years, and turbine deliveries for new gas-fired plants face lead times of several years.Sourced[Ref. 1] It adds that nearly half of data centre capacity in the United States is in five regional clusters and that data centres account for substantial shares of electricity consumption in local markets.Sourced[Ref. 1] AI-focused data centres can draw as much electricity as power-intensive factories such as aluminium smelters, but are much more geographically concentrated.Sourced[Ref. 1]
This constraint is also why utility capacity and IT load must be separated (Chapter 2). Even if contracted or announced capacity is large, it cannot be used if grid works or equipment deliveries are late. The IEA's "around 20% could be at risk" is its estimate and a conditional outlook, not a prediction of any individual project.Sourced[Ref. 1]
Power architecture inside facilities is also changing. NVIDIA says it is moving from 54 V systems to 800 VDC to support 1 MW IT racks, with full-scale production coinciding with Kyber rack-scale systems in 2027, and claims up to 5% better end-to-end efficiency than 54 V systems and 85% more power through the same conductor size (the company's claims and plans).Sourced[Ref. 10] The same document says innovation is "still required" on overcurrent-protection reliability and maintenance and that capex, opex and safety implications are being studied.Sourced[Ref. 10] These are design targets, not results. The changing role of UPS batteries is covered in our explainer on data centers and energy storage.
| Constraint | What is short | How the sources treat it | Category |
|---|---|---|---|
| Grid connection | Queues and the time to build transmission lines (four to eight years in advanced economies) | IEA estimates around 20% delay risk toward 2030 | Not yet confirmed |
| Critical equipment | Transformer and cable wait times doubled in three years; turbine lead times of several years | IEA statement | Sourced |
| Regional concentration | Nearly half of U.S. data centre capacity is in five regional clusters | IEA statement | Sourced |
| Power delivery inside the rack | Busbar current (1,400 A in the GB200 NVL72) and a future 800 VDC proposal | NVIDIA blogs; 800 VDC is a plan from 2027 | Not yet confirmed |
A summary of statements by the IEA [1] and NVIDIA [8, 10].
10. Limits, and what could not be confirmed
- Sizes of individual facilities: MW and GPU counts of specific data centers or projects are not given because official material did not let us tell IT load from utility capacity. Planned, contracted or announced capacity is "not yet confirmed".
- Rack power consumption: "approximately 120 kW" from NVIDIA's guide is used for the GB200 NVL72. The rack consumption of the DGX Vera Rubin NVL72 is not stated in the official guide and could not be confirmed; shelf ratings are not consumption.
- Texts of standards: the texts of ISO/IEC 30134-2:2026, ISO/IEC 22237-4, ASHRAE 90.4-2025 and the 5th edition of ASHRAE Thermal Guidelines are paid or were not obtained; what was confirmed are the ISO and ASHRAE pages, a white paper and a fact sheet. The details of PUE measurement categories and the temperatures of each liquid-cooling class are not given.
- Coolants and materials: the OCP guidelines are for PG25; the materials compatibility of other coolants (such as dielectric immersion fluids) and the regulatory standing of individual two-phase fluids were not checked. The final ECHA rule could not be confirmed.
- Water use and regional differences: LBNL estimates direct water consumption of U.S. data centers at about 66 billion liters in 2023 and indirect water use through electricity at nearly 800 billion liters.Sourced[Ref. 3] This article does not treat water in depth and focuses on power and cooling; regional differences from climate and the electricity mix are also not covered in detail.
- Boundaries with other explainers: UPS and batteries are in the data-centers-and-energy-storage explainer, thermal interface materials in the TIM explainer, and package-level heat in the HBM and CoWoS explainers.
- Read "MW" by definition. IT load, facility power (IT x PUE), utility capacity and plans are different quantities; 100 MW of IT load means about 120 MW of facility power at PUE 1.2 and about 140 MW at 1.4.Our calculation
- Energy (TWh) and power (GW) are different quantities; the IEA's about 415 TWh worldwide (2024) and LBNL's 176 TWh for the U.S. (2023) are estimates.Sourced
- Rack density went from tens of kW to over a hundred. In our estimate, air needs about 1,900.0 times the volume of water to carry a 120 kW rack's heat.Our calculation
- With liquid cooling, wetted materials move to the center of design. OCP points to compatibility checks at maximum temperature, inhibitor management, and care with EPDM cure systems and connector plating.Sourced
- Do not rank PUE values that differ in scope and method. The international PUE standard ISO/IEC 30134-2 was reissued as a second edition in January 2026 and the 2016 edition is withdrawn.Sourced[Ref. 6]
- Power supply is bounded by the grid. The IEA estimates around 20% of planned projects could be at risk of delays.Sourced
11. How to read evaluations and standards
Power and cooling in data centers are evaluated from several angles: (1) energy efficiency (PUE and similar), (2) thermal handling (temperature conditions and cooling methods), (3) design efficiency criteria, (4) liquid-cooling fluids and materials, and (5) future power architectures. Facility power and cooling generally have no "benchmark" like AI inference performance; evaluation rests on standards, guidelines and operators' self-reports. The items below had their number, title, edition and status confirmed on official pages on 15 October 2026.
| Item | Representative method or material (name, source) | Standards and guidance | How to read it |
|---|---|---|---|
| Energy efficiency (PUE) | LBNL estimate (U.S. average 1.4 in 2023) [3]; Google's own report (1.09 in 2025) [18] Sourced | ISO/IEC 30134-2:2026 (PUE, edition 2, published January 2026; the 2016 edition is withdrawn [6]). ISO/IEC 30134 also has parts for REF (renewables), ERF (energy reuse), CER (cooling efficiency ratio), CUE (carbon) and WUE (water) [16, 17] Sourced | Do not line up figures with different scope, boundary and period. The text is paid and was not read (the standard defines how to measure, not a pass/fail level) |
| Design efficiency criteria | None found (compliance of individual facilities) | ANSI/ASHRAE 90.4 (energy standard for data centers). The 2022 fact sheet sets maximum mechanical load and electrical loss components (MLC, ELC) and applies to data centers with IT load above 10 kW and floor power density above 20 W/ft². ASHRAE's page lists the 2025 edition [13, 14] Sourced | May be referenced by building and energy codes such as the IECC. The text of the 2025 edition was not read |
| Thermal environment and liquid-cooling classes | ASHRAE TC 9.9 white paper "Emergence and Expansion of Liquid Cooling in Mainstream Data Centers" (2021) [12] Sourced | ASHRAE Thermal Guidelines for Data Processing Environments, 5th edition (2021): liquid-cooling classes W17 to W+. ISO/IEC 22237-4:2021 (data centre facilities and infrastructures, environmental control) [12, 17] Sourced | Guidelines are recommendations, not legally binding. Whether a successor to the 5th edition exists could not be confirmed |
| Liquid-cooling fluids and wetted materials | OCP "Guidelines for Using Propylene Glycol-Based Heat Transfer Fluids in Liquid Cooled Racks", revision 2.0, version 1.0.0 (15 September 2026) [15] Sourced | The wetted-materials workstream of OCP's Cold Plate sub-project is working to expand and validate the list (guideline statement) [15] Not yet confirmed | The guideline's material tables are "representative, not comprehensive". Adopting a given part requires confirmation from the fluid and component suppliers |
| Regulation of fluorinated fluids | 3M SEC filing (announcement of December 2022; 10-Q of 30 September 2025) [19] and the ECHA page [20] Sourced | EU PFAS restriction proposal: consultation on the SEAC draft opinion until 25 May 2026; agenda for the November SEAC meeting published 7 October 2026 [20] Not yet confirmed | This is a proposal and draft-opinion stage, not a final rule. Whether a given fluid is in scope must be checked substance by substance |
| Future power architecture | NVIDIA's 800 VDC blog (company plan) [10] Not yet confirmed | None found (an international standard for 800 VDC data centre power) | The efficiency and cost figures are company claims with no independent verification found |
| Planned, contracted or announced capacity (MW) | None found (a common framework that distinguishes IT load from utility capacity) | ISO/IEC TS 8236-1 and -2:2025 (provisioning, forecasting and management of IT equipment and facility infrastructure) exist [17]; the texts were not read Sourced | Treat as Not yet confirmed and always check whether it means IT load or utility capacity |
Category tags appear in each cell. Numbers, titles, editions and statuses of ISO, ASHRAE, OCP and ECHA items were confirmed on each official page on 15 October 2026 (the ISO and ASHRAE pages were checked in a browser). The arrangement of the table is our own.
Three points on how to read these.
- Stated versus measured: vendor power and airflow are stated maxima, and PUE figures are corporate self-reports or laboratory simulations, not measurements of any individual facility. Align measurement boundary and period before comparing.
- Standards mostly define measurement and recommendations: ISO/IEC 30134 defines KPIs and how to measure them, while ASHRAE thermal guidelines and OCP guidelines are recommendations. Read them apart from legal requirements such as building and energy codes.
- Check edition and status: the PUE standard was revised in 2026 and the old edition withdrawn, and guidelines keep being revised (OCP PG25 reached revision 2.0 in September 2026). Cite with the edition and date.
12. Glossary
- IT load
- Power used by IT equipment.
- Utility capacity
- Capacity available from, or contracted with, the utility.
- PUE
- Power usage effectiveness: total facility energy divided by IT equipment energy.
- WUE
- Water usage effectiveness: an indicator of water-use efficiency.
- TDP
- Thermal design power: the power level used as the basis for cooling design.
- Direct liquid cooling
- Mounting a cold plate on the chip and carrying heat with coolant.
- Immersion cooling
- Cooling by immersing servers in a non-conductive fluid (single- or two-phase).
- CDU
- Coolant distribution unit: circulates and distributes coolant and exchanges heat with facility water.
- Wetted materials
- Materials of parts that contact the coolant.
- PG25
- Inhibited aqueous solution with about 25 vol% propylene glycol.
- PFAS
- A broad family of fluorinated organic compounds.
- TWh / GW
- Energy (an annual total) / power (the size needed at once).
13. References
- IEA "Energy and AI" — Executive summary (2025 edition; about 415 TWh in 2024, Base Case about 945 TWh by 2030, around 20% delay risk from grid constraints and so on; checked 15 October 2026) — iea.org/reports/energy-and-ai/executive-summary
- IEA "Energy and AI" — Energy demand from AI (breakdown: servers about 60%, cooling about 7% to over 30%; drivers of growth to 2030; regional growth; checked 15 October 2026) — iea.org/reports/energy-and-ai/energy-demand-from-ai
- Shehabi A. et al. (LBNL) "2024 United States Data Center Energy Usage Report", Lawrence Berkeley National Laboratory (2024), DOI 10.71468/P1WC7Q (the PDF text was read through the eScholarship page; 15 October 2026) — escholarship.org/uc/item/32d6m0d1
- U.S. Department of Energy "DOE Releases New Report Evaluating Increase in Electricity Demand from Data Centers" (20 December 2024) — energy.gov/articles/doe-releases-new-report-evaluating-in...
- NVIDIA "NVIDIA DGX H100 User Guide" — Introduction (8 GPUs, 10.2 kW max, 1,105 CFM airflow, 38,557 BTU/hr, 640 GB GPU memory) — docs.nvidia.com/dgx/dgxh100-user-guide/introduction-to-dg...
- ISO/IEC "ISO/IEC 30134-2:2016" (edition 1, April 2016; status shown as "Withdrawn", with ISO/IEC 30134-2:2026 shown as the revising publication; checked 15 October 2026) — iso.org/standard/63451.html
- NVIDIA "NVIDIA DGX GB Rack Scale Systems User Guide" — Hardware (rack power consumption approximately 120 kW; compute trays liquid-cooled, others air-cooled; power shelves) — docs.nvidia.com/dgx/dgxgb200-user-guide/hardware.html
- NVIDIA "NVIDIA Contributes NVIDIA GB200 NVL72 Designs to Open Compute Project", NVIDIA Technical Blog (15 October 2024) — developer.nvidia.com/blog/nvidia-contributes-nvidia-gb200...
- NVIDIA "NVIDIA GB200 NVL72" (72 Blackwell GPUs and 36 Grace CPUs, a rack-scale liquid-cooled design; checked 15 October 2026) — nvidia.com/en-us/data-center/gb200-nvl72/
- NVIDIA "NVIDIA 800 VDC Architecture Will Power the Next Generation of AI Factories", NVIDIA Technical Blog (1 MW IT racks, a plan from 2027, and the company's claims on efficiency, conductors and cost) — developer.nvidia.com/blog/nvidia-800-v-hvdc-architecture-...
- NVIDIA "NVIDIA DGX VR NVL72 User Guide" — Hardware (updated 7 October 2026; 72 GPUs, four 110 kW-rated power shelves, rack power consumption not stated) — docs.nvidia.com/dgx/dgxvr-user-guide/hardware.html
- ASHRAE TC 9.9 "Emergence and Expansion of Liquid Cooling in Mainstream Data Centers", ASHRAE white paper (2021) (liquid-cooling classes W17 to W+, in-server fan power, immersion cooling considerations) — ashrae.org/file%20library/technical%20resources/bookstore...
- ASHRAE "ASHRAE Data Center Resources" (list of standards and resources including ANSI/ASHRAE Standard 90.4-2025; checked 15 October 2026) — ashrae.org/technical-resources/bookstore/datacom-series
- ASHRAE "Standard 90.4-2022" fact sheet (purpose, mechanical load and electrical loss components, scope) — ashrae.org/file%20library/about/government%20affairs/advo...
- Open Compute Project "Guidelines for Using Propylene Glycol-Based Heat Transfer Fluids in Liquid Cooled Racks", Revision 2.0, Version 1.0.0 (15 September 2026) (wetted materials, inhibitors, operating temperature) — opencompute.org/wp-content/uploads/2026/10/OCP-PG25-Guide...
- ISO/IEC "ISO/IEC 30134-2:2026 Information technology — Data centres key performance indicators — Part 2: Power usage effectiveness (PUE)" (edition 2, published January 2026; the 2016 edition is withdrawn) — iso.org/standard/30134-2
- ISO/IEC JTC 1/SC 39 List of standards of SC 39 "Sustainability, IT and data centres" (parts of ISO/IEC 22237 and 30134, TS 8236-1 and -2:2025 and others; checked 15 October 2026) — iso.org/committee/654019/x/catalogue/p/1/u/0/w/0/d/0
- Google "Data center efficiency" (2025 global annual average PUE of 1.09, PUE description, measurement method; checked 15 October 2026) — datacenters.google/efficiency/
- 3M Company Form 10-Q for the quarter ended September 30, 2025 (description of the PFAS manufacturing exit announced in 2022; progressing toward exit by the end of 2025) — sec.gov/Archives/edgar/data/66740/000006674025000089/mmm-...
- ECHA "Per- and polyfluoroalkyl substances (PFAS)" (update list for the EU PFAS restriction proposal: consultation on the SEAC draft opinion, agenda for the November SEAC meeting published 7 October 2026; checked 15 October 2026) — echa.europa.eu/hot-topics/perfluoroalkyl-chemicals-pfas
- NVIDIA "NVIDIA H100 Tensor Core GPU" (H100 SXM: max TDP up to 700 W (configurable); checked 15 October 2026) — nvidia.com/en-us/data-center/h100/
14. Claim-to-source audit
| Claim in the text | Basis | Category |
|---|---|---|
| IEA: about 415 TWh (about 1.5%) in 2024, up 12% a year over five years, Base Case about 945 TWh in 2030 (about 15% a year), about 1,200 TWh in 2035, a 2035 range of 700 to 1,700 TWh across cases, around 20% delay risk from grid constraints, 4 to 8 years for transmission lines, transformer and cable wait times doubled in three years, turbine lead times, nearly half of U.S. capacity in five clusters, and the electricity draw of AI-focused data centres | Reference 1 https://www.iea.org/reports/energy-and-ai/executive-summary | Sourced |
| IEA: servers about 60%, storage about 5%, networking up to 5%, cooling about 7% (efficient hyperscale) to over 30% (less efficient enterprise), and almost half of the increase to 2030 from accelerated servers | Reference 2 https://www.iea.org/reports/energy-and-ai/energy-demand-from-ai | Sourced |
| LBNL: U.S. data centers at 58 TWh in 2014, about 76 TWh in 2018 (1.9%), 176 TWh in 2023 (4.4%) and a 2028 scenario range of 325 to 580 TWh (6.7% to 12.0%; 74 to 132 GW assuming 50% utilization); AI-server operating power at 60% to 80% of rated, and measured 8-GPU H100 nodes at an average 74% of rated TDP; PUE estimates (about 1.6 in 2014, about 1.4 in 2023, 1.15 to 1.35 in 2028) based on simulation assuming facilities run as designed; site WUE; direct water consumption of about 66 billion liters and indirect water of nearly 800 billion liters | Reference 3 https://escholarship.org/uc/item/32d6m0d1 | Sourced |
| DOE announcement of 20 December 2024 (58 TWh in 2014, 176 TWh and 4.4% in 2023, 325 to 580 TWh and 6.7% to 12% in 2028) | Reference 4 https://www.energy.gov/articles/doe-releases-new-report-evaluating-increase-electricity-demand-data-centers | Sourced |
| DGX H100: 8 GPUs, 10.2 kW max, 1,105 CFM (80% fan), 38,557 BTU/hr | Reference 5 https://docs.nvidia.com/dgx/dgxh100-user-guide/introduction-to-dgxh100.html | Sourced |
| GB200 NVL72: rack power consumption approximately 120 kW, compute trays liquid-cooled, networking and storage air-cooled, power shelves | Reference 7 https://docs.nvidia.com/dgx/dgxgb200-user-guide/hardware.html | Sourced |
| Direct liquid cooling for the 120 kW cooling capacity, 1,400 A busbar, over 100 lbs of steel reinforcement, alignment of liquid quick disconnects (2024 OCP Global Summit) | Reference 8 https://developer.nvidia.com/blog/nvidia-contributes-nvidia-gb200-nvl72-designs-to-open-compute-project/ | Sourced |
| GB200 NVL72 is a rack-scale liquid-cooled design with 72 GPUs and 36 CPUs | Reference 9 https://www.nvidia.com/en-us/data-center/gb200-nvl72/ | Sourced |
| NVIDIA's 800 VDC: 1 MW IT racks, alignment with Kyber from 2027, claims of up to 5% better efficiency than 54 V and 85% more power through the same conductor, and the statement that innovation is still required | Reference 10 https://developer.nvidia.com/blog/nvidia-800-v-hvdc-architecture-will-power-the-next-generation-of-ai-factories/ | Not yet confirmed |
| DGX Vera Rubin NVL72: four power shelves each rated 110 kW (six air-cooled 18.3 kW supplies), rack consumption not stated, updated 7 October 2026 | Reference 11 https://docs.nvidia.com/dgx/dgxvr-user-guide/hardware.html | Sourced |
| ASHRAE TC 9.9 white paper: liquid-cooling classes (W17 to W+, 2 °C lower limit, equipment must perform across the full class range), in-server fan power (10% to 20% in dense servers, at least 5 kW in a 50 kW rack, effect on UPS capacity), liquid cooling being many times more effective than air, thermal resistance reasoning, and immersion considerations (materials compatibility assessment, warranty impact) | Reference 12 https://www.ashrae.org/file%20library/technical%20resources/bookstore/emergence-and-expansion-of-liquid-cooling-in-mainstream-data-centers_wp.pdf | Sourced |
| ASHRAE's data center resources page lists ANSI/ASHRAE Standard 90.4-2025; the 2022 fact sheet (MLC and ELC; applies above 10 kW IT load and 20 W/ft² power density) | Reference 13 https://www.ashrae.org/technical-resources/bookstore/datacom-series Reference 14 https://www.ashrae.org/file%20library/about/government%20affairs/advocacy%20toolkit/virtual%20packet/standard-90.4-2022-fact-sheet.pdf | Sourced |
| OCP PG25 guidelines: coverage of wetted materials, confirmation at maximum operating temperature, statements on copper, brass, stainless steel, brazing filler, plated connectors and EPDM, inhibitor consumption and records, 17 to 66 °C operating temperature, expansion by the workstream (15 September 2026, revision 2.0, version 1.0.0) | Reference 15 https://www.opencompute.org/wp-content/uploads/2026/10/OCP-PG25-Guidelines-V1.0.0.pdf | Sourced |
| ISO/IEC 30134-2:2026 (PUE, edition 2, published January 2026), and the existence of the parts of 30134, 22237-4 and TS 8236 | Reference 16 https://www.iso.org/standard/30134-2 Reference 17 https://www.iso.org/committee/654019/x/catalogue/p/1/u/0/w/0/d/0 | Sourced |
| ISO/IEC 30134-2:2016 shown as withdrawn, with ISO/IEC 30134-2:2026 shown as its revision | Reference 6 https://www.iso.org/standard/63451.html | Sourced |
| Google: global 2025 annual average PUE of 1.09 (trailing twelve months, large-scale facilities in stable operation) and its description of PUE | Reference 18 https://datacenters.google/efficiency/ | Sourced |
| 3M announced in December 2022 an exit from PFAS manufacturing by the end of 2025; its 10-Q of 30 September 2025 states it was progressing toward the exit | Reference 19 https://www.sec.gov/Archives/edgar/data/66740/000006674025000089/mmm-20250930.htm | Sourced |
| ECHA: consultation on the SEAC draft opinion on the EU PFAS restriction proposal (until 25 May 2026), agenda for the November SEAC meeting published on 7 October 2026; the final rule is not yet confirmed | Reference 20 https://echa.europa.eu/hot-topics/perfluoroalkyl-chemicals-pfas | Not yet confirmed |
| H100 SXM maximum TDP of up to 700 W (configurable) | Reference 21 https://www.nvidia.com/en-us/data-center/h100/ | Sourced |
| Conversion to average power (TWh / 8,760), facility power for 100 MW of IT load (120 MW at PUE 1.2, 140 MW at 1.4) and an upper-bound GPU-count estimate, volume flows of air and water (18 K air rise, 10 K water rise, 120 kW), thermal resistance (assuming 85 °C and 35 °C), and the power of a rack of four DGX H100 | Our calculation. Estimates with stated assumptions (temperature rises, case temperature, property values, PUE), not design values or predictions for any facility | Our calculation |
| The four-term organization of IT load, facility power, utility capacity and plans; "rated is not the same as running"; "wetted materials are central to design"; "coolant is a consumable"; "efficiency and materials reliability trade off through temperature"; and "the PUE denominator shrinks" | This article's organization and commentary based on published material, not views stated by the organizations | Commentary |
| Sizes of individual facilities, the rack power consumption of the DGX Vera Rubin NVL72, texts of standards, and the final ECHA rule | Not confirmed within this article's research and therefore not given; this article's note | Commentary |
Last updated: 15 October 2026. Sources are limited to primary material (the IEA, DOE / LBNL, official NVIDIA guides and blogs, ASHRAE, OCP and ISO pages, and official material from Google, 3M and ECHA). The size of individual facilities, the rack power consumption of the DGX Vera Rubin NVL72, the texts of standards and the final ECHA rule could not be confirmed and are not given. Planned, contracted or announced capacity and future figures are "not yet confirmed". Figures 2 and 5 are vector drawings, Figures 3, 4 and 6 include our calculations, and Figures 1 and 7 are AI-image placeholders only.