TECHNOLOGY EXPLAINER
Solar Cells for Space
— how to read "30% efficiency", radiation damage, deployable panels, and where new materials stand
Much of the electricity on satellites and space stations comes from solar cells. But a solar cell in space faces different light, different ways of wearing out, and a much tighter weight limit than one on a roof. This article is written for readers who know nothing about spaceflight. It goes in this order, with figures and small calculations: (1) the light a cell receives depends on distance and angle; (2) "efficiency" is a number tied to conditions (AM0); (3) a triple-junction cell shares sunlight among three layers; (4) radiation disturbs the crystal and output falls; (5) panels that are rolled up for launch and unrolled in orbit; (6) where perovskite and other new materials stand today. It does not say "space-grade means better than ground-grade", nor that "new materials will replace the mainstream". It separates what was confirmed, what is only planned, and what could not be confirmed.
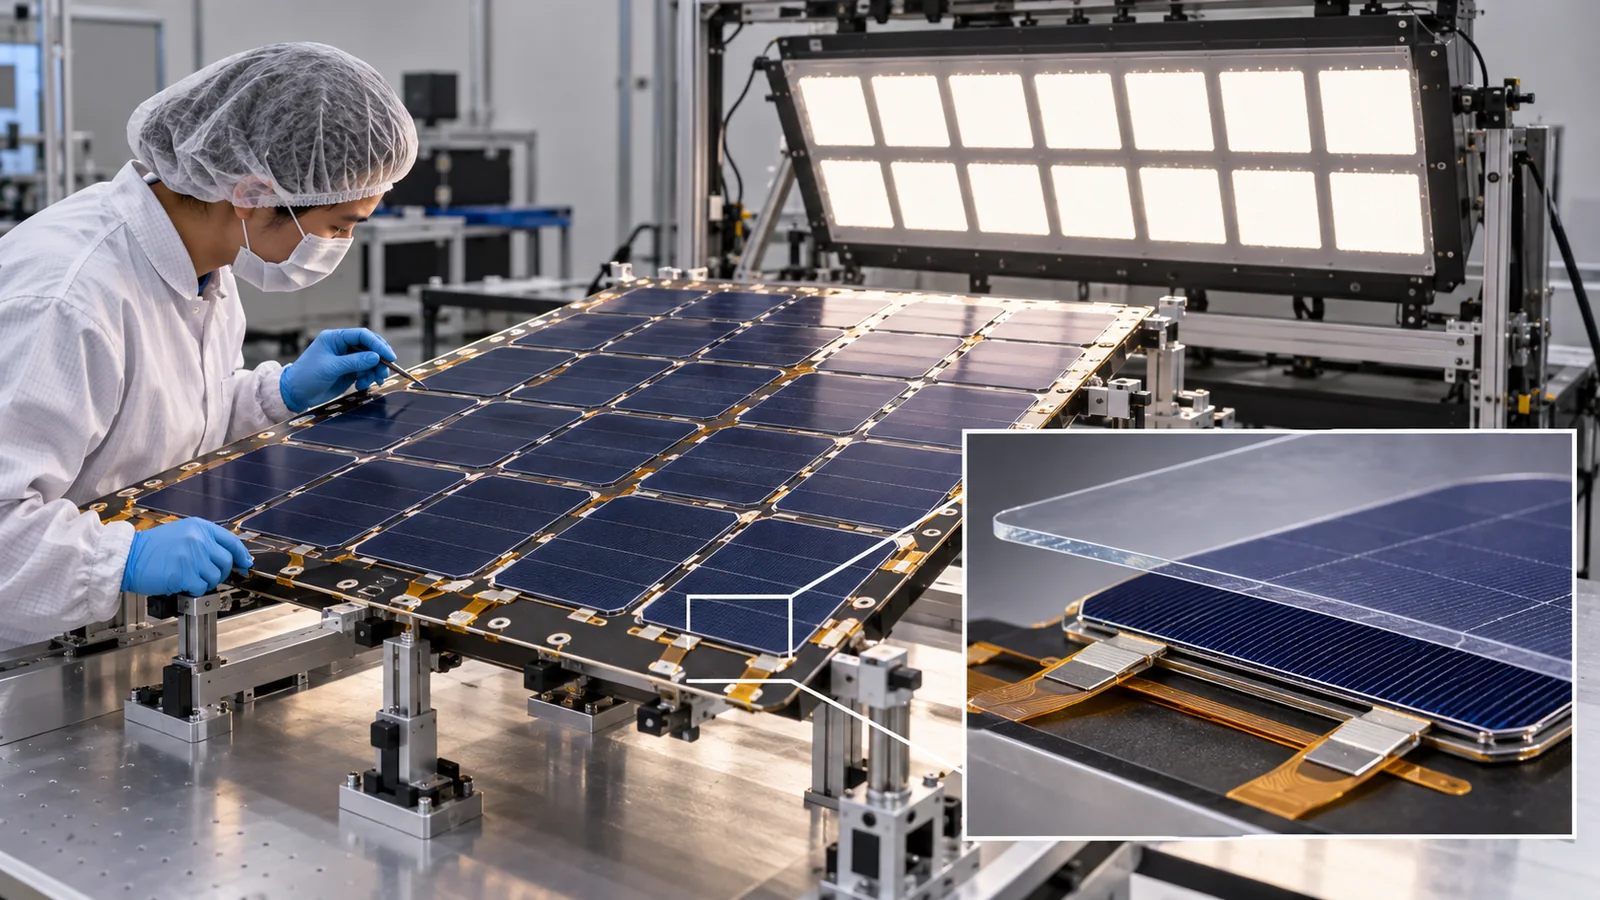
- The short version / what to know first / where this sits in the series
- The light a solar cell receives depends on distance and angle
- Before "30% efficiency": the condition called AM0
- Triple-junction cells: three layers share the colors of sunlight
- What radiation does: displacement damage and degradation curves
- Heat and weight: how much area and mass does 1 kW take?
- Deployable panels: rolled up for launch, unrolled in orbit
- Silicon, thin films, perovskite, organics: where each stands
- Where things stand now (checked 17 October 2026)
- How to read the yardsticks and standards
- Glossary / References / Claim-to-source audit
Sourced = stated in published material (link given)
Our calculation = a value this article calculated or organized, with the assumptions stated
Not yet confirmed = a plan, a target, or an experiment under way whose result could not be confirmed
Structural readings and materials-design interpretations are marked separately as Commentary. Inference is shown in bold. Every analogy comes with a "limit of the analogy".
Efficiency, power and degradation figures are given only together with the light used (AM0 and so on), the temperature, the radiation dose, and whether they refer to a cell, a panel or an array. Manufacturer figures are labelled "company's stated value" and kept apart from independently verified ones. Numbers taken under different conditions (space versus ground, cell versus array, different makers) are not ranked against each other. New materials such as perovskites are at the research and demonstration stage, and no benefit or value is asserted for them. This field changes fast, so the state of missions, hardware and standards carries a checking date (17 October 2026).
1. The short version / what to know first / where this sits in the series
- The space mainstream is III-V multi-junction cells: NASA describes the current state of the art as 3- to 5-junction cells made of Group III-V materials such as GaAs, InGaP and Ge, with a nominal efficiency of about 30% and a high of 34%Sourced[Ref. 1].
- "Efficiency" is a number tied to conditions: space cells are measured under AM0 (sunlight with no atmosphere). The same cell is 29.2% or 29.5% depending only on which solar-irradiance value is used as the denominatorSourced[Ref. 2]. It cannot be set directly beside a ground-test record.
- Radiation is the main wear mechanism: high-energy particles disturb the crystal and output falls. For one manufacturer-rated cell, efficiency drops from 29.2% to 26.0% at a 1 MeV electron fluence of 1015 per cm² and to 18.4% at 1016 per cm²Sourced[Ref. 2]. New materials (perovskites and others) are mostly at the ground-test and short-flight stage; operation as a spacecraft's main power source could not be confirmed in the sources used here.
You need no prior knowledge. "A solar cell turns light into electricity" and "space has no air" are enough. Orbits and satellite basics are in this series' explainers on the space industry overview and on the space environment and materials; the points needed here are explained briefly. Equations are kept to a minimum, with the meaning explained in words and checked with a numerical example. Harder material sits in collapsible "More detail" sections.
Of the "five enemies" of the space environment (1. vacuum, 2. radiation, 3. large temperature swings, 4. atomic oxygen and ultraviolet light, 5. microgravity and debris), solar cells mainly fight 2. radiation and 3. temperature swings, plus the discoloration of cover glass and adhesives under ultraviolet light (4). After this article, read our explainer on batteries for space (which store the energy used in shadow), then our explainer on flexible solar cells (perovskite on bendable substrates, mostly ground-based research). Nuclear power sources for the Moon and deep space are covered in our explainer on nuclear power for space, and radiation effects on electronic parts in our explainer on radiation and electronic components.
2. The light a solar cell receives depends on distance and angle
Start with an everyday example. Bring a flashlight close to a wall and the bright circle is small and intense; move it away and the circle grows and dims. The amount of light is the same, but the wider it spreads, the weaker it is per square meter. Sunlight behaves the same way.
Double the distance from the Sun and the same light spreads over four times the area, so the intensity per square meter becomes one quarter. This is called the inverse-square law. NASA's material likewise explains that the light reaching a solar array varies with the inverse square of the distance from the SunSourced[Ref. 1]. The second factor is orientation. Output is greatest when the panel faces the Sun squarely, and falls in proportion to the cosine of the tilt angle as the panel is tilted awaySourced[Ref. 1].
The Jupiter probe Juno shows how strongly this "light fades with distance" effect bites. According to a JPL release (13 January 2016), Juno carries three solar arrays about 9 m (30 ft) long with 18,698 cells; at the Earth's distance from the Sun they could generate about 14 kW, but Jupiter is about five times farther away, sunlight there is 25 times weaker, and the arrays are expected to produce only about 500 W at JupiterSourced[Ref. 5]. The same release says the eight earlier spacecraft that had reached Jupiter all used nuclear power sourcesSourced[Ref. 5]. The farther out you go, the worse solar cells fare and the more nuclear power sources matter (see our explainer on nuclear power for space).
Divide 14 kW by 25 and you get about 560 W. That is close to JPL's "about 500 W", but it does not match exactly, because the real value also depends on temperature, degradation and instrument conditions (Our calculation 14,000 / 25 = 560 W). Limit of the analogy: the flashlight picture explains only the spreading with distance. The real output of a solar cell is also governed by temperature and degradation.
3. Before "30% efficiency": the condition called AM0
The "efficiency" of a solar cell is the fraction of the light energy that arrives which is turned into electricity. But what counts as "the light that arrives"? In space there is no atmosphere, whereas on the ground the light is weakened as it passes through the air. So the test condition has to be fixed.
- AM0 (air mass zero): sunlight that has not passed through the atmosphere. Space cells are measured under this condition. AM stands for air mass, the amount of air the light crosses. The abstract of ISO 15387 (on measurement and calibration of single-junction space cells; now withdrawn) also states that the body of the standard covers AM0 standard calibrationSourced[Ref. 20].
- AM1.5G: the light used in ground standard tests, after passing through the atmosphere (G means global: direct plus scattered light). Its intensity is fixed at 1000 W/m² and the cell temperature at 25 °C (as stated in efficiency tables Version 64)Sourced[Ref. 7].
Even the intensity of AM0 light comes with a convention. The datasheet of AZUR SPACE (a German cell maker) uses AM0 WRC, 1367 W/m², 28 °CSourced[Ref. 2]. By contrast, Kopp and Lean report that satellite measurements put the solar input at the 2008 solar minimum at 1360.8 ± 0.5 W/m², lower than the canonical value set in the 1990s (1365.4 ± 1.3 W/m²)Sourced[Ref. 6]. The paper explains that this is not a weaker Sun: scattered light in earlier radiometers caused the higher readings.
The reference itself also gets updated. The 2023 edition (Rev. 2) of the European space standard ECSS-E-ST-20-08C specifies, as the AM0 reference spectral irradiance, the spectrum of a paper by Gueymard (2018), and notes that it corresponds to 1361.1 W/m² (solar constant at AM0, normal incidence)Sourced[Ref. 23, 24]. That differs from the 1367 and 1353 W/m² in the maker's datasheet, so you need to check which edition of the reference was used for an efficiency value.
Do not compare the bare numbers. As the figure shows, space cells are measured under AM0 (1367 W/m², 28 °C) while the ground efficiency tables use AM1.5G (1000 W/m², 25 °C), so both the denominator and the color distribution of the light differ. The ground 37.9% is a confirmed value for a small-area cell of a different structure (an InGaP/GaAs/InGaAs triple junction), whereas the space figure is a typical value for a production cell that went through radiation-hardened design and qualification: the purposes differ. A fair comparison needs the same four things: light condition, cell structure, area and production volume, and radiation tolerance.
In fact the same manufacturer-rated cell (3G30C-Advanced 6x12) is written two ways in the datasheet: 29.2% on a 1367 W/m² basis and 29.5% on a 1353 W/m² basisSourced[Ref. 2]. NASA's table also lists the same kind of cell at 29.5% [Ref. 1]. The numbers differ not because the cell differs but because the convention for the denominator differs. Inference: the datasheet probably gives both values so that readers can compare on matching conditions.
4. Triple-junction cells: three layers share the colors of sunlight
Sunlight is a mixture of many colors (wavelengths), from blue to infrared. A single-layer cell is good at light near one color; light of higher energy loses its surplus as heat, and light of lower energy simply passes through. So layers that favor different colors are stacked, each handling its own share. These are multi-junction cells. A review by Yamaguchi and co-workers likewise states that, as single-layer cells approached their theoretical limit (around 32–33%), the strategy for further gains is to stack materials with different bandgaps so that each absorbs a different color of the solar spectrumSourced[Ref. 8].
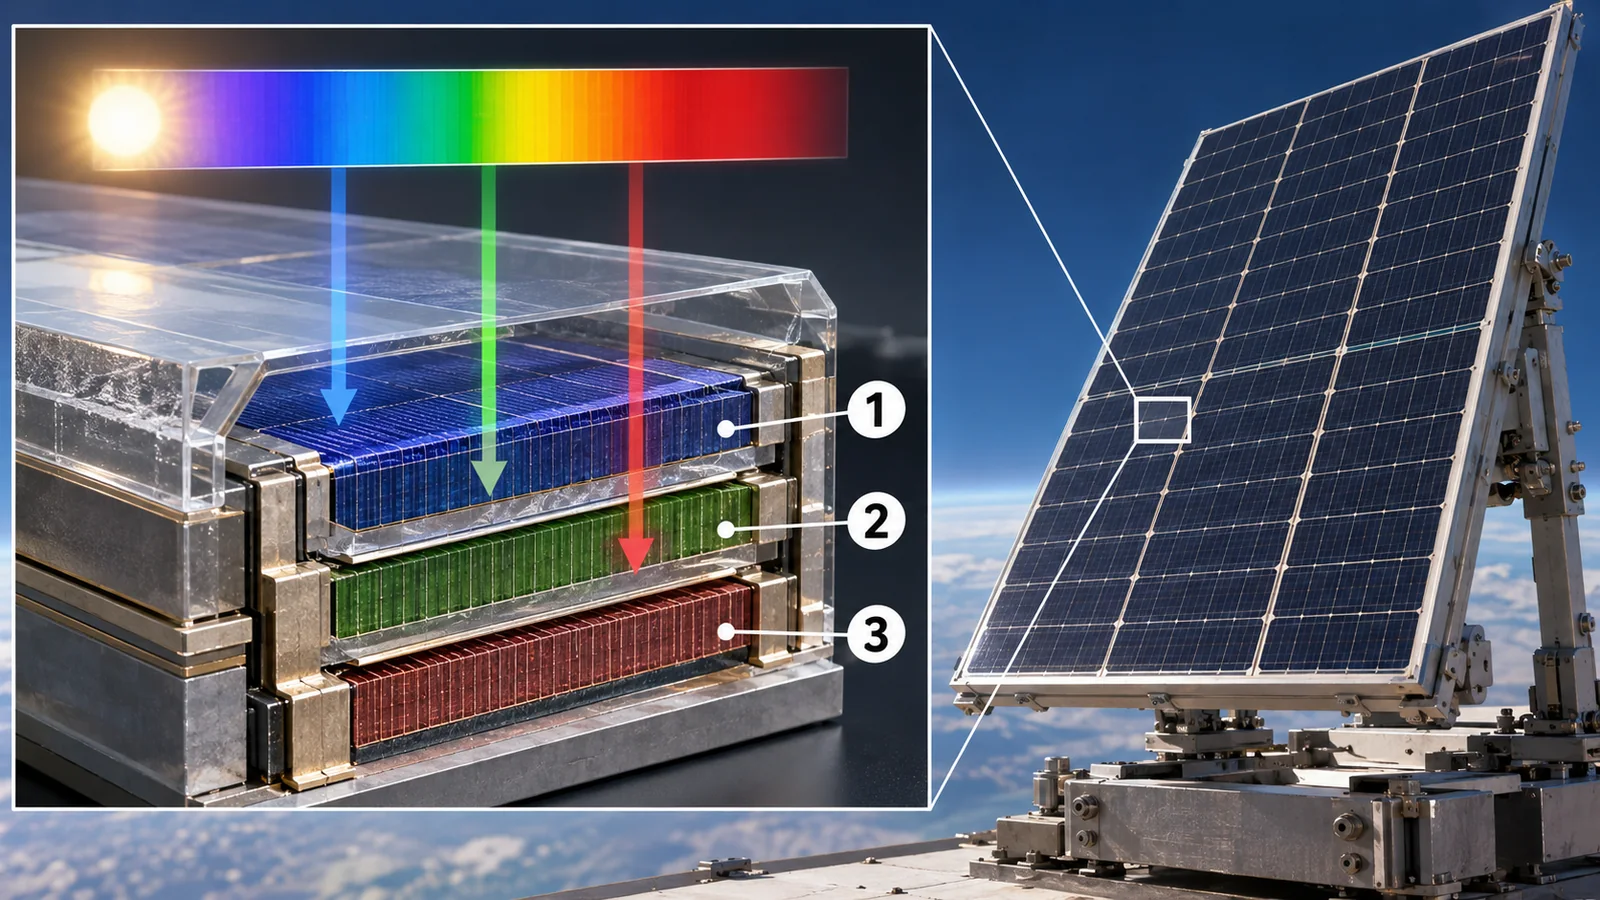
View original SVG, values and sources
Original SVG reference: Conceptual diagram (vector drawing). Layer thickness and order are simplified; this is not a cross-section of a real cell. The InGaP/GaAs/Ge stack is from the Azur Space datasheet; 3-5 junctions and 30-34% are from NASA's State-of-the-Art of Small Spacecraft Technology (version of 7 May 2026); 32-33% is from Yamaguchi et al. (2021)Sourced.
The three layers are connected in series, so the current is set by the layer that produces the least current (current matching). Each layer's material and thickness are therefore designed for the color distribution of space sunlight (AM0). Limit of the analogy: "sharing colors" is a picture of division of labor. In a real cell the layers absorb light and extract charge within one crystal at the same time, and the junctions between layers (tunnel junctions) and the anti-reflection coating also shape performance.
Reading the material construction from the datasheet of the Azur Space 3G30C-Advanced (6x12)Sourced[Ref. 2]:
- The base material is "InGaP/GaAs/Ge on Ge": layers of GaAs and InGaP are grown as crystals on a Ge substrate. The cell is 150 µm thick, 71.25 cm² (6 cm x 12 cm), and weighs 86 mg/cm² or less (about 6.1 g). The anti-reflection coating is TiO2/Al2O3.
- Silver-coated Kovar interconnects (a low-thermal-expansion alloy) are welded to the cell, and a 100 µm anti-reflection-coated cover glass is bonded on with adhesive. This is the "assembly" (CIC, cell-interconnect-coverglass): 290 µm thick and 123 mg/cm² or less.
- Commentary: to stack layers, the lattice sizes of neighboring crystals have to match (lattice matching); if not, defects multiply. In space cells, crystal quality bears directly on radiation-hardened design and on yield. The datasheet lists a "radiation-hardened design" as a feature but gives no numbers on what the design is (could not be confirmed).
The highest ground records (for example, 47.1% for a six-junction cell under concentrated light, reported by the US national laboratory NREL and colleagues) are values under ground research conditions such as concentration of the light by tens to a hundred timesSourced[Ref. 1, 8, 22]. Space cells take up parts of such research results, but are used only after volume production and qualification for radiation tolerance.
5. What radiation does: displacement damage and degradation curves
Why do solar cells wear out in space? Because space is full of high-energy electrons and protons (radiation). They race through the crystal of a solar cell and knock atoms out of place.
The vacancy left by a missing atom, or the displaced atom, becomes a "defect" that captures the electrons and holes (the charge carriers) produced by sunlight on their way out. Captured carriers cannot become current, so output falls. This is called displacement damage. Summers and co-workers at the US Naval Research Laboratory (NRL) showed that the size of the damage can be organized by the non-ionizing energy loss (NIEL), and correlated the damage from electrons, protons and gamma rays in Si, GaAs and InP devicesSourced[Ref. 9]. Walters and co-workers describe how defects made by electrons and protons lower the performance of triple-junction III-V cells [Ref. 11].
(1) The yardstick of degradation: the amount of 1 MeV electrons (fluence)
Radiation comes in many kinds and energies, so one approach converts "this orbit for this many years" into how many 1 MeV electrons per cm² would do the same damage. Messenger and co-workers compare the JPL "equivalent fluence" method with the NRL "displacement damage dose (DDD)" method, and note that the latter needs less experimental data, so it is easier to apply to new cell technologiesSourced[Ref. 10]. The figure below shows manufacturer-rated typical values.
In this example efficiency falls to about 89% (26.0 / 29.2) at 1015 per cm² and to about 63% (18.4 / 29.2) at ten times that dose, 1016 per cm²Our calculation. The shape is a gentle decline at first and a steeper one as the dose grows. How much dose a given orbit delivers depends greatly on the altitude, inclination, duration and shielding (such as cover-glass thickness). The values in this figure cannot be applied to the lifetime of any particular satellite.
Space has no air, so no rust and no humidity. It is tempting to think materials last longer there, but radiation, repeated temperature swings and ultraviolet light (discoloring cover glass and adhesive) wear materials in other ways. NASA's material also lists exposure to radiation, darkening of cover glass or adhesive, surface contamination and mechanical or electrical failures as degradation factorsSourced[Ref. 1]. Only the rate of degradation differs; degradation still happens.
More detail: why do materials differ in radiation tolerance?
Yamaguchi (1995) organized the results of 1 MeV electron irradiation of many kinds of solar cell (InP, InGaP, InGaAsP, GaAs, AlGaAs, InGaAs, Si, Ge, CuInSe2 and others) by their damage constants (how readily defects form), bandgaps and optical absorption coefficients. He states that the superior radiation resistance of CuInSe2 and InP-based cells is explained by the higher absorption coefficient of CuInSe2 and the lower defect-introduction rates of InP-based materialsSourced[Ref. 12]. A high absorption coefficient lets a thin layer absorb the light, so defects matter less. Commentary: thinness helps both weight and radiation tolerance.
6. Heat and weight: how much area and mass does 1 kW take?
Let us make this concrete with numbers. Using the Azur Space datasheet (company's stated values), we estimate the area and mass of bare cells needed for 1 kW.
| Condition (calculated here from the company's stated values) | Power density (W/m²) | Cell area needed for 1 kW | Mass with cover glass (CIC) |
|---|---|---|---|
| Beginning of life (BOL), 28 °C | about 399 | about 2.5 m² | about 3.1 kg |
| After 1015 1 MeV electrons per cm² (an example of end of life), 28 °C | about 355 | about 2.8 m² | about 3.5 kg |
| Same degradation, with the cell at 78 °C (50 °C above 28 °C) | about 306 | about 3.3 m² | about 4.0 kg |
Our calculation: the maximum-power-point voltage and current (Vmp x Imp) of the single cell (71.25 cm²) were taken from the datasheet, and the temperature coefficients (ΔVmp/ΔT = −7.2 mV/°C, ΔImp/ΔT = +0.66 mA/°C) were applied as straight lines. The mass uses the 123 mg/cm² (1.23 kg/m²) of the cover-glass assembly and excludes substrate, wiring, structure and deployment mechanism. 78 °C is an example; the real operating temperature depends on orbit and attitude.
Two things follow. First, solar-cell area is set by "light intensity x efficiency", so both degradation and heat increase the area (and so the weight) needed. Under the degraded, hot condition the area is about 30% larger than at the initial 28 °C (about 3.3 / about 2.5 = 1.3, Our calculation). Second, voltage falls as temperature rises, so how heat is shed matters.
The datasheet states that the solar absorptance of the cover-glass assembly is 0.91 or lessSourced[Ref. 2]. Using this upper limit, about 1244 W/m² of the 1367 W/m² is absorbed, and subtracting the roughly 394 W/m² that the assembly (28.8% at BOL, 1367 W/m² basis) converts to electricity leaves up to about 850 W/m² as heatOur calculation (0.91 x 1367 − 28.8% x 1367 = 1244 − 394; this uses the upper limit, so the real value is no higher). Space has no convection; heat leaves only by radiation (see our explainers on thermal control of spacecraft and on thermal-control materials and radiative cooling). So the surface properties of the cover glass (absorptance and emittance), the clarity of the adhesive and its resistance to ultraviolet discoloration all feed into both electrical and thermal performance. This is why NASA lists "darkening of cover glass or adhesive" as a degradation factor [Ref. 1].
7. Deployable panels: rolled up for launch, unrolled in orbit
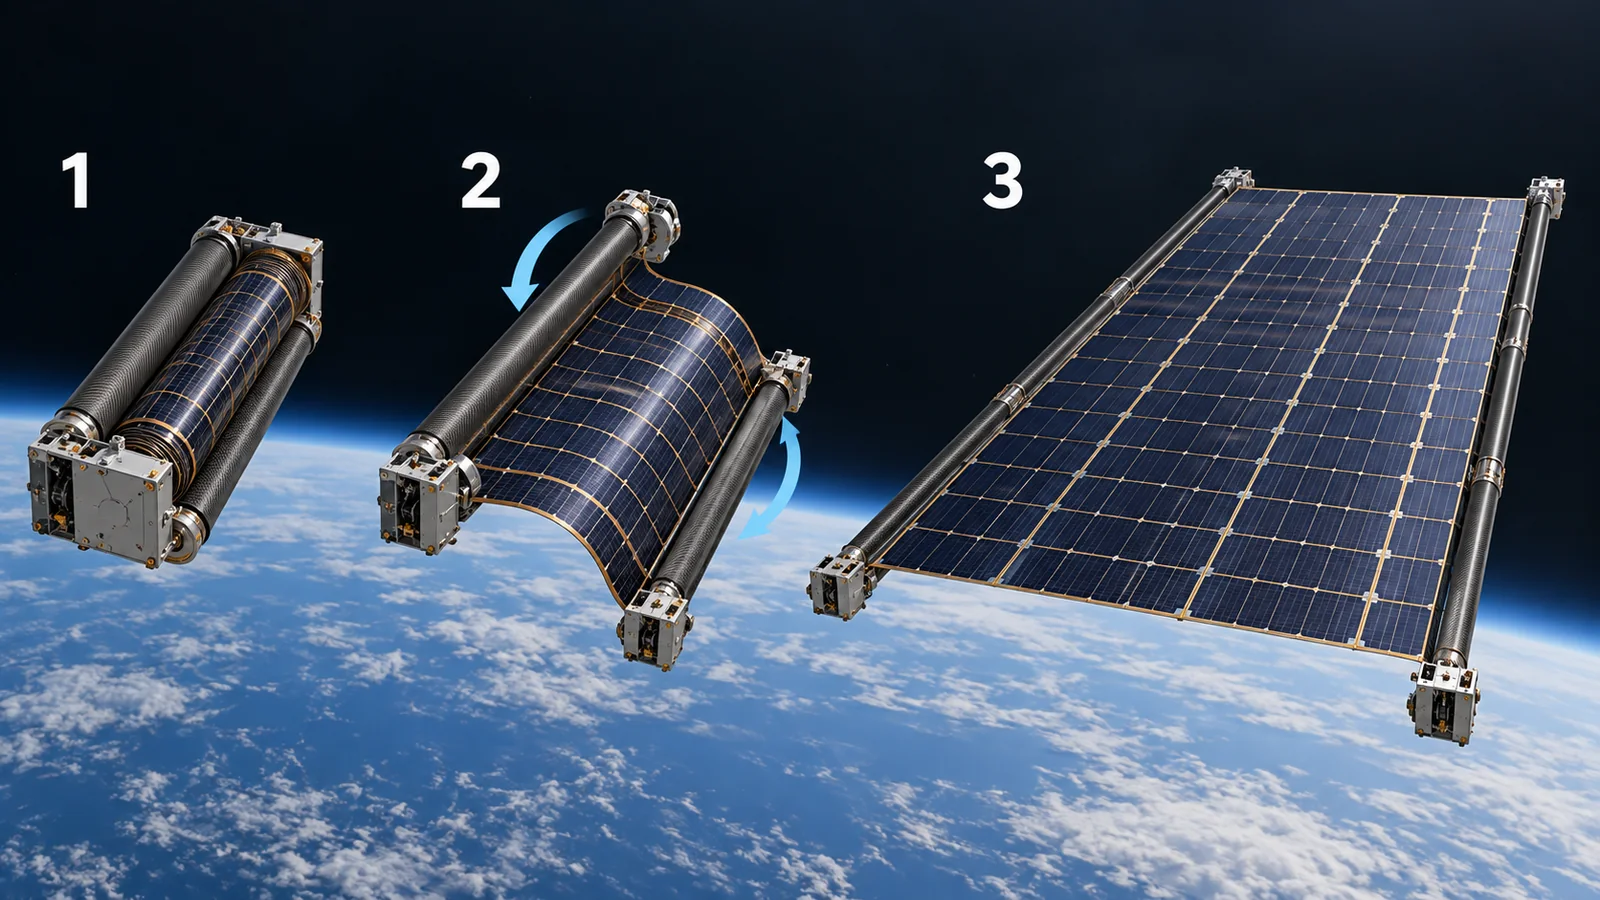
Inside a rocket, space is tight and so is the weight budget. To carry a large solar array you fold (or roll) it for launch and unfold it in space. This is called "deployable". NASA's material says deployed arrays are often the largest structure on a satellite and are used to raise power within a small satellite's limited volume, but they add design complexity, reliability concerns and riskSourced[Ref. 1].
A representative example is iROSA (ISS Roll-Out Solar Array) on the International Space Station (ISS). According to NASA, the first pair of ISS arrays was deployed in December 2000 with a 15-year design life. They now show "signs of degradation, as expected", and new arrays are being mounted over six of the eight power channels to boost power. The original eight arrays can generate up to about 160 kW (during orbital daytime); each new array produces more than 20 kW, and the goal at completion is up to about 215 kWSourced[Ref. 3]Not yet confirmed. The new arrays are a larger version of ROSA technology, whose mechanical deployment was demonstrated on the ISS in June 2017 [Ref. 3].
iROSA was supplied by Boeing (NASA's prime contractor for ISS operations), its subsidiary Spectrolab, and the major supplier Deployable Space Systems, and was carried in the unpressurized trunk of the Dragon cargo spacecraft [Ref. 3]. Installation is done by astronauts on spacewalks; in the example of 25 June 2021, deployment took about 10 minutes [Ref. 4]. NASA's page lists the launch and installation dates of three pairs (six arrays): June 2021, November–December 2022 and June 2023 (checked 17 October 2026) [Ref. 3].
Why look at "specific power" rather than efficiency
When comparing deployable panels, specific power (W/kg, output per unit weight) matters more than efficiency (%). Citing a 2024 analysis by Peretz and co-workers, NASA's material says flown solar arrays cluster around about 30 W/kg, with a maximum of 200 W/kg; that even if triple-junction cell efficiency reached its theoretical limit (about 40%), the area and mass needed for deep-space exploration would remain impractical; and that array mass has to come downSourced[Ref. 1]. NASA's product table also lists Redwire's ROSA (a flexible solar blanket) at 100 W/kg and 1000 W peak (BOL), but notes that this is the company's stated value and not independently verified by NASASourced[Ref. 1].
BOL (beginning of life) is the start of operation and EOL (end of life) is near the end. Space missions are designed on the EOL output. NASA's material likewise says that, because solar arrays are life-limiting components, EOL performance at operating temperature is a critical metric [Ref. 1]. "Peak BOL power" in product tables is mostly the initial peak output under standard conditions of about 28 °C, which does not depend on the mission (orbit, degradation, temperature) [Ref. 1]. When comparing products, check that this definition is the same.
8. Silicon, thin films, perovskite, organics: where each stands
So far we have discussed the III-V mainstream. Next we sort out where the other materials stand in space today, in terms of stage (ground research, ground space-environment tests, short flight, exposure in orbit, operation as main power). This is not a ranking of performance.
| Material | What was confirmed | Challenges that are cited | Class |
|---|---|---|---|
| III-V multi-junction | NASA sums up the current space state of the art as 3- to 5-junction III-V cells, nominal 30% and high 34% [Ref. 1]. The maker claims on-orbit heritage (TRL-9 level) and qualification to ECSS-E-ST-20-08C Rev. 1 (stated by the maker) [Ref. 2] | Cells account for a large share of a spacecraft's mass, area and cost [Ref. 1]. Radiation degradation [Ref. 2, 10] | Sourced |
| Silicon | NASA puts single-junction cells (mostly silicon) at about 20% efficiency, used mainly for short-lifetime or cost-sensitive missions. NASA's table lists an Azur silicon cell (S 32) at 16.8% initial efficiency [Ref. 1] | Low efficiency. Its radiation response differs from that of III-V cells, with a different damage pattern [Ref. 9, 12] | Sourced |
| CIS / CIGS thin film | CuInSe2 is described as radiation-resistant under 1 MeV electron irradiation [Ref. 12], and CuInSe2 cells flew on the Equator-S mission, where on-orbit data were compared with degradation predictions [Ref. 10]. Thin-film layers are from under 1 to a few µm thick and can be light and flexible [Ref. 1] | NASA cites manufacturing complexity, temperature sensitivity, and lower durability and efficiency [Ref. 1]. ECSS-E-ST-20-08C Rev. 2 excludes thin-film and polycrystalline cells from its scope [Ref. 17] | Sourced |
| Perovskite | The review by Tu et al. (2021) sees promise in high efficiency, high specific power, compatibility with flexible substrates and radiation resistance, but says research for space is still in its infancy [Ref. 13]. Lang et al. (2016) report, from in-situ measurement during proton irradiation, that the cells withstand proton doses almost three orders of magnitude above the damage threshold of crystalline silicon, and that self-healing begins after irradiation stops [Ref. 14]. Reb et al. (2020) confirmed on a suborbital rocket (apogee 239 km, about 251 s) that perovskite and organic cells work in space light [Ref. 15]. NASA reports that a perovskite thin film (a film, not a cell) exposed outside the ISS for about ten months (launched March 2020, returned January 2021) stayed dark and degraded less than a ground reference sample [Ref. 26]. Putz et al. (Advanced Materials, 2026) report that on the satellite SSPD-1 in low Earth orbit (about 540 km) the best rigid cell kept about 80% of its initial efficiency (measured over 44 days within about 100 days after launch, across about 1,600 eclipse cycles), and that flexible cells kept more than 92% of their efficiency after a proton dose equivalent to 50 years in orbit [Ref. 27] | NASA names degradation, insufficient long-term stability, and durability under prolonged harsh space radiation as the main limits [Ref. 1]. Long-term on-orbit data could not be confirmed in the sources used here | Sourced |
| Organic (OPV) | NASA gives about 20% efficiency in the laboratory, and notes a report that protons break side chains and create electron traps, but that heating (annealing) repairs the damage [Ref. 1]. Also part of the rocket experiment of Reb et al. (2020) [Ref. 15] | NASA says standardized stability tests for organic cells are not yet available [Ref. 1] | Sourced |
Checked 17 October 2026. Figures for each material are reported under different conditions (light source, cell area, temperature). The arrangement of the table is Our calculation (organization).
That cannot be said at present. There are reports showing tolerance to proton irradiation (Lang et al.), a short rocket experiment (Reb et al.), the result for a thin film exposed outside the ISS for about ten months (NASA) [Ref. 26], and cells measured for a few dozen days on a satellite (Putz et al.) [Ref. 27], but the years to more than a decade of on-orbit durability that a main power source needs, including vacuum, ultraviolet light and repeated temperature swings, is still to be established. In October 2025 Ricoh announced that its perovskite solar cells had been mounted on JAXA's HTV-X1 cargo spacecraft and that, after arrival at the ISS, a demonstration would expose them to space for about two months while current-voltage characteristics are measured [Ref. 16]. No result of this demonstration could be found by the checking date.
NASA's material cites manufacturing complexity, temperature sensitivity and durability as limits for thin-film cells in space [Ref. 1]. Commentary: perovskite and organic materials are already vulnerable to moisture, oxygen, heat and light on the ground, where glass or polymer-film encapsulation protects them. In space, vacuum (outgassing from the encapsulant), atomic oxygen and ultraviolet light, radiation, and large day-night temperature cycling are added. So the question is not only whether the material is tough, but whether the whole stack, including encapsulant, electrodes, interfaces and substrate, survives them. Using a film substrate to gain lightness (specific power) then raises the heat, ultraviolet and atomic-oxygen resistance of the substrate as a problem (see our explainer on polyimides for space). Ground results have to be re-checked in space-oriented tests. For the general challenges of perovskites, see our explainer on flexible solar cells.
9. Where things stand now (checked 17 October 2026)
This field changes quickly, so we set out what could be confirmed from primary sources, with a checking date. A company's claim is written as that company's claim.
| Item | What was confirmed | Class |
|---|---|---|
| Level of the mainstream cell | In NASA's summary (version of 7 May 2026) the present space state of the art is a 3- to 5-junction III-V cell with a nominal 30% and a high of 34%. A manufacturer-rated cell (Azur Space 3G30C-Advanced) shows 29.2% initially at AM0, 1367 W/m² and 28 °C, and 26.0% after 1015 1 MeV electrons per cm² [Ref. 1, 2] | Sourced |
| Deployable arrays on the ISS | NASA's page lists the launch and installation dates of six iROSA arrays (three pairs: June 2021, November–December 2022, June 2023). Each new array produces more than 20 kW. The same page states a goal of up to about 215 kW at completion [Ref. 3] | Sourced |
| Space demonstrations of perovskite | A rocket experiment in 2020 (apogee 239 km at about 251 s) [Ref. 15]. A thin film exposed outside the ISS for about ten months, March 2020 to January 2021 (NASA) [Ref. 26]. Cells measured on the satellite SSPD-1 (Putz et al., 2026) [Ref. 27]. In October 2025 Ricoh announced mounting on JAXA's HTV-X1, with about two months of exposure after ISS arrival [Ref. 16]. Chinese companies have also announced starting or running on-orbit tests (see the company profiles in the perovskite solar cell series), but no results could be confirmed | Sourced |
| Perovskite results and main-power use | The HTV-X1 demonstration result could not be found by the checking date. No case of perovskite operating as a spacecraft's main power source could be confirmed in the sources used here. NASA says attempts to stack perovskite on III-V cells are also being studied [Ref. 1] | Not yet confirmed |
| Qualification standards for thin films and new materials | ECSS-E-ST-20-08C Rev. 2 (20 April 2023) covers crystalline silicon and single- and multi-junction GaAs cells and excludes thin-film and polycrystalline cells [Ref. 17]. A space qualification standard that targets perovskites could not be confirmed | Sourced |
Checked 17 October 2026. Roadmaps and company targets are distinct from achieved facts.
The mainstay of space solar power is still the III-V multi-junction cell. Three habits are basic: read efficiency as a number tied to conditions, read degradation together with the radiation dose, and judge panels by specific power (W/kg). New materials (perovskite, organic, thin film) are promising for lightness and radiation tolerance, but track records of years to more than a decade on orbit have not yet been confirmed (on-orbit data covering a few dozen days to about ten months are starting to appear). Reading them by stage, without mixing in ground-use stories, is what matters.
10. How to read the yardsticks and standards
The quality of a space solar cell cannot be captured by one number. "Efficiency" changes with the light condition (AM0), the temperature and whether it is a cell or an array. "Degradation" is read together with the radiation dose (such as the equivalent 1 MeV electron fluence). "Lightness" is read as specific power (W/kg). And "will it really work in space?" is judged by qualification tests under a standard and by actual flight records. The table sets out what each yardstick measures and does not measure, as far as could be confirmed.
| Item assessed | Representative test or method (name, source) | Standards and guidance (ECSS, AIAA, ISO and others) | Cautions in reading |
|---|---|---|---|
| Cell efficiency (initial) | Current-voltage measurement under AM0 light. The maker states "AM0 WRC, 1367 W/m², 28 °C" [Ref. 2]Sourced | ISO 15387:2005 "Space systems — Single-junction solar cells — Measurements and calibration procedures" (ISO/TC 20/SC 14, edition 1, June 2005; withdrawn on the ISO page). It covers AM0 calibration of single-junction cells [Ref. 20]Sourced. A corresponding standard for multi-junction cells could not be confirmed. ECSS-E-ST-20-08C Rev. 2 specifies Gueymard (2018) as the AM0 reference spectral irradiance (1361.1 W/m²) and has the simulator's irradiance set with AM0-calibrated reference cells [Ref. 23, 24]Sourced | Check the denominator (1367, 1353, or ECSS Rev. 2's 1361.1 W/m²), the temperature and the area. Do not set it beside a ground percentage (AM1.5G, IEC 60904-3:2008) |
| Radiation degradation (EOL prediction) | The 1 MeV electron equivalent-fluence method (JPL) and the displacement damage dose (DDD) method (NRL) [Ref. 10]Sourced. ECSS-E-ST-20-08C Rev. 2 irradiates cells with 1 MeV and 3 MeV electrons and 1 MeV and 3 MeV protons (or energies agreed with the customer), with the cells kept in vacuum (below 10-3 Pa) or dry nitrogen or argon during irradiation [Ref. 23]Sourced | ISO 23038:2018 "Space systems — Space solar cells — Electron and proton irradiation test methods" (ISO/TC 20/SC 14, edition 2, February 2018, published; it covers only the irradiation test methods, not data analysis) [Ref. 25]Sourced. AIAA S-111A-2014 "Qualification and Quality Requirements for Space Solar Cells": AIAA announced that its 2014 revision added the option of defining radiation effects by the displacement damage dose method [Ref. 18, 21]Sourced (the text is paid and was not checked) | A typical value is "the value at that radiation dose". It must be converted to your own orbit's dose before use. Also check how protons and shielding are handled |
| Cell qualification (environmental tests) | Test items of ECSS-E-ST-20-08C Rev. 2 (visual inspection, dimensions and weight, electrical performance, temperature coefficients, spectral response, optical properties, humidity and temperature, coating adherence, pull test, electron and proton irradiation, photon irradiation and temperature annealing, reverse bias, thermal cycling and others) [Ref. 23]Sourced. The ultraviolet test uses 200–400 nm light, 4 intervals of 250 Sun-hours for low and geostationary Earth orbit missions, acceleration up to 5 Suns, and a temperature no more than 10 K above the operating temperature (for established material combinations) [Ref. 23]Sourced | ECSS-E-ST-20-08C Rev. 2 "Photovoltaic assemblies and components" (20 April 2023). It covers crystalline silicon and single- and multi-junction GaAs cells (thicker than 50 µm) and excludes thin-film and polycrystalline cells [Ref. 17]Sourced. AIAA S-111A-2014 (above) | A maker's "ECSS qualified" refers to a particular edition and a particular product. The standard itself says it does not cover the particular qualification requirements of a specific mission [Ref. 23] |
| Qualification of electrical components on panels | Qualification of the electrical components and substrate on a panel as they affect electrical performance (only title and scope were checked) | AIAA S-112A-2013 "Qualification and Quality Requirements for Electrical Components on Space Solar Panels". It covers panels carrying single-crystal silicon or GaAs cells with any number of junctions [Ref. 19]Sourced. ECSS-E-ST-20-08C does not cover qualification of arrays or panels [Ref. 17] | Cell qualification and panel qualification are separate. Panel qualification does not include acceptance testing (as S-112A states) |
| Output per unit weight of an array | Specific power (W/kg) and peak BOL power (standard condition about 28 °C) [Ref. 1]Sourced | Could not be confirmed (NASA's table collects manufacturers' published figures; NASA has not verified them independently) | Company's stated value. The definition of "power" (to the payload, or peak) differs between companies [Ref. 1] |
| On-orbit record | The output history in actual flight (for example, NASA notes "signs of degradation, as expected" on the original ISS arrays, in operation for more than 20 years [Ref. 3])Sourced | No corresponding standard could be confirmed | Degradation differs with orbit, altitude, duration and shielding. Keep it apart from ground-test values |
| Space stability of new materials (perovskite, organic) | In-situ proton irradiation (Lang et al.), a rocket experiment (Reb et al.), a thin film exposed outside the ISS (NASA, about ten months), cells measured on a satellite (Putz et al., about 44 days), exposure in orbit (Ricoh / JAXA, result unconfirmed) [Ref. 14, 15, 16, 26, 27] | No standardized test could be confirmed (NASA says standardized stability tests for organic cells are not yet available [Ref. 1]) | "Radiation resistant" is a proton-irradiation result, not overall durability including vacuum, ultraviolet light and temperature cycling |
The arrangement of the table is Our calculation (organization). Numbers, titles and status of standards were checked on the ECSS and ISO pages and on the ANSI Webstore pages, and the openly published ECSS text was also read (checked 17 October 2026). The texts of ISO and AIAA standards are paid and were not checked, so only titles and scope are given. The ASTM International website and its standards were not consulted.
Cautions in reading (for materials engineers)
- Ground tests and on-orbit records are different: electron and proton irradiation tests simplify real space radiation (particles of many energies arriving from all directions). Even if perovskite does well under proton irradiation, long-term on-orbit behavior has to be established separately.
- A company's stated value and third-party verification are different: the same datasheet notes that its typical values reflect a defined configuration across a large manufacturing population and may change with configuration or order volume [Ref. 2].
- A standard is a "qualification procedure", not a "guarantee of performance": qualification under ECSS-E-ST-20-08C confirms a particular configuration of that product. The standard says it does not cover mission-specific qualification requirements or the qualification of arrays and panels [Ref. 17, 23].
- Plans and achievements are different: the ISS's roughly 215 kW is a goal at completion, and the HTV-X1 demonstration is an announced experiment whose result is unconfirmed.
11. Glossary
- AM0
- Air mass zero: sunlight that has not passed through the atmosphere. The test condition for space solar cells.
- AM1.5G
- The light of ground standard tests (global light after the atmosphere): 1000 W/m², cell temperature 25 °C.
- BOL / EOL
- BOL = start of operation, EOL = near the end of life. Space designs use the EOL output.
- Solar irradiance
- Solar energy arriving per square meter (W/m²). About 1361–1367 W/m² at the Earth's distance.
- Multi-junction cell
- A cell stacking layers of different bandgaps, each turning its own share of the colors into electricity.
- III-V
- Semiconductors made from elements of groups 13 and 15 of the periodic table (GaAs, InGaP and so on).
- InGaP / GaAs / Ge
- The materials of the top, middle and bottom layers of a triple-junction cell. Ge also serves as the substrate.
- Bandgap
- The smallest light energy a semiconductor can absorb. It differs from layer to layer.
- Current matching
- In series-connected layers, the whole current is set by the layer with the least current.
- Displacement damage
- Defects made when high-energy particles knock atoms out of the crystal. The main cause of output loss.
- NIEL
- Non-ionizing energy loss: the energy a particle spends displacing atoms. Used to organize damage.
- Fluence
- The total number of particles that passed through a unit area (per cm²).
- 1 MeV electron equivalent
- A way to express the effect of various radiations as the number of 1 MeV electrons that would do the same damage.
- DDD
- Displacement damage dose: an energy-based measure of damage, used in the NRL method.
- Cover glass
- A thin glass sheet on the cell front. It shields the cell from radiation and particles and carries an anti-reflection coating.
- CIC
- Cell-interconnect-coverglass: a cell with its interconnects and cover glass (an assembly).
- Specific power
- Output per unit weight (W/kg). In space it can matter more than efficiency.
- Deployable array
- A solar array folded or rolled for launch and unfolded in space. ROSA and iROSA are examples.
- Perovskite solar cell
- A solar cell whose light absorber is a perovskite-type crystal. Can be light and flexible; at the research and demonstration stage in space.
- CIS / CIGS
- Thin-film solar cells of copper, indium, (gallium) and selenium.
- OPV
- Organic photovoltaics: cells that absorb light in organic molecules or polymers.
- Qualification
- Confirming by tests under a standard that a product design meets its requirements. Separate from acceptance testing.
12. References (primary sources)
- NASA "State-of-the-Art of Small Spacecraft Technology, 3.0 Power" (version of 7 May 2026; checked 17 October 2026) — nasa.gov/smallsat-institute/sst-soa/power-subsystems/
- AZUR SPACE Solar Power GmbH datasheet "TJ 3G30-Advanced (6x12) 30% Triple-Junction Bare Solar Cells & Assemblies" (DB 00010893-02, issue date 24 March 2026) — azurspace.com/media/uploads/file_links/file/bdb_00010893-02-00_3g30-advanced_6x12.pdf
- NASA "New Solar Arrays to Power NASA's International Space Station Research" (Mark A. Garcia, 11 January 2021; includes the Mission Overview dates; checked 17 October 2026) — nasa.gov/missions/station/new-solar-arrays-to-power-nasas-international-space-station-research/
- NASA Space Station blog "Spacewalkers Complete Second Roll-Out Solar Array Installation" (25 June 2021) — nasa.gov/blogs/spacestation/2021/06/25/spacewalkers-complete-second-roll-out-solar-array-installation
- NASA / JPL "NASA's Juno Spacecraft Breaks Solar Power Distance Record" (13 January 2016) — jpl.nasa.gov/news/nasas-juno-spacecraft-breaks-solar-power-distance-record
- Kopp G., Lean J. L. "A new, lower value of total solar irradiance: Evidence and climate significance", Geophys. Res. Lett. 38, L01706 (2011), DOI 10.1029/2010GL045777 — doi.org/10.1029/2010GL045777
- Green M. A. et al. "Solar cell efficiency tables (Version 64)", Prog. Photovolt. Res. Appl. 32, 425–441 (2024), DOI 10.1002/pip.3831 — doi.org/10.1002/pip.3831
- Yamaguchi M. et al. "Multi-junction solar cells paving the way for super high-efficiency", J. Appl. Phys. 129, 240901 (2021), DOI 10.1063/5.0048653 — doi.org/10.1063/5.0048653
- Summers G. P. et al. "Damage correlations in semiconductors exposed to gamma, electron and proton radiations", IEEE Trans. Nucl. Sci. 40, 1372–1379 (1993), DOI 10.1109/23.273529 — doi.org/10.1109/23.273529
- Messenger S. R. et al. "Modeling solar cell degradation in space: A comparison of the NRL displacement damage dose and the JPL equivalent fluence approaches", Prog. Photovolt. Res. Appl. 9, 103–121 (2001), DOI 10.1002/pip.357 — doi.org/10.1002/pip.357
- Walters R. J. et al. "Radiation response mechanisms in multijunction III-V space solar cells", 31st IEEE Photovoltaic Specialists Conference, 542–547 (2005), DOI 10.1109/PVSC.2005.1488188 — doi.org/10.1109/PVSC.2005.1488188
- Yamaguchi M. "Radiation resistance of compound semiconductor solar cells", J. Appl. Phys. 78, 1476–1480 (1995), DOI 10.1063/1.360236 — doi.org/10.1063/1.360236
- Tu Y. et al. "Perovskite Solar Cells for Space Applications: Progress and Challenges", Adv. Mater. 33, 2006545 (2021), DOI 10.1002/adma.202006545 — doi.org/10.1002/adma.202006545
- Lang F. et al. "Radiation Hardness and Self-Healing of Perovskite Solar Cells", Adv. Mater. 28, 8726–8731 (2016), DOI 10.1002/adma.201603326 — doi.org/10.1002/adma.201603326
- Reb L. K. et al. "Perovskite and Organic Solar Cells on a Rocket Flight", Joule 4, 1880–1892 (2020), DOI 10.1016/j.joule.2020.07.004 — doi.org/10.1016/j.joule.2020.07.004
- Ricoh "Ricoh perovskite solar cells installed on Japan Aerospace Exploration Agency cargo transfer spacecraft1 HTV-X1" (27 October 2025) — ricoh.com/release/2025/1027_1
- NASA "10-Month Voyage Proves Solar Cell Material Survives, Thrives in Space" (18 May 2023; a perovskite thin film exposed outside the ISS for about ten months; a film, not a cell) — nasa.gov/general/10-month-voyage-proves-solar-cell-material-survives-thrives-in-space
- Putz et al. "Beyond Earth: Resilience of Quasi-2D Perovskite Solar Cells in Space" (Advanced Materials 38, e20433, 12 February 2026; on-orbit measurements on the satellite SSPD-1; DOI checked with Crossref) — doi.org/10.1002/adma.202520433
- ECSS "ECSS-E-ST-20-08C Rev.2 – Photovoltaic assemblies and components (20 April 2023)" (standard page; scope checked) — ecss.nl/standard/ecss-e-st-20-08c-rev-2-photovoltaic-assemblies-and-components-20-april-2023/
- AIAA "AIAA S-111A-2014 Qualification and Quality Requirements for Space Solar Cells" (number, title and scope checked on the ANSI Webstore listing) — webstore.ansi.org/standards/aiaa/aiaa111a2014
- AIAA "AIAA S-112A-2013 Qualification and Quality Requirements for Electrical Components on Space Solar Panels" (checked on the ANSI Webstore listing) — webstore.ansi.org/standards/aiaa/aiaa112a2013
- ISO "ISO 15387:2005 Space systems — Single-junction solar cells — Measurements and calibration procedures" (ISO page; status Withdrawn; checked 17 October 2026) — iso.org/standard/36464.html
- AIAA "New Standard Available for Public Review: Qualification and Quality Requirements for Space Solar Cells" (notice of 17 March 2014; content of the S-111 revision) — aiaa.org/2014/03/17/new-standard-available-for-public-review-qualification-and-quality-requirements-for-space-solar-cells/
- Geisz J. F. et al. "Six-junction III–V solar cells with 47.1% conversion efficiency under 143 Suns concentration", Nat. Energy 5, 326–335 (2020), DOI 10.1038/s41560-020-0598-5 — doi.org/10.1038/s41560-020-0598-5
- ECSS ECSS-E-ST-20-08C Rev.2 (20 April 2023), full text (openly published PDF; scope, AM0 reference and test items checked) — ecss.nl/wp-content/uploads/2023/08/ECSS-E-ST-20-08C_Rev.2(20April2023).pdf
- Gueymard C. A. "Revised composite extraterrestrial spectrum based on recent solar irradiance observations", Solar Energy 169, 434–440 (2018), DOI 10.1016/j.solener.2018.04.067 — doi.org/10.1016/j.solener.2018.04.067
- ISO "ISO 23038:2018 Space systems — Space solar cells — Electron and proton irradiation test methods" (ISO page; status Published; checked 17 October 2026) — iso.org/standard/69495.html
13. Claim-to-source audit
| Claim in the text | Basis | Class |
|---|---|---|
| The space state of the art is 3- to 5-junction III-V cells (GaAs, InGaP, Ge and others), nominal 30% and high 34%. Single-junction cells (mostly silicon) about 20%. Light intensity varies with the inverse square of distance and with the cosine of the tilt. Degradation factors (radiation, darkening of cover glass and adhesive, contamination and so on). The role of deployable arrays, specific power clustering near 30 W/kg, ROSA at 100 W/kg and 1000 W peak (company's stated value), the Azur silicon cell S 32 at 16.8%, and NASA's summary on perovskite, thin-film and organic cells (limits, the Ricoh / JAXA mounting, the absence of standardized tests) | NASA, State-of-the-Art of Small Spacecraft Technology, Power chapter (version of 7 May 2026) Reference 1 https://www.nasa.gov/smallsat-institute/sst-soa/power-subsystems/ | Sourced |
| Construction of the 3G30C-Advanced (6x12) (InGaP/GaAs/Ge on Ge, 150 µm, 71.25 cm², 86 mg/cm² or less, TiO2/Al2O3 anti-reflection coating), the assembly (Ag-coated Kovar interconnects, 100 µm cover glass, 290 µm, 123 mg/cm² or less, absorptance 0.91 or less), efficiencies at AM0 WRC, 1367 W/m² and 28 °C (BOL 29.2%, 26.0% at 1015 per cm², 18.4% at 1016 per cm²), 29.5% on a 1353 W/m² basis, temperature coefficients, ECSS-E-ST-20-08C Rev. 1 qualification and on-orbit heritage (stated by the maker) | Manufacturer datasheet (24 March 2026). Company's stated value Reference 2 https://www.azurspace.com/media/uploads/file_links/file/bdb_00010893-02-00_3g30-advanced_6x12.pdf | Sourced |
| History of the ISS arrays (first pair December 2000, 15-year design life, signs of degradation), original eight arrays up to about 160 kW, each new array more than 20 kW, up to about 215 kW at completion (goal), suppliers, transport in the Dragon trunk, launch and installation dates of six iROSA arrays, the 2017 ROSA demonstration | NASA article and mission overview Reference 3 https://www.nasa.gov/missions/station/new-solar-arrays-to-power-nasas-international-space-station-research/ | Sourced |
| Deployment took about 10 minutes at the iROSA installation of 25 June 2021; each new array more than 20 kW | NASA ISS blog Reference 4 https://www.nasa.gov/blogs/spacestation/2021/06/25/spacewalkers-complete-second-roll-out-solar-array-installation | Sourced |
| Juno's arrays (about 9 m, three arrays, 18,698 cells, about 14 kW near Earth, about 500 W at Jupiter, light 1/25, the earlier eight probes nuclear-powered) | JPL release (13 January 2016) Reference 5 https://www.jpl.nasa.gov/news/nasas-juno-spacecraft-breaks-solar-power-distance-record | Sourced |
| Measured solar irradiance of 1360.8 ± 0.5 W/m² (2008 minimum), its difference from the earlier 1365.4 ± 1.3 W/m², and the cause (scattered light) | Abstract of Kopp and Lean (2011) Reference 6 https://doi.org/10.1029/2010GL045777 | Sourced |
| Ground standard test condition (AM1.5G, 1000 W/m², 25 °C, IEC 60904-3:2008); the ground InGaP/GaAs/InGaAs triple junction at 37.9% (Sharp, confirmed by AIST, 2013) | Efficiency tables Version 64 Reference 7 https://doi.org/10.1002/pip.3831 | Sourced |
| The efficiency limit of a single layer near 32–33%, the strategy of stacking layers of different bandgaps to share colors, 47.1% for six junctions (under concentration) | Abstract of Yamaguchi et al. (2021) Reference 8 https://doi.org/10.1063/5.0048653 Reference 22 https://doi.org/10.1038/s41560-020-0598-5 | Sourced |
| Damage can be organized by NIEL; correlation of damage from electrons, protons and gamma rays | Abstract of Summers et al. (1993) Reference 9 https://doi.org/10.1109/23.273529 | Sourced |
| The difference between the NRL displacement damage dose method and the JPL equivalent-fluence method, that the DDD method needs less experimental data, and the agreement of predictions with Equator-S flight data for GaAs/Ge and CuInSe2 cells | Abstract of Messenger et al. (2001) Reference 10 https://doi.org/10.1002/pip.357 | Sourced |
| Mechanism of defects from electrons and protons and the resulting performance loss in triple-junction III-V cells | Abstract of Walters et al. (2005) Reference 11 https://doi.org/10.1109/PVSC.2005.1488188 | Sourced |
| That differences in radiation tolerance between materials are explained by damage constants, bandgaps and absorption coefficients, and the reasons for the superior tolerance of CuInSe2 and InP-based cells | Abstract of Yamaguchi (1995) Reference 12 https://doi.org/10.1063/1.360236 | Sourced |
| That perovskite research for space is at an early stage, and the expected high specific power and radiation resistance | Abstract of Tu et al. (2021) Reference 13 https://doi.org/10.1002/adma.202006545 | Sourced |
| In-situ proton irradiation: tolerance of proton doses almost three orders of magnitude above the damage threshold of crystalline silicon, and self-healing after irradiation | Abstract of Lang et al. (2016) Reference 14 https://doi.org/10.1002/adma.201603326 | Sourced |
| Suborbital rocket experiment (apogee 239 km, 251 s, re-entry detection at 428 s) in which perovskite and organic cells worked and exceeded power densities of 7–14 mW/cm² | Abstract and text of Reb et al. (2020) Reference 15 https://doi.org/10.1016/j.joule.2020.07.004 | Sourced |
| Perovskite measurements in space: NASA exposed a thin film outside the ISS for about ten months (March 2020 to January 2021); Putz et al. measured cells on the satellite SSPD-1 (44 days; the best rigid cell kept about 80% of initial efficiency; flexible cells kept more than 92% after a 50-year-equivalent proton dose) | NASA release (18 May 2023; a film, not a cell); Putz et al. (2026) Reference 26 https://www.nasa.gov/general/10-month-voyage-proves-solar-cell-material-survives-thrives-in-space/ Reference 27 https://doi.org/10.1002/adma.202520433 | Sourced |
| Ricoh's perovskite cells mounted on HTV-X1 (launched 26 October 2025), to be exposed for about two months after ISS arrival with current-voltage measurement planned | Ricoh release (27 October 2025). A company announcement; it gives no result Reference 16 https://www.ricoh.com/release/2025/1027_1 | Not yet confirmed |
| Scope of ECSS-E-ST-20-08C Rev. 2 (20 April 2023): crystalline silicon and single- and multi-junction GaAs, thicker than 50 µm, excluding thin-film and polycrystalline cells, array and panel qualification out of scope | ECSS standard page Reference 17 https://ecss.nl/standard/ecss-e-st-20-08c-rev-2-photovoltaic-assemblies-and-components-20-april-2023/ | Sourced |
| Test items of ECSS-E-ST-20-08C Rev. 2, electron and proton irradiation (1 MeV and 3 MeV, vacuum or dry nitrogen or argon), ultraviolet test (200–400 nm, 250 Sun-hours x 4, up to 5 Suns), photon irradiation and temperature annealing, the AM0 reference (Gueymard 2018, 1361.1 W/m²), and that mission-specific qualification is out of scope | ECSS standard text (openly published PDF) and the bibliographic record of Gueymard (2018) Reference 23 https://ecss.nl/wp-content/uploads/2023/08/ECSS-E-ST-20-08C_Rev.2(20April2023).pdf Reference 24 https://doi.org/10.1016/j.solener.2018.04.067 | Sourced |
| ISO 23038:2018 number, title and scope (electron and proton irradiation test methods only) | ISO standard page (checked 17 October 2026) Reference 25 https://www.iso.org/standard/69495.html | Sourced |
| AIAA S-111A-2014 number, title and scope, and that the 2014 revision added the displacement damage dose option | ANSI Webstore listing and AIAA notice Reference 18 https://webstore.ansi.org/standards/aiaa/aiaa111a2014 Reference 21 https://aiaa.org/2014/03/17/new-standard-available-for-public-review-qualification-and-quality-requirements-for-space-solar-cells/ | Sourced |
| AIAA S-112A-2013 number, title and scope | ANSI Webstore listing Reference 19 https://webstore.ansi.org/standards/aiaa/aiaa112a2013 | Sourced |
| ISO 15387:2005 title and scope (single-junction space cells, AM0 standard calibration) and its status as Withdrawn | ISO standard page (checked 17 October 2026) Reference 20 https://www.iso.org/standard/36464.html | Sourced |
| The area and mass estimates for 1 kW (about 2.5 / 2.8 / 3.3 m², about 3.1 / 3.5 / 4.0 kg), the estimate that up to about 850 W/m² of absorbed light becomes heat, 14 kW / 25 = 560 W, cos 60° = 0.5, the percentages versus BOL (96 / 95 / 93 / 89 / 63) | Calculated from datasheet values; assumptions stated in the text Our calculation | Our calculation |
| Operation of perovskite as a space main power source, the HTV-X1 demonstration result, a space qualification standard for perovskites, the texts of the AIAA standards, an AM0 calibration standard for multi-junction cells, long-term on-orbit degradation data, and what Azur's "radiation-hardened design" consists of | Could not be confirmed in the primary sources reachable for this article, and so are not stated | Commentary |
| The readings "lattice matching bears on crystal quality", "the durability of the whole stack including encapsulation, interfaces and substrate is what is tested" and "heat management bears on cell voltage", and the flashlight and color-sharing analogies with their limits | Commentary in this article (readings based on sourced facts) | Commentary |
| That Figs. 1 to 9 are explanatory drawings and not observations of real data, and that Figs. 1 and 8 are frames for AI-generated concept images | A note by this article | Commentary |
Last updated 17 October 2026. Sources are limited to primary material (NASA and JPL material, manufacturer datasheets, peer-reviewed papers, standards-body pages of ECSS, AIAA and ISO, and company announcements). Manufacturer values are labelled as the company's stated values and kept apart from independently verified ones. The worked examples (area, mass, heat, ratios to BOL) are explanatory calculations made for this article and are not design values for any particular satellite. The roughly 215 kW for the ISS is a goal at completion, not a confirmed fact. The result of the HTV-X1 demonstration, operation of perovskite as a main power source, the texts of standards, an AM0 calibration standard for multi-junction cells, and long-term on-orbit degradation data could not be confirmed and are not stated here. All figures are explanatory conceptual drawings or drawings that include our own calculation; Figs. 1 and 8 are frames for AI-generated images (images not yet placed). They do not show any real facility, product or dimension.