TECHNOLOGY EXPLAINER
Satellite remote sensing and SAR
— How optical imaging and synthetic aperture radar work, how resolution is defined, and the antennas and materials
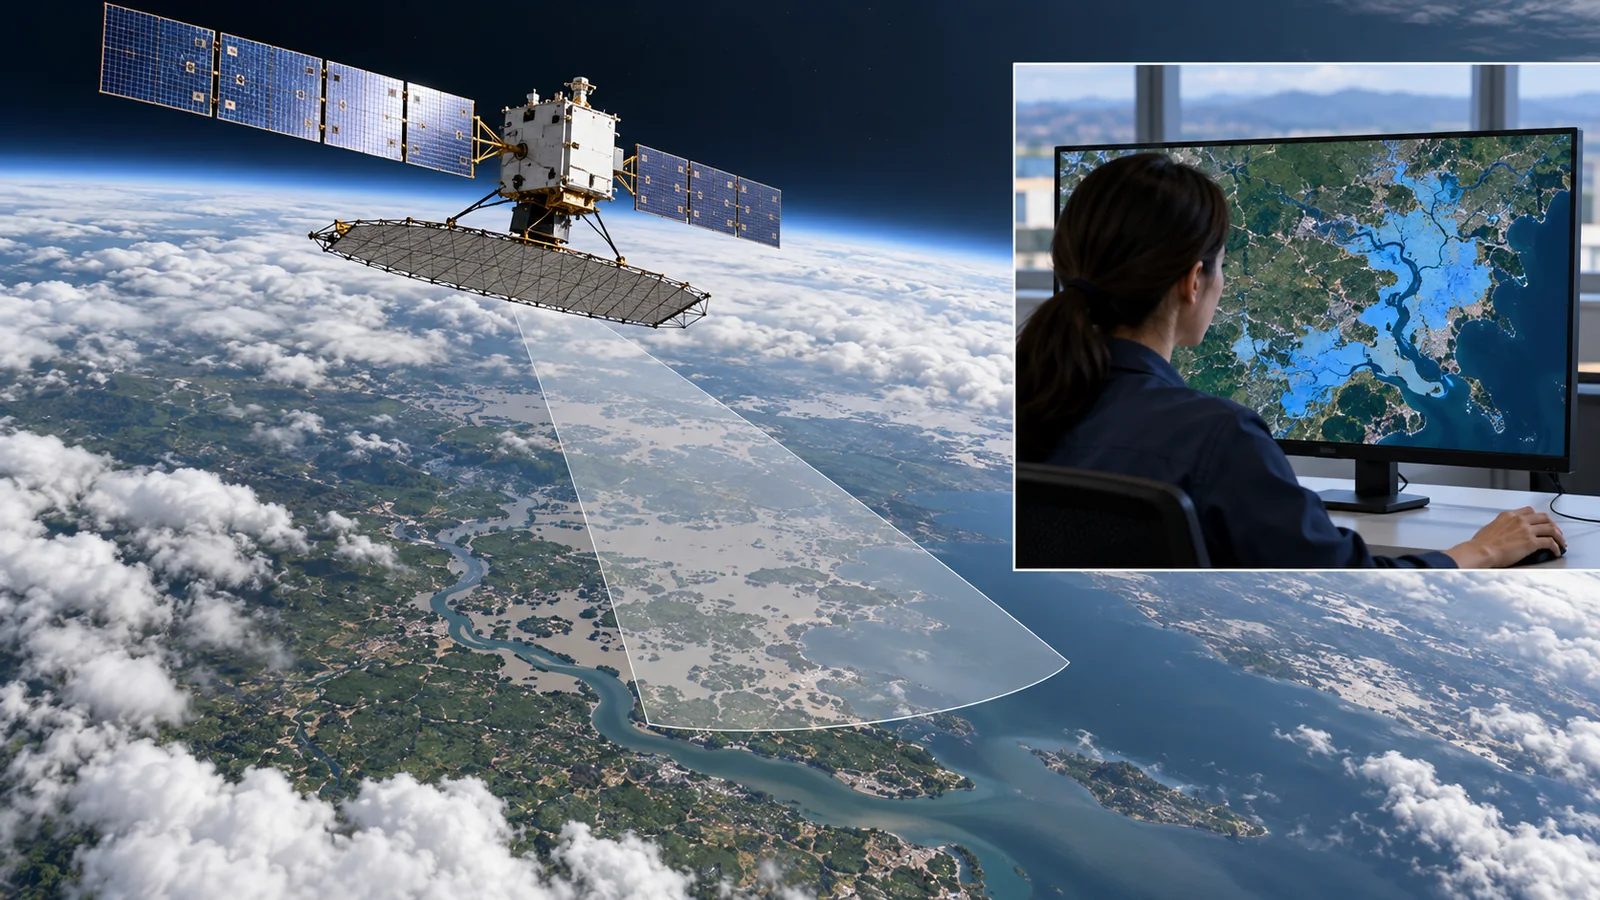
There are two main ways to observe the Earth from a satellite: optical imaging, which receives sunlight reflected by the ground, and SAR (synthetic aperture radar), in which the satellite sends its own radio and receives the echo. This article is written so that a materials engineer with no background in spaceflight can follow it: (1) how the two methods differ, (2) how "resolution" is defined (pixel size and what can be told apart are different things), (3) how SAR makes fine images with a small antenna, with formulas and worked numbers, and (4) the structures and materials of antennas and telescopes. Performance figures are given with the satellite and conditions, and company figures are treated as stated values.
- The short version / what to know first / place in the series
- Two ways to observe: optical and SAR
- Optical resolution: pixels and diffraction, with numbers
- How SAR works: looking sideways
- SAR resolution: two formulas checked against numbers
- Sorting out the definition of "resolution"
- Examples of results, with satellite and conditions
- Antenna and telescope structures and materials: a materials engineer's view
- Yardsticks and standards / glossary / references / audit
Sourced = stated in a published source (link given)
Our calculation = a value this article calculated from stated assumptions
Not yet confirmed = company targets and plans, pending applications and proceedings — anything not settled
Inference is shown in bold. Every analogy comes with its limits.
The resolution and limit numbers in Chapters 3 and 5 are explanatory values calculated here. Per-satellite figures are written as they appear on the pages of ESA, USGS, NASA, JAXA, eoPortal and the companies, with a check date (17 October 2026). Company figures are treated as company statements, and numbers with different definitions (pixel spacing, resolution cell and so on) are not lined up to rank anything. This field moves fast, so satellite statuses are as of the check date.
1. The short version, what to know first, and where this fits
- Two methods: optical imaging depends on sunlight and fails at night or under cloud. SAR sends its own radio and can image through night and cloud, but its images do not look like photographs Sourced [ref. 1, 14]
- "Resolution" is not one number: pixel spacing (GSD), the width over which a point spreads and the fineness at which two points can be told apart are different things. WorldView-3's 0.31 m pixel is smaller than the diffraction limit at 600 nm (about 0.41 m by our calculation) SourcedOur calculation [ref. 8, 18]
- SAR "synthesises" fineness: range resolution is set by bandwidth (c / 2B) and along-track resolution approaches half the antenna length (L / 2). Sentinel-1's bandwidth is up to 100 MHz and StriX's up to 600 MHz; the ideal formulas give 1.5 m and 0.25 m, close to stated values SourcedOur calculation [ref. 13, 1, 10]
"Observation" means studying the ground from a distance with electromagnetic waves (light or radio). "Wavelength" is the distance from one wave crest to the next: visible light is about 0.4-0.7 µm and SAR radio is a few centimetres (about 5.5 cm for C-band and 3 cm for X-band). A "pixel" is one cell of an image. A satellite flies a few hundred kilometres above the ground, so how many metres on the ground one pixel covers (GSD) matters. Formulas are few and are checked with numbers.
Orbit basics and low-orbit satellites are in the explainer on low-Earth-orbit constellations, the space environment in the one on the space environment and materials, composites in the one on space CFRP and composites, and heat in the one on spacecraft thermal control. This article focuses on observation methods, resolution and the materials of antennas and telescopes. For photodetector materials, see our photodetector explainer.
2. Two ways to observe: optical and SAR
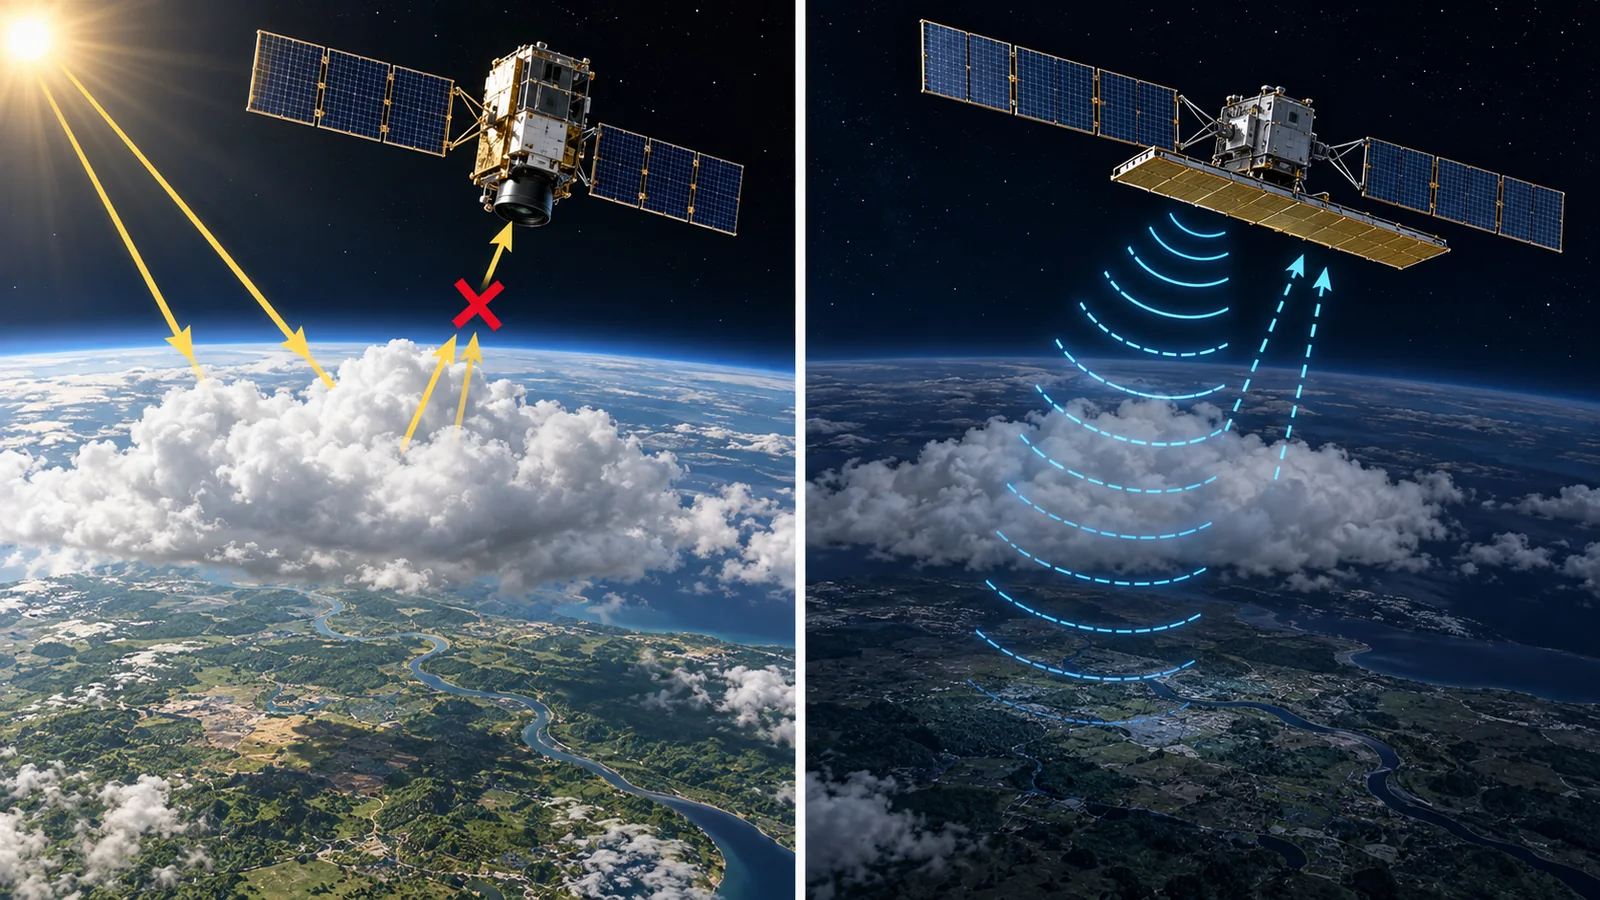
Think of two ways to see things on a dark road: look at light from a street lamp bouncing off objects, or carry your own torch and shine it. The first is optical observation (passive) and the second is SAR (active). ESA describes Sentinel-2's MSI as working passively by collecting reflected sunlight Sourced [ref. 2], whereas Sentinel-1's SAR transmits its own microwaves to light the ground at an angle, receives the echo, and observes day and night regardless of weather Sourced [ref. 1].
SAR radio passes through cloud because its wavelength is far longer than the droplets (ICEYE's explanation) Sourced [ref. 12]. But the image does not show colour as in a photograph; it shows the strength of the radio reflection (backscatter). Synspective also says that SAR data do not resemble a conventional image and are mostly unintelligible to the human eye Sourced [ref. 11]. Terrain relief further causes three distortions: foreshortening, layover and shadow (Chapter 4). ESA explains that backscatter is stronger the rougher or more structured the surface, and that water and dry soil reflect differently Sourced [ref. 1, 14].
3. Optical resolution: pixels and diffraction, with numbers
Two things set the fineness of an optical image. (1) Pixel size: how many metres on the ground one detector cell covers (GSD). ESA defines Sentinel-2's spatial resolution as the ground footprint of an individual detector Sourced [ref. 2]. (2) The optical limit of the telescope: with a small aperture light spreads by diffraction and a point is not imaged as a point.
The Rayleigh criterion is used to estimate the diffraction limit: the smallest distance at which two points can be told apart is 1.22 × wavelength × altitude / aperture Sourced [ref. 18]. Check it with numbers. Sentinel-2's telescope has a pupil equivalent to 150 mm and flies at 786 km; for red light (665 nm) the limit is about 4.3 m. Its pixels are 10 m, so here the pixel size is the limit first SourcedOur calculation [ref. 2].
In high-resolution satellites the situation reverses. In eoPortal's description WorldView-3 has a 110 cm primary mirror, flies at 617 km, and its panchromatic (black-and-white) pixel is 0.31 m at nadir. In our calculation the diffraction limit at 600 nm is about 0.41 m, larger than the 0.31 m pixel. Pleiades (65 cm aperture, 694 km) likewise has a limit of about 0.78 m against a 0.7 m pixel SourcedOur calculation [ref. 8, 9]. So pixels are taken finer than the diffraction limit, and pixel fineness alone does not decide what can be told apart. The actual image depends on the total performance, including detector sampling and sharpening in processing (commentary). The Pleiades material gives a system MTF (a measure of optical transfer) of 0.2 Sourced [ref. 9].
Light spreads when it passes through a narrow opening (diffraction). A telescope's aperture is the opening, and the larger it is the less the spread and the more a point is imaged as a point. In the formula, doubling the aperture halves the limit, and for the same aperture a lower altitude looks finer. That is why high-resolution optical satellites use large primary mirrors and relatively low orbits (our calculation and an organisation of each source's figures) Our calculation.
4. How SAR works: looking sideways
In SAR the satellite looks sideways relative to its flight direction, emits short radio pulses (a "chirp", like a bird call) and records the time and strength of the returns. A longer time before the echo means a greater distance, which gives the slant range. Meanwhile the satellite moves along its track, so it sees the same ground point from slightly different positions many times. Calculation combines these recordings into a fine image as if made with a long antenna. This is the "synthetic aperture". Why sideways? Looking straight down, ground points to the left and right at equal distances return at the same time and cannot be told apart (commentary). ESA describes Sentinel-1 as lighting the ground at an angle Sourced [ref. 1].
The received signal carries both amplitude (strength) and phase (how far the wave is shifted). Phase is sensitive to changes in the distance between satellite and ground, so comparing the phases of two passes measures tiny ground movement (interferometric SAR, InSAR). Sentinel-1 is also phase-preserving Sourced [ref. 1]. Images show a grainy pattern (speckle), because a resolution cell holds many small scatterers whose returns strengthen or weaken each other Sourced [ref. 14]. Averaging several looks (multilooking) reduces the grain at a cost in fineness (commentary). Synspective's "Spotlight Enhanced" mode applies 3-look multilooking in azimuth to reduce noise Sourced [ref. 11].
5. SAR resolution: two formulas checked against numbers
SAR resolution is set by separate formulas in range and along-track (azimuth). The tutorial by Moreira and co-workers explains that slant-range resolution δr is inversely proportional to bandwidth B, δr = c / (2B) (c is the speed of light), while azimuth resolution δa comes from building the synthetic aperture and approaches δa = d / 2 for an antenna of length d Sourced [ref. 13].
The surprising part is that the shorter the antenna, the finer the along-track resolution. The same tutorial explains that a shorter antenna sees a point for a longer time (a longer distance), which amounts to a longer virtual antenna Sourced [ref. 13]. Limit of the explanation: in practice a finer image needs more power and data and a narrower swath.
| Item | Stated value (source) | Ideal formula (our calculation) |
|---|---|---|
| Sentinel-1: bandwidth | 0-100 MHz (programmable). ESA Sourced [ref. 1] | 100 MHz -> 1.5 m in slant range (about 3.0 m on the ground at 30 degrees incidence) Our calculation |
| Sentinel-1: antenna length | 12.3 m × 0.821 m. Stripmap about 5 m × 5 m, IW 5 m × 20 m. ESA Sourced [ref. 1] | 12.3 / 2 = 6.15 m Our calculation |
| StriX: bandwidth | Chirp bandwidth up to 600 MHz. Slant-range resolution 0.23 m (spotlight). Synspective (company's stated values) Sourced [ref. 10, 11] | 600 MHz -> 0.25 m Our calculation |
| StriX: antenna length | 5 m × 0.8 m. Stripmap azimuth resolution 2.6 m (company's stated value, analysis at 30 degrees off-nadir) Sourced [ref. 10, 11] | 5 / 2 = 2.5 m. A real aperture would give about 3.6 km (assuming a 577 km range) Our calculation |
The arrangement of this table is Our calculation (organisation only). That ideal formulas are close to stated values confirms the formulas and does not verify the stated values.
SAR measures slant distance. Projected onto the ground, the range resolution stretches with the slant angle, becoming slant-range resolution / sin(incidence angle); the smaller the incidence angle the coarser it is. In Synspective's stated values a 0.23 m slant-range resolution becomes 0.46 m on the ground (analysis at 30 degrees off-nadir) Sourced [ref. 11]. This matches 0.23 / sin 30° = 0.46 Our calculation.
6. Sorting out the definition of "resolution"
The word "resolution" is used in at least three senses. First, pixel spacing (GSD). Second, the width over which a point's image spreads, the resolution cell; in SAR it is given as the half-width of a point's image and the like, written separately from pixel spacing. Third, the fineness at which two points can be told apart. A different scale for how readable an image is is NIIRS (the National Imagery Interpretability Rating Scale); the civil guide has ten levels, 0 to 9, with a task criterion of what can be identified at each level Sourced [ref. 15].
0.3 m is often an example of pixel spacing (GSD), which does not guarantee that 0.3 m objects can be identified. Whether something can be told apart depends on spread, contrast (difference in brightness or reflection from the surroundings), noise and processing. WorldView-3 is 0.31 m at nadir, but the same source gives 0.34 m when tilted 20 degrees Sourced [ref. 8]. In SAR speckle matters, and at the same resolution readability changes with how images are averaged (Chapter 4). Read a resolution figure together with its definition and conditions (nadir or off-nadir, how many looks).
7. Examples of results, with satellite and conditions
| Satellite or case | What, how large, when | Type |
|---|---|---|
| Landsat 8 (USGS) | Launched on 11 February 2013 at 705 km. OLI gives 30 m in its visible to shortwave-infrared and other bands, 15 m panchromatic, and TIRS thermal infrared 100 m Sourced [ref. 3] | Sourced |
| Sentinel-2 (ESA) | 2A launched in 2015, 2B in 2017 and 2C on 5 September 2024. 786 km, swath 290 km, 13 bands (10, 20, 60 m). With two satellites the equatorial revisit is 5 days Sourced [ref. 2] | Sourced |
| Sentinel-1 (ESA) | C-band SAR. 1A launched on 3 April 2014, 1C on 5 December 2024 and 1D on 4 November 2025. 1B has been unable to deliver radar data since 23 December 2021. 693 km altitude. IW mode: 250 km swath, 5 m × 20 m Sourced [ref. 1] | Sourced |
| ALOS-4 (JAXA) | Launched on 1 July 2024 on the third H3 rocket. About 3,000 kg. L-band PALSAR-3. Swath widened from ALOS-2's 50 km to 200 km (resolution said to be maintained) Sourced [ref. 6] | Sourced |
| NISAR (NASA and ISRO) | Launched on 30 July 2025. SAR at L-band (24 cm wavelength) and S-band (9.4 cm). As of the check date it is in its science phase; L-band provisional data were released on 20 July 2026 and ISRO releases the S-band data Sourced [ref. 4]. Coverage every 12 days, a swath over 240 km and a 12 m deployable reflector (NASA report before launch) Sourced [ref. 5] | Sourced |
| Planet Dove | 3U CubeSat, 525 km, 3 m. Near-daily imaging of all land in 2017 (company description) Sourced [ref. 7] | Sourced |
| WorldView-3 | Launched on 13 August 2014 at 617 km. Primary mirror 110 cm, panchromatic 0.31 m at nadir, swath 13.1 km. Company information (compiled by eoPortal) Sourced [ref. 8] | Sourced |
| Synspective StriX | X-band (9.65 GHz), 100 kg class, a foldable 5 m antenna. The first satellite was placed in orbit in 2020. Stripmap 2.6 m, as fine as 0.25 m in spotlight (company's stated and analysed values) Sourced [ref. 10, 11] | Sourced |
| ICEYE | X-band (about 9.6 GHz). Resolution as fine as 25 cm and scenes up to 120,000 km² (company's stated values) Sourced [ref. 12] | Sourced |
The arrangement of this table is Our calculation (organisation only). Company figures are company statements; third-party verification was not found.
8. Antenna and telescope structures and materials: a materials engineer's view
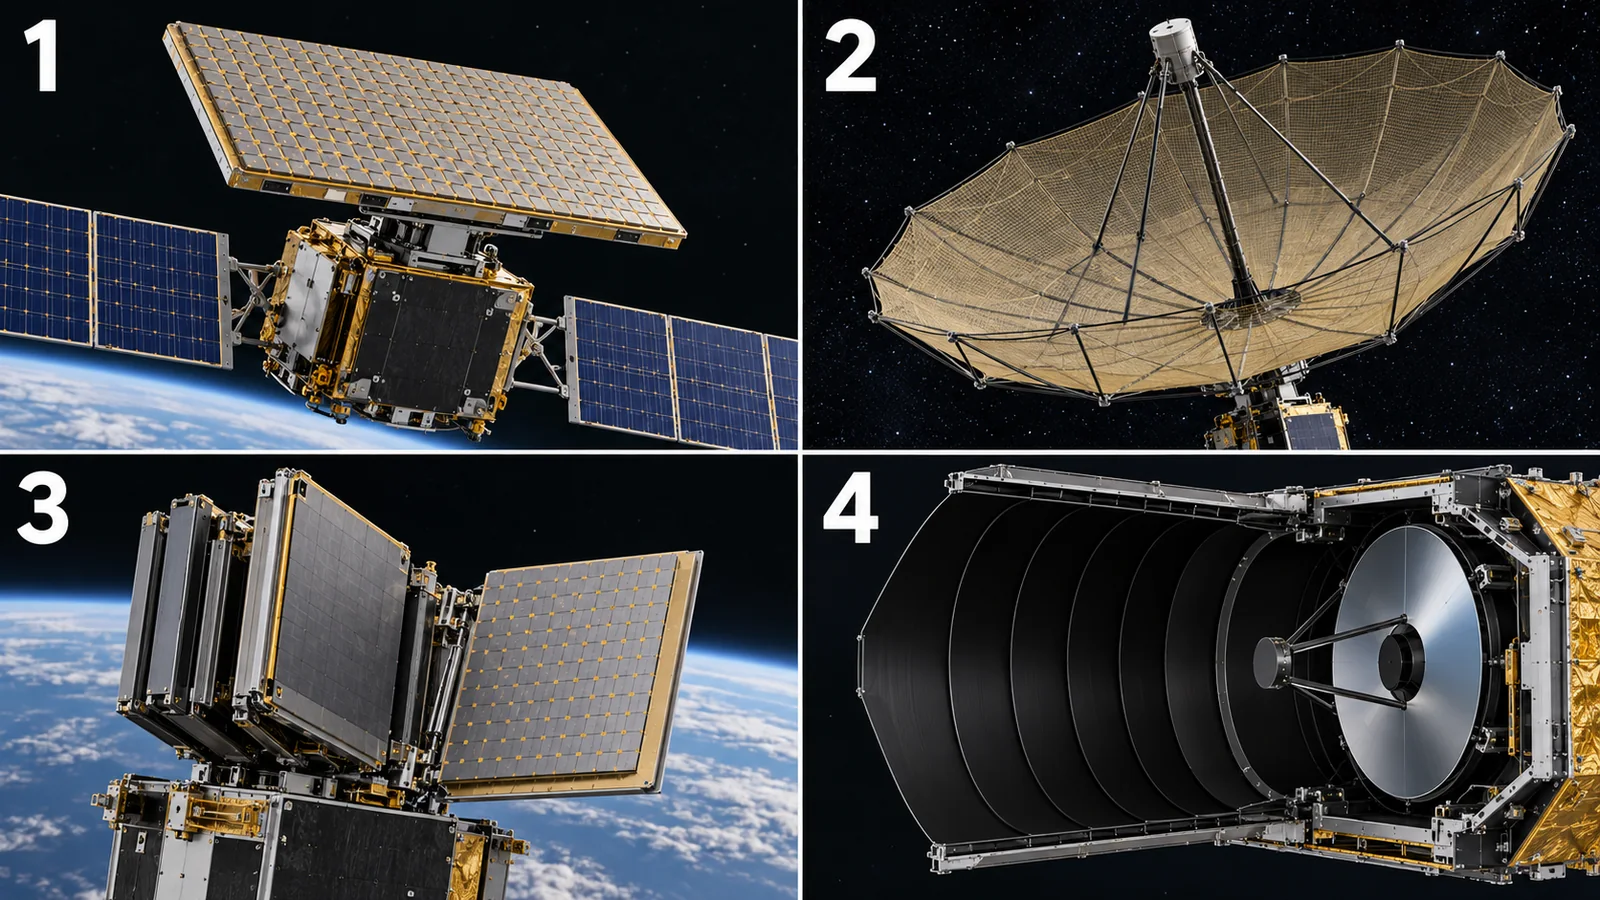
View original SVG, values and sources
Original SVG reference: Conceptual diagram (vector drawing). Top: three SAR antenna types; bottom: optical telescope descriptions. Materials are limited to what each source states.
A SAR antenna is several to a dozen or more metres across, and its surface must be precisely flat to keep the radio phase aligned. For Sentinel-1, ESA says the radiating waveguides use metallised carbon-fibre-reinforced plastic (CFRP), which ensures good radiometric stability Sourced [ref. 1]. Putting a conductive metal layer on light CFRP that resists thermal deformation lets one part serve as both structure and waveguide. NISAR uses a 12 m deployable reflector and boom, and StriX seven folding panels, so each is stowed small at launch and deployed in orbit. The accuracy of the deployed shape and its stability under repeated thermal cycling are materials challenges (commentary). This article gives no figures for deployment mechanisms or reflector-surface materials, because none could be confirmed in primary sources.
The mirrors and structure of a telescope must keep their shape as temperature changes. ESA says Sentinel-2's telescope is isostatically mounted to minimise thermo-elastic distortion Sourced [ref. 2]. The Pleiades material says the structure uses carbon material with very low thermal expansion and density; for the mirrors the same source mentions both Zerodur (a low-expansion glass-ceramic) and SiC (silicon carbide), so this article could not settle it Sourced [ref. 9]. The thermal expansion, stiffness and lightness of the mirror material, and how the mirror is mounted decide image blur. The closer a design gets to the diffraction limit of Chapter 3, the more shape errors of tens of nanometres matter (commentary).
Sentinel-2 uses CMOS (silicon) for visible to near-infrared and MCT (mercury cadmium telluride) for shortwave infrared. ESA says the MCT detector is cooled passively to below 195 K (about -78 °C) Sourced [ref. 2]. Receiving longer wavelengths needs a narrower-bandgap material and cooling to reduce thermal noise (see our photodetector explainer). The size of the radiator used for cooling and the thermal path of the materials shape the satellite design. USGS writes that Landsat 8's TIRS uses a new technology based on quantum physics to detect thermal infrared Sourced [ref. 3].
This article could not confirm from primary sources (1) figures for the materials and dimensional accuracy of SAR deployment mechanisms and reflector surfaces (mesh and so on), (2) the mirror material of optical satellites (the Pleiades source is split), (3) measured in-service resolution of each satellite, (4) NISAR's post-launch resolution results, or (5) third-party verification of company-stated resolutions.
9. How to read the yardsticks and standards
No single resolution number measures remote sensing. Read a combination of (1) both pixel spacing and spread, (2) accuracy of colour or reflectance measurement (radiometric calibration), (3) whether it overlays a map correctly (positional accuracy) and (4) what the image can be used to identify (NIIRS and so on). The standards centre on how data are handled rather than on building instruments.
| What is assessed | Typical test or method (name, source) | Standards and guidance | Reading notes |
|---|---|---|---|
| Pixel spacing (GSD) | Ground footprint of one detector (ESA's definition). WorldView-3: 0.31 m at nadir, 0.34 m at 20 degrees off-nadir Sourced | Each mission's material (Sentinel-2 description, eoPortal) [ref. 2, 8] Sourced | Pixel spacing is not the fineness that can be told apart. Check nadir or off-nadir |
| Optical transfer (MTF) | System MTF value. Pleiades gives 0.2 (whole system) Sourced | Not found (no standard fixing how to measure MTF was checked) [ref. 9] | Check at which spatial frequency an MTF value applies |
| SAR resolution | Range and azimuth resolution (slant or ground), swath and noise-equivalent backscatter (NESZ). Synspective states them per observing mode Sourced | Not found (no standard number defining SAR resolution was checked). Formulas are in Moreira et al.'s tutorial [ref. 13, 11] | Check "analysed" versus "measured" values, the viewing angle and the number of looks |
| Image interpretability | NIIRS: ten levels, 0 to 9, each with a criterion of tasks that can be done Sourced | Civil NIIRS Reference Guide (IRARS Committee) [ref. 15] Sourced | A scale tied to the image's use; it is not fixed automatically by a satellite's resolution figure |
| Data handling (analysis-ready data) | Minimum metadata, radiometric and geometric correction requirements. For SAR: normalised radar backscatter (NRB), polarimetric (POL), ocean backscatter (ORB), geocoded complex data (GSLC), interferometric (INSAR) and composite backscatter (CB) Sourced | CEOS-ARD product family specifications: Surface Reflectance v5.0.2 (28 May 2026), Surface Temperature v5.0.1, Aquatic Reflectance v2.0.1, Nighttime Lights v1.0.1, combined SAR v1.3.1 (11 July 2026) [ref. 16] Sourced | CEOS-ARD sets "minimum requirements" and not a measure of image quality. The texts were not checked |
| Testing of materials and antennas | Thermal-vacuum and deployment tests (per satellite) | Not found (no standard for satellite antennas or mirrors was checked here) | Ground tests and in-orbit records differ. For thermal vacuum see our explainer on spacecraft thermal control |
| Plans and targets | Company plans (e.g. iQPS states an aim of 24 satellites by May 2028, per its official page at the check date) Not yet confirmed [ref. 17] | Not found (no standard) | Plans are not achievements |
The arrangement of this table is Our calculation (organisation only). CEOS specification names, versions and dates were checked on the CEOS page (17 October 2026). The texts of specifications and guidance were not checked.
Reading notes for materials engineers
- Read resolution figures with their definition and conditions: the same "0.3 m" means different things depending on pixel spacing, resolution cell, viewing angle and number of looks.
- Company statements differ from public-agency values: Synspective, ICEYE and Planet figures are company statements, while Sentinel and Landsat come from public agencies. They cannot be ranked on one scale.
- Ground tests are not in-orbit records: ideal formulas are theory and "analysed values" are design estimates. The performance of real images is confirmed by calibration in orbit.
- Check whether a standard is advice or a requirement, and which version: CEOS-ARD sets minimum requirements and its versions are updated often.
10. Glossary
- Remote sensing
- Studying something from a distance with electromagnetic waves.
- Optical observation
- Imaging by receiving reflected sunlight (passive).
- SAR (synthetic aperture radar)
- An active radar that uses the satellite's motion to make a virtual long antenna.
- GSD (ground sample distance)
- How many metres on the ground a pixel covers.
- Aperture
- The effective diameter of a telescope's mirror or lens.
- Diffraction
- The spreading of light at an aperture edge, which sets the limit of fineness.
- Rayleigh criterion
- A guide to the smallest separation at which two points can be told apart: 1.22 × wavelength / aperture (as an angle).
- MTF (modulation transfer function)
- A measure of optical performance of how well fine patterns are preserved in the image.
- Panchromatic (PAN)
- A black-and-white image taken over a wide visible band.
- Multispectral
- Imaging separately in several wavelength bands.
- Push-broom
- A scheme in which a line of detectors sweeps the ground as the satellite moves.
- Swath
- The width covered in one pass.
- Slant range
- The straight-line distance from the satellite to a ground point.
- Azimuth
- The satellite's direction of flight.
- Chirp
- A radio pulse whose frequency changes with time, the source of the bandwidth.
- Bandwidth
- The width of frequencies a pulse occupies; wider gives finer range resolution.
- Backscatter
- The reflection of radio returning from the ground toward the satellite.
- Speckle
- The grainy pattern in SAR images, caused by interference of reflections.
- Multilooking
- Averaging several looks to reduce speckle.
- Interferometric SAR (InSAR)
- A method of measuring ground motion or height from the phase difference between two passes.
- C-, X- and L-band
- Frequency bands of SAR radio, with wavelengths of about 5.5, 3 and 24 cm.
- NIIRS
- A 0-9 scale of what can be identified in an image.
- CEOS-ARD
- Specifications of minimum requirements for satellite data processed to be ready for analysis.
- MCT (HgCdTe)
- A mercury cadmium telluride compound used as an infrared detector material.
11. References
- ESA (Copernicus SentiWiki) "S1 Mission" (Sentinel-1 description; checked 17 October 2026) — sentiwiki.copernicus.eu/web/s1-mission
- ESA (Copernicus SentiWiki) "S2 Mission" (Sentinel-2 description; checked 17 October 2026) — sentiwiki.copernicus.eu/web/s2-mission
- USGS "Landsat 8" (mission page) — usgs.gov/landsat-missions/landsat-8
- NASA "NISAR (NASA-ISRO Synthetic Aperture Radar)" (mission page; checked 17 October 2026) — science.nasa.gov/mission/nisar/
- NASA (Technical Reports Server) "NASA-ISRO SAR (NISAR) Mission Status" (NTRS 20220004522; 2021) — ntrs.nasa.gov/citations/20220004522
- JAXA "About ALOS-4" (ALOS-4 page) — eorc.jaxa.jp/ALOS/en/alos-4/a4_about_e.htm
- Planet Labs "PlanetScope" (Planet documentation; company material) — docs.planet.com/data/imagery/planetscope/
- eoPortal (ESA) "WorldView-3" (satellite and sensor description compiled from company information) — eoportal.org/satellite-missions/worldview-3
- eoPortal (ESA) "Pleiades" (satellite and sensor description compiled from CNES and Airbus information) — eoportal.org/satellite-missions/pleiades
- Synspective Inc. "StriX" (satellite specification; company's stated values; checked 17 October 2026) — synspective.com/satellite/satellite-strix/
- Synspective Inc. "StriX Data" (observation-mode specifications; company's stated and analysed values; checked 17 October 2026) — synspective.com/data/synspective-sar-data/
- ICEYE "SAR data" (company page; the 25 cm resolution and similar are the company's stated values; checked 17 October 2026) — iceye.com/sar-data
- Moreira A. et al. "A tutorial on synthetic aperture radar", IEEE Geosci. Remote Sens. Mag. 1(1), 6-43 (2013), DOI 10.1109/MGRS.2013.2248301 — elib.dlr.de/82313/1/SAR-Tutorial-March-2013.pdf
- Alaska Satellite Facility (NASA DAAC) "Introduction to SAR" (guide; foreshortening, layover, shadow, speckle) — hyp3-docs.asf.alaska.edu/guides/introduction_to_sar/
- IRARS Committee (hosted by FAS) "Civil NIIRS Reference Guide" (scale of image interpretability; ten levels, 0 to 9) — irp.fas.org/imint/niirs_c/guide.htm
- CEOS "CEOS Analysis Ready Data" (list of product family specifications; checked 17 October 2026) — ceos.org/ard/
- iQPS Inc. "iQPS" (company page; description of its constellation plan; checked 17 October 2026) — i-qps.net/en/
- Born M., Wolf E. "Principles of Optics", 7th ed., Cambridge University Press (1999) (textbook on diffraction and the Rayleigh criterion), DOI 10.1017/CBO9781139644181 — doi.org/10.1017/CBO9781139644181
12. Claim-to-source audit
| Claim in the text | Basis | Type |
|---|---|---|
| Sentinel-1: C-band 5.405 GHz, bandwidth 0-100 MHz, antenna 12.3 m × 0.821 m, metallised CFRP waveguides, 693 km, mass about 2,300 kg (instrument 945 kg), IW 250 km and 5 m × 20 m, SM about 5 m × 5 m, 1A 2014-04-03, 1B no data since 2021-12-23, 1C 2024-12-05, 1D 2025-11-04, phase-preserving, oblique illumination | ESA SentiWiki Reference 1 https://sentiwiki.copernicus.eu/web/s1-mission | Sourced |
| Sentinel-2: passive MSI, 13 bands (10, 20, 60 m), swath 290 km, 786 km, three mirrors with a 150 mm pupil equivalent and isostatic mounting, CMOS and MCT (passively cooled below 195 K), 2A 2015, 2B 2017, 2C 2024-09-05, definition of spatial resolution as one detector's ground footprint | ESA SentiWiki Reference 2 https://sentiwiki.copernicus.eu/web/s2-mission | Sourced |
| Landsat 8: 2013-02-11, 705 km, OLI 30 m and panchromatic 15 m, TIRS 100 m, a new thermal-infrared detection technology based on quantum physics | USGS page Reference 3 https://www.usgs.gov/landsat-missions/landsat-8 | Sourced |
| NISAR: launched 2025-07-30, L-band 24 cm and S-band 9.4 cm, science phase, L-band provisional data released 2026-07-20, S-band by ISRO, 12 days, swath over 240 km, 12 m deployable reflector | NASA page and technical report (NTRS) Reference 4 https://science.nasa.gov/mission/nisar/ Reference 5 https://ntrs.nasa.gov/citations/20220004522 | Sourced |
| ALOS-4: 2024-07-01 on the third H3, about 3,000 kg, L-band PALSAR-3, 200 km swath (ALOS-2 had 50 km) | JAXA page Reference 6 https://www.eorc.jaxa.jp/ALOS/en/alos-4/a4_about_e.htm | Sourced |
| Planet Dove: 3U, 525 km, 3 m, near-daily land imaging in 2017 (company description) | Planet documentation Reference 7 https://docs.planet.com/data/imagery/planetscope/ | Sourced |
| WorldView-3: 2014-08-13, 617 km, 110 cm primary mirror, panchromatic 0.31 m (nadir) and 0.34 m (20 degrees), swath 13.1 km. Pleiades: 65 cm aperture, 694 km, 0.7 m, MTF 0.2, carbon structure and mirror-material statements (Zerodur and SiC) | eoPortal (ESA) satellite descriptions Reference 8 https://www.eoportal.org/satellite-missions/worldview-3 Reference 9 https://www.eoportal.org/satellite-missions/pleiades | Sourced |
| StriX: X-band 9.65 GHz, 100 kg class, 5 m × 0.8 m folding panels (seven), bandwidth up to 600 MHz, 1 kW, stripmap 2.6 m (azimuth), sliding spotlight 0.9 m and 0.5 m, staring as fine as 0.25 m, speckle-reducing Spotlight Enhanced, first satellite in 2020 (company's stated and analysed values) | Synspective pages Reference 10 https://synspective.com/satellite/satellite-strix/ Reference 11 https://synspective.com/data/synspective-sar-data/ | Sourced |
| ICEYE: X-band about 9.6 GHz, resolution as fine as 25 cm, up to 120,000 km², wavelength longer than cloud droplets (company statements) | ICEYE page Reference 12 https://www.iceye.com/sar-data | Sourced |
| Range resolution c/2B, azimuth resolution d/2, why a shorter antenna is finer, a real-aperture example | Moreira et al. tutorial paper Reference 13 https://elib.dlr.de/82313/1/SAR-Tutorial-March-2013.pdf | Sourced |
| Speckle and the foreshortening, layover and shadow distortions | ASF guide Reference 14 https://hyp3-docs.asf.alaska.edu/guides/introduction_to_sar/ | Sourced |
| Rayleigh criterion (1.22 × wavelength × altitude / aperture) | Optics textbook (Born and Wolf) Reference 18 https://doi.org/10.1017/CBO9781139644181 | Sourced |
| Civil NIIRS: ten levels 0-9 with task criteria | IRARS Committee guide Reference 15 https://irp.fas.org/imint/niirs_c/guide.htm | Sourced |
| Names, versions and dates of CEOS-ARD product family specifications | CEOS page Reference 16 https://ceos.org/ard/ | Sourced |
| Diffraction limits (Sentinel-2 about 4.3 m, Pleiades about 0.78 m, WorldView-3 about 0.41 m), ideal-formula range resolution (1.5 m and 0.25 m), azimuth (6.15 m and 2.5 m), real aperture about 3.6 km (assuming 577 km range), ground-range resolution 0.23/sin 30° = 0.46 m, and the chart curves | Our calculation (Python, with the assumptions above such as 600 nm and 665 nm) | Our calculation |
| Figures for SAR antenna deployment mechanisms and reflector materials and accuracy, a firm Pleiades mirror material, measured in-service resolution, NISAR's post-launch resolution, third-party verification of company-stated resolutions | Not confirmed within the scope of this article's survey, so not stated (commentary) | Explanation |
| The readings and explanations "resolution is not one number", "pixels can be taken finer than the diffraction limit", "a shorter antenna is finer in SAR", "a metal layer on CFRP serves as structure and waveguide" and "an optical telescope must not move with temperature" | This article's own organisation of the published material | Explanation |
Last updated 17 October 2026. Sources are limited to primary material (official material of ESA, USGS, NASA, JAXA, CEOS and IRARS, papers, company pages and ESA's eoPortal). Company figures are treated as company statements and nothing is ranked. The numerical examples are explanatory calculations, not design values of real satellites. SAR antenna deployment mechanisms and reflector materials, the Pleiades mirror material and measured in-service resolution could not be confirmed and are not stated. The figures are conceptual diagrams or drawings including our calculations; Figs. 1 and 9 are AI-image frames (images not yet placed).