TECHNOLOGY EXPLAINER
Thermal Interface Materials (TIM)
— What Slows Heat Down Is the Contact, Not the Material
Heat from a chip leaves through a chain: chip → TIM1 → heat spreader → TIM2 → heat sink. A TIM (thermal interface material) is the family of materials that goes into the joints of that chain. Catalogues put thermal conductivity (W/m·K) front and centre, but the thermal resistance you actually get is also set by thickness and by how poor the contact is. This article walks through the heat path, the addition of thermal resistances, seven forms of TIM, the axes for choosing one, and the test standards, from a materials engineer's point of view.
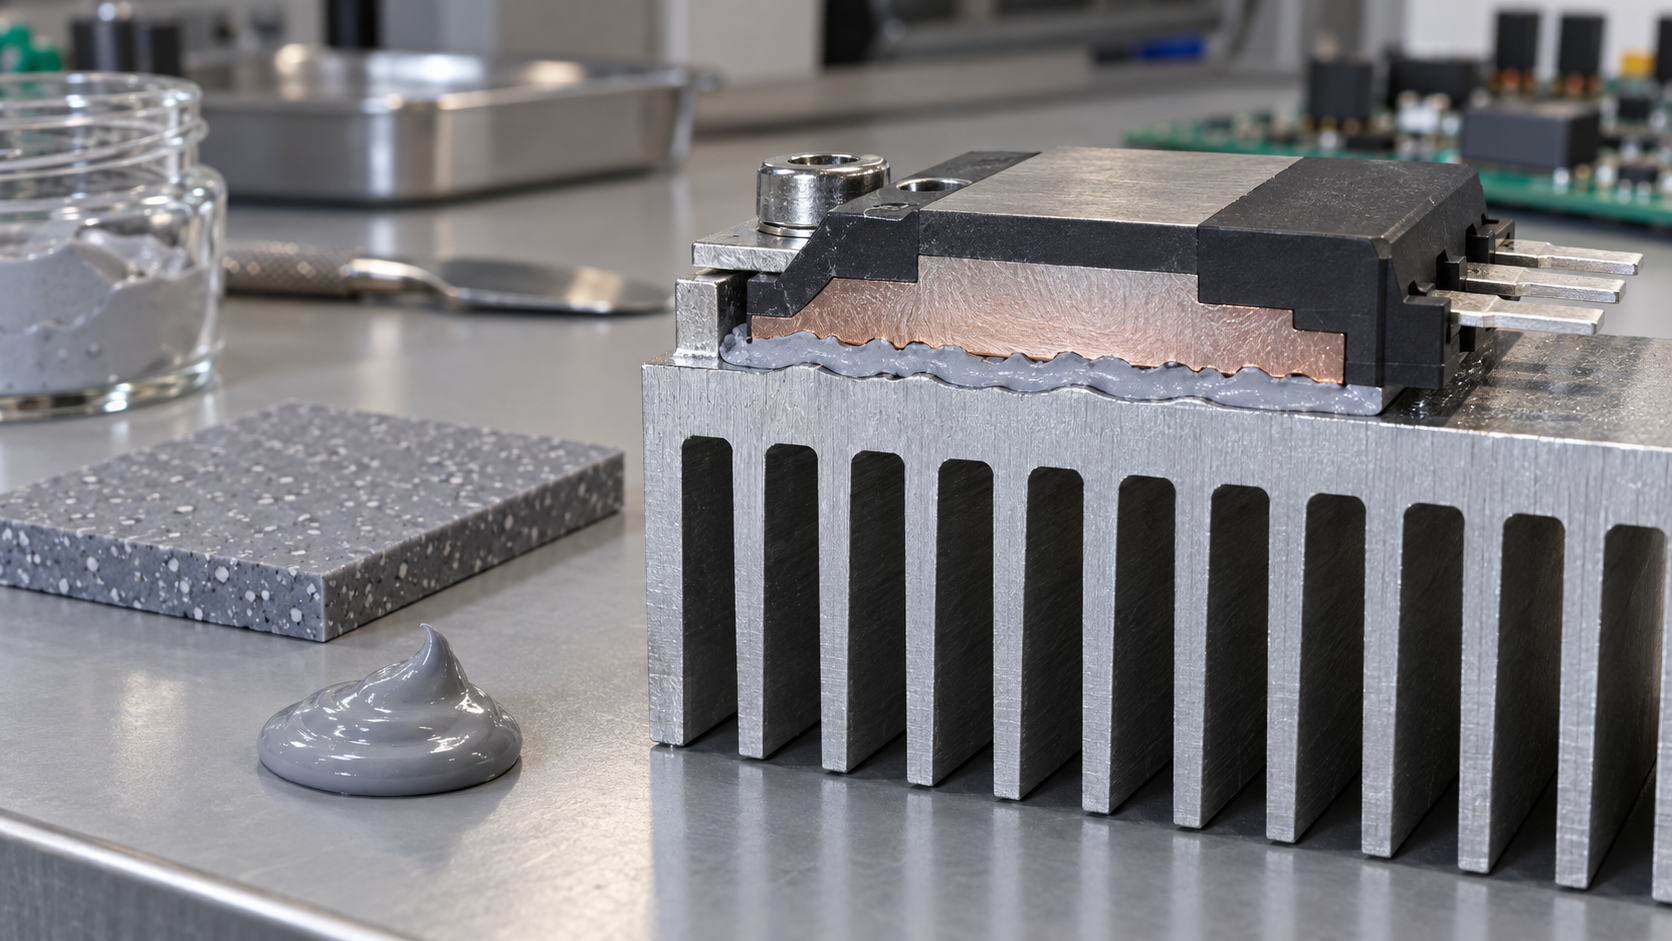
- What a TIM is, in three points
- The heat path: from chip to heat sink
- Why it is needed: two surfaces touch only at points
- Adding up thermal resistance: Rth = L/k + Rc1 + Rc2
- Our calculation: what happens if you raise thermal conductivity tenfold
- A materials engineer's view (1): conductivity is a property of the material; resistance belongs to the assembled joint
- Types of TIM: seven forms
- A materials engineer's view (2): a composite that is more than 90% filler
- Four axes for choosing: resistance, thickness, compressibility, reliability
- Evaluation: ASTM D5470 and its limits
- A materials engineer's view (3): what fails under thermal cycling
- Open problems, and what this article could not confirm
- Glossary / References / Claim-to-source audit
Sourced = stated in published material from manufacturers or standards bodies (link given)
Our calculation = a value this article derived from assumptions it states
Not yet confirmed = a plan or target with no confirmed track record
Structural readings and materials-design interpretations are marked separately as Commentary.
Catalogue values are labelled manufacturer's stated value. Values with different grades or test conditions are not lined up to rank products.
1. What a TIM is, in three points
A TIM (thermal interface material) is a material placed in the gap between a heat-generating part and a heat-removing part so that heat passes more easily. It comes in many forms: grease, sheets, liquids that cure in place, metal foil.
- Purpose: a DuPont technical paper states that overheating is the number one cause of electronic component failure, and that TIMs are used to move heat away and improve reliabilitySourced
- Where it sits: the same paper divides TIMs into TIM1 and TIM2. TIM1 creates the conduction path from the heat-generating chip to its metal lid; TIM2 creates the path from the outside of the semiconductor package to a heat sink (or heat pipe, or other spreader)Sourced
- What to look at: not thermal conductivity k alone, but total thermal resistance Rth. DuPont says total thermal impedance is a better predictor of thermal performance than the thermal conductivity of the TIM material by itselfSourced
A TIM is, before it is a “heat-conducting material”, an “air-displacing material”. A Laird presentation shows that two solid faces actually touch over less than 10% of the area, with heat passing through the contact points, and gives the thermal conductivity of air as 0.02 W/m·K against 0.5 to 10 W/m·K for TIMsSourced. Replacing the air in the gap with something that conducts far better is the core job of a TIM.
This article is the big picture of TIMs. Detail by type is covered in other articles in the series: paste-type and liquid gap fillers in our explainer on high-thermal-conductivity pastes and gap fillers, sheet-type thermal pads in our explainer on thermal pads, and the heat sink itself in our explainer on heat sinks. Here we concentrate on the shared way of thinking, and the yardsticks for choosing and evaluating.
2. The heat path: from chip to heat sink
In a semiconductor package such as a processor, heat from the chip (die) passes through several layers of material in turn before it leaves. Indium Corporation names the joints TIM1 (die to lid), TIM1.5 (die directly to heat spreader or heat sink) and TIM2 (lid to heat spreader or heat sink)Sourced.
DuPont also notes that the demands on TIM1 and TIM2 differSourced.
| Item | TIM1 | TIM2 |
|---|---|---|
| Location | Between the chip (die) and the metal lid, inside the package | Between the outside of the package and a heat sink or similar |
| Temperature guide for reliability testing | Must withstand thermal cycling from −40°C to 150°C | Upper limit is typically about 120°C |
| Material tendency | Mostly silicone-based. Stays gel-like after cure with a low elastic modulus, so warpage stress is not passed on to the chip | Deforms under compression to fill gaps: gap fillers, gap pads, tapes, phase change materials, greases and so on |
| How pressure is applied | Large pressure is avoided because it could damage the die | Compressed by clamping. About 20 to 40 psi is given as typical for the most advantageous performance |
All Sourced (DuPont technical paper [Ref. 1]). Since 1 psi is about 6.9 kPa, 20 to 40 psi is about 0.14 to 0.28 MPaOur calculation.
3. Why it is needed: two surfaces touch only at points
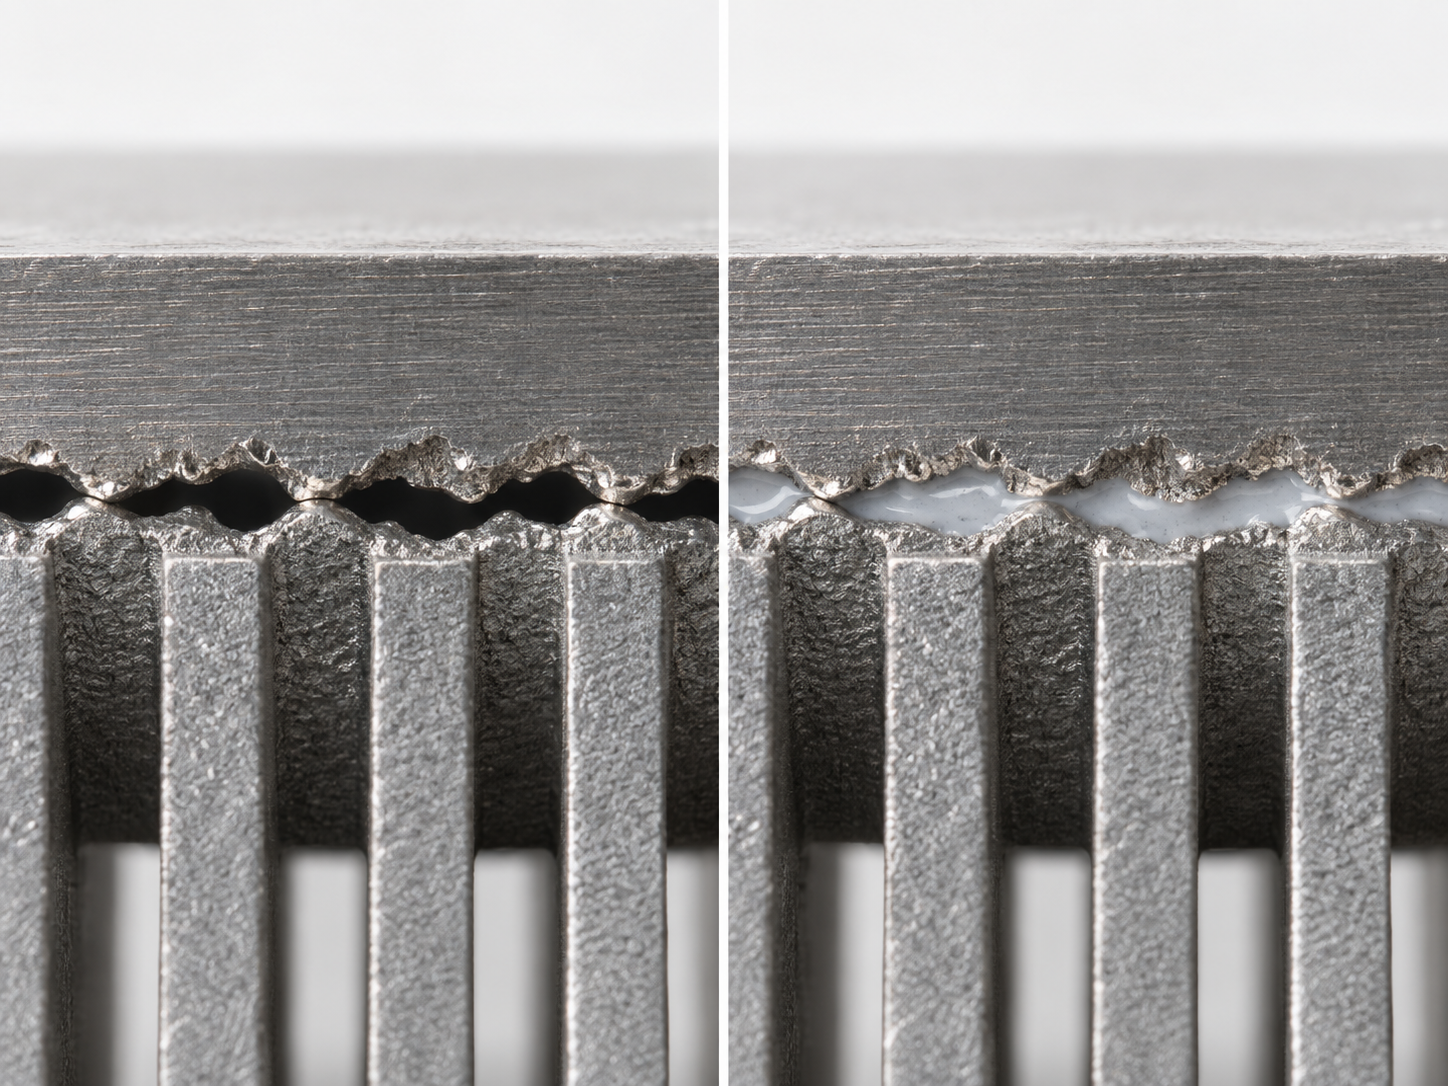
Metal faces that look flat to the eye have peaks and valleys under a microscope. The DuPont paper explains that the valleys trap air, which acts like insulation and raises thermal resistanceSourced. The Laird presentation goes further and shows contact area below 10%, with heat passing through the contact pointsSourced.
View the original SVG schematic and source notes
4. Adding up thermal resistance: Rth = L/k + Rc1 + Rc2
The DuPont paper gives the total thermal resistance (impedance) of a TIM assembly as followsSourced.
Rth = R(TIM) + Rc1 + Rc2 (the equation in the DuPont paper)
R(TIM) is the thermal resistance of the TIM itself (the bulk); Rc1 and Rc2 are the contact thermal resistances between the TIM and the two surfaces it touches.
The Laird presentation writes the bulk part in terms of thickness L and thermal conductivity k, giving Rth = L/k + Rc1 + Rc2. It then organises the task into just three levers for lowering total resistance: raise k, reduce L, reduce RcSourced.
From this equation comes a conclusion that DuPont points out and that is easy to find surprising: a material with high thermal conductivity can still end up with a higher total resistance than one with lower conductivity, if it conforms poorly to the surfaces and so has a large contact resistanceSourced. The Laird presentation says the same of measured gap fillers: the TIMs with the lowest Rth are not necessarily those with the highest kSourced.
Watch the units: W/m·K, cm²·K/W and K/W
- Thermal conductivity k (W/m·K): a property of the material, independent of thickness and area.
- Thermal resistance Rth (K/W): how hard it is for heat to pass through that part, at that size, under those conditions. It falls as the area gets larger.
- Area-specific thermal resistance (cm²·K/W, K·mm²/W and so on): the form multiplied by area that TIM catalogues and standards use. The K/W in the DuPont paper versus the cm²·°C/W and °C·in²/W in the Indium and Laird documents is this difference.
5. Our calculation: what happens if you raise thermal conductivity tenfold
Let us check the equation with numbers. The Laird presentation draws its graph for gap fillers on the assumptions of thickness L = 0.75 mm (30 mil) and contact resistance Rc = 0.15 °C·in²/WSourced. We borrowed those assumptions as they are and changed only the thermal conductivity k, to 1, 3, 6 and 10 W/m·K, then calculated total thermal resistanceOur calculation.
Assumptions: L = 0.75 mm = 0.075 cm. Rc (sum of the contact resistances) = 0.15 °C·in²/W = 0.15 × 6.4516 = about 0.97 K·cm²/W. Only the k of the TIM is varied.
Equation: Rth = L/k + Rc (k converted to W/cm·K; 1 W/m·K = 0.01 W/cm·K). Example: for k = 3 W/m·K, L/k = 0.075 ÷ 0.03 = 2.5 K·cm²/W, so Rth = 2.5 + 0.97 = 3.47 K·cm²/W.
| Thermal conductivity k | Bulk term L/k | Contact term Rc | Total thermal resistance Rth | Share of Rth that is contact |
|---|---|---|---|---|
| 1 W/m·K | 7.50 K·cm²/W | 0.97 | 8.47 | about 11% |
| 3 W/m·K | 2.50 K·cm²/W | 0.97 | 3.47 | about 28% |
| 6 W/m·K | 1.25 K·cm²/W | 0.97 | 2.22 | about 44% |
| 10 W/m·K | 0.75 K·cm²/W | 0.97 | 1.72 | about 56% |
All Our calculation. The 0.75 mm thickness and Rc = 0.15 °C·in²/W are the assumptions of the graph in the Laird presentation [Ref. 2]. They are not values of any real product.
6. A materials engineer's view (1): conductivity is a property of the material; resistance belongs to the assembled joint
Thermal conductivity k is a property of the material. Thermal resistance, though, is set by the assembled state. The same material gives different Rc and L depending on clamping pressure, surface roughness and how it was applied.
As the calculation above shows, the higher k goes, the larger the share of contact in total thermal resistance (about 11% at k = 1, about 56% at k = 10)Our calculation. So raising conductivity gets less effective beyond a certain point. What helps next is reducing thickness and reducing Rc.
Indium Corporation's document on metal TIMs says that metals have high thermal conductivity, yet names as keys to selection not only thermal conductivity but also long-term reliability, compressibility, interfacial resistance and operating temperatureSourced. The same document lists, for pure indium (thermal conductivity 86 W/m·K), a thermal resistance at 100 psi of 0.0514 cm²·°C/W at 0.004 inSourced.
Let us work out the bulk part. 0.004 in = 0.01016 cm and 86 W/m·K = 0.86 W/cm·K, so L/k = 0.01016 ÷ 0.86 = about 0.012 cm²·K/W. The difference from the stated 0.0514 is about 0.040, so the calculation says about 77% of the total is not bulk (mainly contact)Our calculation. Even for a metal, most of the thermal resistance sits not “inside the material” but “at the boundary” (this estimate reads the specimen thickness as 0.004 in, as the table is written; if compression made it thinner, the contact share would be larger still).
TIM development is therefore a two-track job: raise k, and make the material conform to the surface (wetting and softness). The DuPont paper likewise explains that the filler particles in TIM1 are surface-treated to improve wetting and thermal conduction with the resinSourced (our commentary).
7. Types of TIM: seven forms
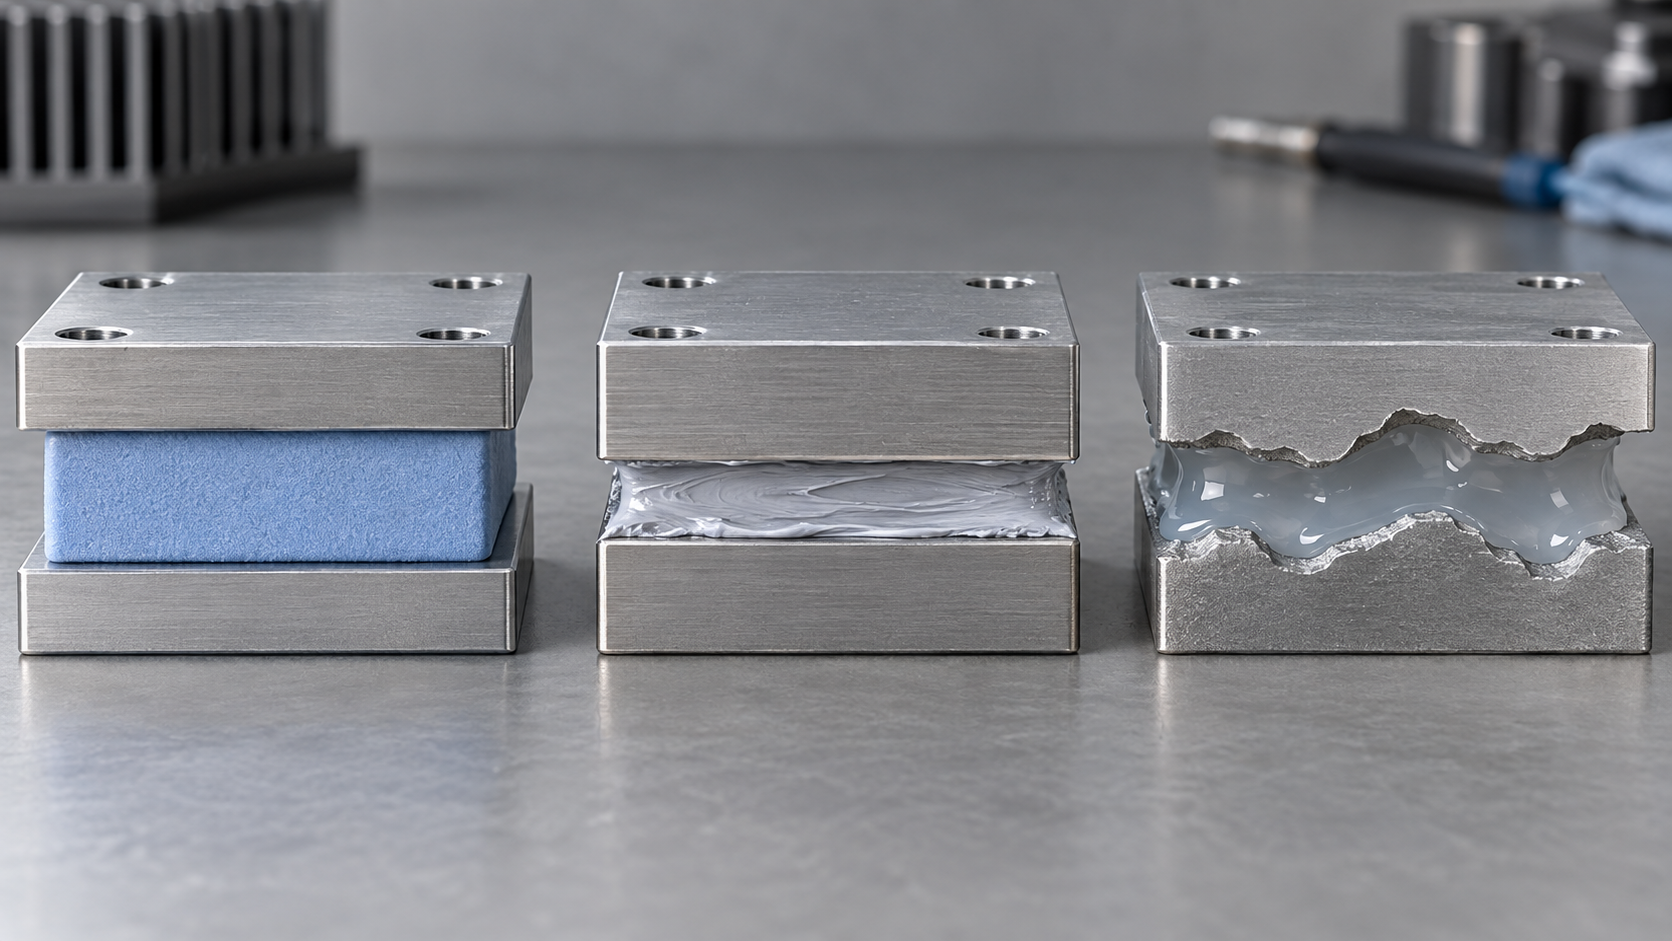
TIMs are easiest to sort by the form in which they go into the gap. The table below lines up the form, thickness and thermal conductivity ranges written in each company's documents. Because test conditions, grades and publication dates differ between documents, the sizes of the numbers cannot be used to rank products or companies.
| Type | Form and how it is applied | What the documents say | Numbers (manufacturer's stated values or as stated in the document) |
|---|---|---|---|
| 1. Grease and paste | Liquid to paste. Applied by dispensing or printing in a thin layer | Low contact resistance and a thin bond line (typically 50 µm or less). Assumes relatively flat surfaces and constant pressure. Resistance to pump-out is listed as a desirable property (Laird) | Thermal conductivity 0.5 to 7 W/m·K (Laird's general statement for greases and phase change materials) |
| 2. Gap filler (liquid, cure-in-place) | Dispensed, for example as a two-part mix, and cured in place into a low-modulus elastomer | Wets surfaces in its liquid state, so no stress is put on parts during assembly. High freedom of shape, and easy to automate with a dispenser (Henkel). Gaps of 0.25 to 5 mm and deflection of 10 to 70% (Laird) | Henkel GAP FILLER TGF 1000 / 1500 / 3600: thermal conductivity 1.0 / 1.8 / 3.6 W/m·K, density 1.6 / 2.7 / 3.0 g/cm³ (catalogue of January 2019). Laird describes 0.5 to 10 W/m·K |
| 3. Thermal pad (gap pad) | Soft sheet. Peel off the release film and place it | Absorbs height differences between parts and bonds a board thermally to an enclosure or large heat sink; low modulus also absorbs shock and vibration (Henkel) | Henkel GAP PAD TGP 1000VOUS / 1500R / HC3000: thermal conductivity 1.0 / 1.5 / 3.0 W/m·K, thickness 0.25 to 6.4 mm (same catalogue). Details are in our thermal pad explainer |
| 4. Phase change material (PCM) | Solid at room temperature; softens or melts at operating temperature and wets the surface | Wets and forms a thin bond line near operating temperature (Laird). A metallic phase change alloy melts at 60°C (Indium) | Thermal conductivity 0.5 to 7 W/m·K (Laird's general statement, same range as grease) |
| 5. Tape and thermally conductive adhesive | Double-sided adhesive thermally conductive sheet, or a liquid adhesive | Removes the need for fasteners such as clamps and screws (Henkel). A construction with adhesive coated on both sides of a glass-fibre-reinforced sheet | Henkel BOND PLY TBP 850: 0.8 W/m·K, thickness 0.13 to 0.28 mm. LIQUI BOND TLB SA1800: 1.8 W/m·K (same catalogue) |
| 6. Metal (indium foil, liquid metal and so on) | Metal foil, solder, or gallium-based liquid metal | Metals have higher thermal conductivity than non-metals. Keys to selection: thermal conductivity, long-term reliability, compressibility, interfacial resistance, operating temperature (Indium). Liquid metals are electrically conductive and must be contained to prevent leakage (Indium) | Indium 99.99In: 86 W/m·K; 52In/48Sn: 40 W/m·K (company document). Liquid metals have melting points of 7.6 to 17°C (company page) |
| 7. Graphite sheet | Sheet of graphite. Thin and flexible | Thermal conductivity differs between in-plane and through-thickness directions (anisotropy). Electrically conductive (Laird) | Panasonic PGS: the product page lists 700 to 1950 W/m·K. The page does not distinguish direction, as far as we could confirm |
All Sourced (Laird [Ref. 2], the Henkel Japan catalogue [Ref. 5], Indium Corporation [Refs. 3 and 4], Panasonic [Ref. 9]). The Henkel values are manufacturer's stated values (typical) from the catalogue; the test method and conditions could not be confirmed in the catalogue. The catalogue is dated January 2019.
8. A materials engineer's view (2): a composite that is more than 90% filler
Most TIMs are composites: a resin such as silicone (or an oil) packed with a heat-conducting powder (filler). The Laird presentation names boron nitride (BN), zinc oxide (ZnO) and alumina as fillers, and says that filler loadings above 90 weight percent are not unusualSourced. It also says that multiple fillers, polymers and additives are combined and designed for “packing and deflection”Sourced.
Ninety percent by mass sounds like almost all powder. What about by volume? If we assume an alumina density of about 3.9 g/cm³ and a silicone density of about 1.0 g/cm³, 90 mass% alumina is about 69 volume%Our calculation ((0.90÷3.9) ÷ ((0.90÷3.9) + (0.10÷1.0)) = 0.23 ÷ 0.33). Close to seven-tenths of the volume is particles, and the resin is better seen as what fills the spaces between them. These densities are our assumptions, not values of a specific product.
The trend shows up in catalogue densities too. For Henkel's three liquid gap fillers, as thermal conductivity rises 1.0 → 1.8 → 3.6 W/m·K, density rises 1.6 → 2.7 → 3.0 g/cm³Sourced (manufacturer's stated values, January 2019 catalogue). It reads as raising the amount of heavy inorganic filler to buy thermal conductivity (our commentary).
And this is where the design dilemma lies. More filler means higher viscosity and modulus, so the material is harder to dispense and harder to squeeze down. If it cannot be squeezed down, the bond line thickness (BLT) stays thick, and Rc is harder to reduce. The Laird presentation lists “low modulus (low stress)”, “resistant to pump-out” and “low bleeding” next to “low total thermal resistance” among the properties wanted of a TIM, because these are conditions that pull against one another (our commentary).
According to the DuPont paper, silicone dominates TIM1 because it must endure up to 150°C. It says some epoxies, for example, can harden and delaminate at 150°C and fail thermallySourced.
9. Four axes for choosing: resistance, thickness, compressibility, reliability
Choosing a TIM is not a hunt for “the highest thermal conductivity”. Organising the conditions that appear in the documents gives four axes (this article's arrangement).
| Axis | What to look at | Clues in the documents |
|---|---|---|
| 1. Thermal resistance | Total Rth at the real thickness and pressure (including the contact term), not catalogue k | DuPont: total thermal impedance is the better indicator of thermal performance. Laird: the lowest Rth is not necessarily the highest k. Indium: thermal resistance includes the contact interfaces and so better represents real heat dissipation |
| 2. Thickness (gap) | Can it absorb height differences, tolerances and warpage between parts? The thicker it is, the larger L/k | Laird: grease and phase change at a bond line of 50 µm or less; gap fillers for gaps of 0.25 to 5 mm. As Fig. 5 shows, the types roughly divide up the territory |
| 3. Compressibility | At what pressure does it get how thin, and what force lands on the parts and board? | DuPont: TIM1 avoids high pressure because of the stress on the die; about 20 to 40 psi is typical for TIM2. Laird: hardness (durometer) is not a substitute for deflection (compression); it is only an indentation test |
| 4. Reliability | Thermal cycling, pump-out, delamination, outgassing, bleed, electrical insulation, flame retardancy, ease of rework | DuPont: thermal cycling and surface adhesion are the challenges for long-term reliability. Laird: low outgassing, low bleed, high volume resistivity and easy rework are listed as desirable. Indium: Heat-Spring is described as free of the pump-out and bake-out seen with greases |
All Sourced (DuPont [Ref. 1], Laird [Ref. 2], Indium Corporation [Ref. 3]). The sorting into four axes is this article's own.
The four axes pull against each other. A grease that spreads thin and has low contact resistance cannot be used where the gap is wide. A pad that absorbs thickness needs compression force, and its bond line is hard to make thin. Metals have high thermal conductivity but come with electrical conductivity, questions of wetting (whether the joint is soldered), and limits on which packages they suit. The optimum changes with the application, so this article does not rank them.
10. Evaluation: ASTM D5470 and its limits
A representative standard for measuring TIM thermal performance is ASTM D5470 (Standard Test Method for Thermal Transmission Properties of Thermally Conductive Electrical Insulation Materials). On the ASTM store page the current version is shown as D5470-17 (reapproved 2024: D5470-17R24)Sourced. The full text is paid, so here we summarise the scope and significance statements published on the page.
- What it measures: the thermal impedance of thermally conductive electrical insulation materials, and from it an apparent thermal conductivity. It covers materials from liquid compounds to hard solidsSourced
- Why “apparent”: “thermal conductivity” strictly applies to homogeneous materials, and TIMs are usually heterogeneous (resin plus powder), so to avoid confusion the standard says “apparent thermal conductivity”Sourced
- Specimen types: viscous liquids such as greases, pastes and phase change materials (Type I), viscoelastic solids such as gels and soft rubbers (Type II), and elastic solids such as ceramics and metals (Type III)Sourced
- Separating contact resistance: if you measure the thermal impedance of specimens of different thicknesses and plot it against thickness, the inverse of the slope is the apparent thermal conductivity, and the intercept at zero thickness is the sum of the contact resistances at the two surfacesSourced
- Caution on use: the method assumes an idealised uniform heat flow, and the standard itself says the measured thermal impedances cannot be applied directly to many practical situations where those conditions do not holdSourced
Other test methods, and evaluation in the real device
- ISO 22007-2:2022 (Plastics — Determination of thermal conductivity and thermal diffusivity — Part 2: Transient plane heat source (hot disc) method) is a standard for finding the thermal conductivity and thermal diffusivity of plastics by the hot disc method; it gives guidelines for homogeneous and isotropic materials and for anisotropic materials with a uniaxial structureSourced [Ref. 7].
- The Laird presentation lists ASTM D5470 (for thick materials), ISO 22007-2 (hot disc) and laser flash as ways to measure thermal conductivity, and cautions that D5470 “cannot measure anisotropy” and is difficult for thin, high-performance materials such as greases and phase change materials. For an accurate evaluation it says to combine it with a thermal test vehicle (TTV) and tests in the real applicationSourced.
- JEDEC JESD51-14 (Transient Dual Interface Test Method for the Measurement of the Thermal Resistance Junction-to-Case of Semiconductor Devices with Heat Flow Through a Single Path; published November 2010) is a standard for finding the junction-to-case thermal resistance RθJC of a semiconductor device with a transient dual-interface methodSourced [Ref. 8]. It is not a standard for TIMs themselves, but the relationship with the TIM comes up when measuring the package-side thermal resistance (our commentary).
- Which test method? (D5470, hot disc, laser flash; the value can change with the method)
- Under what conditions? (specimen thickness, pressure, temperature)
- The value of what? (bulk thermal conductivity, or thermal impedance including contact)
In the Henkel Japan catalogue we read [Ref. 5], the test method for thermal conductivity could not be confirmed. When you use a value, check the test method and conditions in the latest datasheet.
11. A materials engineer's view (3): what fails under thermal cycling
A low thermal resistance when new is of no use if it rises in service. The DuPont paper says that thermal cycling and surface adhesion are the main challenges for the long-term reliability of TIMsSourced.
- Warpage and CTE mismatch: a large difference in CTE (coefficient of thermal expansion) between the chip and the metal lid produces warpage on heating. DuPont calls this a major cause of reliability problems and explains that the low modulus of cured gel-like TIM1 keeps warpage stress from reaching the chipSourced. The basics of CTE are covered in our explainer on the coefficient of thermal expansion.
- Embrittlement and delamination: if a TIM hardens or turns brittle through thermal cycling, it can delaminate from the surface and fail thermally. DuPont says raw materials and fillers must be chosen to avoid thisSourced.
- Pump-out and bake-out: Indium lists, among the features of the Heat-Spring (a compressible metal TIM), the absence of “pump-out or bake-out, as with thermal greases”Sourced. Laird likewise lists resistance to pump-out as a property wanted of greases and phase change materials. In other words, these are treated as real forms of degradation in grease-type TIMs (our commentary).
- Indium's thermal cycling test: the company's document includes a graph comparing how thermal resistance changes over 1,000 power cycles under clamping for a Heat-Spring, a polymeric phase change TIM and a thermal grease. We could not read numerical values from the document we accessed, so we do not report the result.
The life of a TIM, then, is decided by whether the softness of the resin, the interface with the filler, and adhesion to the surface are kept through thermal cycling. The interface discussion is shared with the interface discussion in our explainer on polymer blends and fillers (our commentary).
12. Open problems, and what this article could not confirm
(1) The ranking of types by thermal resistance cannot be compared from these documents
The Henkel values are typical values from a January 2019 catalogue, the Indium values come from the company's own test graph, and Laird's are general statements from a 2014 conference presentation, so neither test conditions nor dates are aligned. We did not build a table comparing “which type gives what thermal resistance”.
(2) The latest product datasheets are not confirmed
Henkel's English-language site could not be displayed when this article was written, so we could not confirm the latest English datasheets or product pages. The Japanese catalogue is the January 2019 edition.
(3) The through-thickness thermal conductivity of graphite sheet could not be confirmed
Panasonic's product page lists 700 to 1950 W/m·K, but it does not distinguish the direction (in-plane or through-thickness) on that page, as far as we could confirm. The Laird presentation states that there is anisotropy. When used as a TIM, the through-thickness value and the contact made under pressure are what matter (our commentary).
(4) Long-term reliability of liquid metals and compatibility with aluminium could not be confirmed
Indium's page says liquid metals are electrically conductive and must be contained to prevent leakage. Compatibility with the metals they touch and long-term behaviour could not be confirmed in the primary sources we read, so we do not cover them.
(5) Market size and similar figures are not covered
The DuPont paper quotes a market research firm's estimates, but this article does not use them.
- A TIM is the material that goes into the joints of the chip's heat path. TIM1 sits between the die and the lid; TIM2 sits between the package exterior and the heat sinkSourced
- Two surfaces touch only at points, and the valleys hold air. A TIM replaces that airSourced
- Rth = L/k + Rc1 + Rc2. Raising k from 1 to 10 cuts Rth to only about one-fifth under our assumptionsOur calculation
- The seven forms (grease, gap filler, pad, phase change, tape, metal, graphite) roughly divide up the range of thickness
- Many TIMs are composites with more than 90% filler by massSourced. Viscosity, modulus and thermal conductivity pull against each other
- There are four axes for choosing: thermal resistance, thickness, compressibility and reliability. Catalogue k alone does not decide it
- ASTM D5470 measures at several thicknesses and separates k and contact resistance by slope and intercept. But the standard itself says the results cannot be applied directly to a real deviceSourced
13. Glossary
- TIM
- Thermal interface material. A material placed in the gap between a heat-generating part and a heat-removing part to help heat pass.
- TIM1
- The TIM between the chip (die) and its metal lid (heat spreader), inside the package.
- TIM2
- The TIM between the outside of the package and a heat sink or similar.
- TIM1.5
- A TIM joining the die directly to a heat spreader or heat sink without a lid (Indium Corporation's naming).
- Thermal conductivity k
- A property showing how well a material conducts heat. Unit: W/m·K.
- Thermal resistance Rth
- How hard it is for heat to pass through a part. Unit: K/W (cm²·K/W and so on when per unit area).
- Contact thermal resistance Rc
- The thermal resistance arising at the boundary between the TIM and the surface it touches. Large when wetting is poor.
- BLT
- Bond line thickness. The thickness of the TIM once the joint is assembled.
- Filler
- The powder mixed into a resin. In TIMs, heat-conducting inorganic particles (alumina, boron nitride, zinc oxide and so on).
- Pump-out
- The squeezing of grease-type TIM out of the joint, for example by repeated temperature changes.
- Phase change material (PCM)
- A TIM that is solid at room temperature and softens or melts at operating temperature to wet the surface.
- Gap filler / thermal pad
- TIMs that fill a gap: one dispensed as a liquid and cured, and one supplied as a sheet.
- ASTM D5470
- A standard for measuring the thermal impedance and apparent thermal conductivity of thermally conductive electrical insulation materials.
- Apparent thermal conductivity
- Thermal conductivity worked out from the thermal impedance and thickness of a heterogeneous material.
- CTE
- Coefficient of thermal expansion. The fractional growth in size per 1°C of temperature rise.
- Anisotropy
- Properties that differ with direction. Graphite sheet conducts heat differently in-plane and through its thickness.
14. References (primary sources)
- DuPont (Claire K. Wemp, Ph.D.) "Advanced Polymer Formulations for Thermal Management of Electronic Devices" (technical paper, PDF) https://www.dupont.com/content/dam/dupont/amer/us/en/articles/corporate/Advanced%20Polymer%20Formulations%20for%20Thermal%20Management%20of%20Electronic%20Devices_r1_66.pdf
- Laird (J. Strader et al.) "Thermal Interface Materials (TIMs) and Challenges Faced by TIM Suppliers", Thermal & Fluids Analysis Workshop (TFAWS) 2014, NASA Glenn Research Center (presentation, PDF) https://s3vi.ndc.nasa.gov/ssri-kb/static/resources/TFAWS-2014-PT-06.pdf
- Indium Corporation "Thermal Interface Materials" (brochure 99342 (A4) R4, PDF) https://www.indium.com/wp-content/uploads/2025/08/TIMs-Brochure-99342-A4-R4.pdf
- Indium Corporation "Liquid Metal and Liquid Metal Paste" (product page) https://www.indium.com/products/thermal-interface-materials/liquid-metal/
- Henkel Japan "Thermal Interface Materials for Heat Dissipation: Thermal Solutions" (BERGQUIST product catalogue in Japanese, as of January 2019, PDF) https://dm.henkel-dam.com/is/content/henkel/brochure-bergquist-thermal-interface-materials-jp
- ASTM International D5470-17R24 "Standard Test Method for Thermal Transmission Properties of Thermally Conductive Electrical Insulation Materials" (store page) https://store.astm.org/d5470-17r24.html
- ISO ISO 22007-2:2022 "Plastics — Determination of thermal conductivity and thermal diffusivity — Part 2: Transient plane heat source (hot disc) method" https://www.iso.org/standard/81836.html
- JEDEC JESD51-14 "Transient Dual Interface Test Method for the Measurement of the Thermal Resistance Junction-to-Case of Semiconductor Devices with Heat Flow Through a Single Path" (November 2010) https://www.jedec.org/standards-documents/docs/jesd51-14-0
- Panasonic Industry "PGS Graphite Sheet" (product page) https://na.industrial.panasonic.com/products/thermal-management/thermal-management/lineup/thermal-management-products/series/70458
15. Claim-to-source audit
| Claim in the text | Basis | Category |
|---|---|---|
| That TIMs divide into TIM1 and TIM2; TIM1 runs from the chip to the metal lid and TIM2 from the outside of the semiconductor package to a heat sink (or heat pipe and so on); that overheating is named the number one cause of electronic component failure; that TIM1 reliability testing runs to 150°C (thermal cycling from -40°C to 150°C) and TIM2 to about 120°C | DuPont technical paper Reference 1 https://www.dupont.com/content/dam/dupont/amer/us/en/articles/corporate/Advanced%20Polymer%20Formulations%20for%20Thermal%20Management%20of%20Electronic%20Devices_r1_66.pdf | Sourced |
| The TIM1 / TIM1.5 / TIM2 naming (TIM1 die to lid, TIM1.5 die to heat spreader or heat sink, TIM2 lid to heat spreader or heat sink); that the keys to selecting a metal TIM are thermal conductivity, long-term reliability, compressibility, interfacial resistance and operating temperature; that thermal resistance (the original says resistivity) includes the contact interfaces and so better represents real heat dissipation | Indium Corporation brochure Reference 3 https://www.indium.com/wp-content/uploads/2025/08/TIMs-Brochure-99342-A4-R4.pdf | Sourced |
| That most TIM1 materials are silicone-based, stay gel-like with a low modulus after cure and so pass little warpage stress to the chip, and have filler surfaces treated to improve wetting and thermal conduction; that some epoxies can harden and delaminate at 150°C; that about 20 to 40 psi is typical for the most advantageous TIM2 compression; that total thermal impedance is a better predictor than the thermal conductivity of the material alone; Rth = R(TIM) + Rc1 + Rc2; that a high-conductivity material with large contact resistance can have a higher total resistance; that thermal cycling and surface adhesion are the challenges for long-term reliability; that valleys in surface roughness trap air and raise thermal resistance | DuPont technical paper Reference 1 https://www.dupont.com/content/dam/dupont/amer/us/en/articles/corporate/Advanced%20Polymer%20Formulations%20for%20Thermal%20Management%20of%20Electronic%20Devices_r1_66.pdf | Sourced |
| That the contact area is below 10% and heat passes through the contact points; air at 0.02 W/m·K against TIM at 0.5 to 10 W/m·K; Rth = L/k + Rc1 + Rc2 (to lower total resistance, raise k, lower L, or lower Rc); the graph drawn on assumptions of Rc = 0.15 °C·in²/W and L = 0.75 mm; that the TIMs with the lowest Rth are not necessarily those with the highest k | Laird presentation (TFAWS 2014) Reference 2 https://s3vi.ndc.nasa.gov/ssri-kb/static/resources/TFAWS-2014-PT-06.pdf | Sourced |
| Gap fillers at gaps of 0.25 to 5 mm, 0.5 to 10 W/m·K and 10 to 70% deflection, with BN, ZnO and alumina as fillers; greases and phase change materials at a bond line of 50 µm or less and 0.5 to 7 W/m·K, with resistance to pump-out among desirable properties; that filler loadings above 90 weight percent are not unusual; that multiple fillers, polymers and additives are combined and designed for packing and deflection; the desirable properties (low total thermal resistance, low outgassing and bleed, high volume resistivity, easy rework, low modulus) | Laird presentation Reference 2 https://s3vi.ndc.nasa.gov/ssri-kb/static/resources/TFAWS-2014-PT-06.pdf | Sourced |
| That ASTM D5470, ISO 22007-2 (hot disc) and laser flash are listed as ways to measure thermal conductivity; that D5470 cannot measure anisotropy and is difficult for thin, high-performance materials; that a thermal test vehicle (TTV) and real-application tests must be combined with it; that hardness (durometer) is not deflection (compression); the anisotropy and electrical conductivity of graphite sheet | Laird presentation Reference 2 https://s3vi.ndc.nasa.gov/ssri-kb/static/resources/TFAWS-2014-PT-06.pdf | Sourced |
| That metals have higher thermal conductivity than non-metals; 99.99In at 86 W/m·K, 52In/48Sn at 40 W/m·K, and a phase change metal alloy that melts at 60°C; the Heat-Spring thickness (0.004 to 0.006 inch) and the absence of pump-out and bake-out; the 0.0514 cm²·°C/W thermal resistance of 99.99In (100 psi, 0.004 inch); that the document has a graph comparing thermal resistance over 1,000 power cycles | Indium Corporation brochure Reference 3 https://www.indium.com/wp-content/uploads/2025/08/TIMs-Brochure-99342-A4-R4.pdf | Sourced |
| That liquid metals are mainly gallium-based, have melting points of 7.6 to 17°C, are electrically conductive and must be contained to prevent leakage | Indium Corporation product page Reference 4 https://www.indium.com/products/thermal-interface-materials/liquid-metal/ | Sourced |
| The form, features and values of Henkel BERGQUIST products (SIL PAD, GAP PAD, GAP FILLER, BOND PLY, LIQUI BOND); the thermal conductivity of 1.0 / 1.8 / 3.6 W/m·K and density of 1.6 / 2.7 / 3.0 g/cm³ for GAP FILLER TGF 1000 / 1500 / 3600; the 1.0 / 1.5 / 3.0 W/m·K of GAP PAD TGP 1000VOUS / 1500R / HC3000; BOND PLY TBP 850 at 0.8 W/m·K and 0.13 to 0.28 mm, and LIQUI BOND TLB SA1800 at 1.8 W/m·K; that the catalogue is as of January 2019 | Henkel Japan catalogue (in Japanese) Reference 5 https://dm.henkel-dam.com/is/content/henkel/brochure-bergquist-thermal-interface-materials-jp | Sourced |
| That ASTM D5470 is a method for measuring thermal impedance and apparent thermal conductivity; the Type I to III classes; that measuring at several thicknesses makes the inverse of the slope the apparent thermal conductivity and the intercept the sum of the contact resistances; that it assumes an idealised heat flow and cannot be applied directly to many practical situations; that the current version is D5470-17R24 (Active) | ASTM International store page Reference 6 https://store.astm.org/d5470-17r24.html | Sourced |
| The title of ISO 22007-2:2022 (Edition 3); that it finds the thermal conductivity and thermal diffusivity of plastics by the hot disc method; that it includes guidelines for homogeneous and isotropic materials and for anisotropic materials with a uniaxial structure | ISO official page Reference 7 https://www.iso.org/standard/81836.html | Sourced |
| That JEDEC JESD51-14 (November 2010) finds the junction-to-case thermal resistance RθJC of a semiconductor device with a transient dual-interface method | JEDEC official page Reference 8 https://www.jedec.org/standards-documents/docs/jesd51-14-0 | Sourced |
| That Panasonic's PGS product page lists thermal conductivity of 700 to 1950 W/m·K (the page does not distinguish direction, as far as we could confirm) | Panasonic product page Reference 9 https://na.industrial.panasonic.com/products/thermal-management/thermal-management/lineup/thermal-management-products/series/70458 | Sourced |
| The L/k values (7.50, 2.50, 1.25, 0.75 K·cm²/W), total thermal resistances (8.47, 3.47, 2.22, 1.72) and contact shares (about 11%, 28%, 44%, 56%) at k = 1, 3, 6 and 10 W/m·K; that raising k tenfold cuts Rth to about 1/5; that 20 to 40 psi is about 0.14 to 0.28 MPa | Our calculation. The assumptions (L = 0.75 mm, Rc = 0.15 °C·in²/W = about 0.97 K·cm²/W) are those of the graph in the Laird presentation. 1 in² = 6.4516 cm² and 1 psi = 6.895 kPa are unit conversions | Our calculation |
| That the L/k of 99.99In is about 0.012 cm²·K/W and that the difference from the stated 0.0514 is about 0.040 (about 77%) | Our calculation. Uses 0.004 inch = 0.01016 cm and 86 W/m·K = 0.86 W/cm·K, and assumes the thickness is as the table is written. If compression made it thinner, the contact share would be larger still | Our calculation |
| That 90 mass% alumina is about 69 volume% | Our calculation. We assumed an alumina density of about 3.9 g/cm³ and a silicone density of about 1.0 g/cm³; these are not values of a specific product | Our calculation |
| That the rising density of Henkel's three GAP FILLER grades with rising thermal conductivity reads as more heavy inorganic filler; the reading that more filler raises viscosity and modulus and makes the material harder to squeeze down; the limit to raising conductivity and the two-track view of raising k and improving wetting and softness; the sorting into four axes; the reading that pump-out and similar effects are treated as real degradation in grease-type TIMs; the view that TIM life is decided by keeping resin softness, filler interface and adhesion | This article's own framing and commentary based on published content. Not views expressed by the companies or institutions | Commentary |
| That we did not build a comparison table of thermal resistance by type; that we could not confirm the latest English datasheets; the through-thickness thermal conductivity of graphite sheet, the long-term reliability of liquid metals and compatibility with aluminium, and the numerical values of Indium's thermal cycling graph | Not covered, because this article could not confirm them. Henkel's English-language site could not be displayed when this article was written, and the values in Indium's graph could not be read from the document we accessed | Commentary |
| That Figs. 1, 2, 5 and 6 are explanatory drawings; that Fig. 3 is a drawing that includes our calculation; and that the hero image and Fig. 4 are AI-generated images | A note by this article | Commentary |
Last updated 3 October 2026. Sources are limited to primary material (manufacturers' technical papers, catalogues and product pages; standards bodies' pages; a conference presentation). Because the article includes structural readings and materials-design interpretations, those are marked as Commentary and kept separate from sourced fact. The latest English datasheets, the through-thickness thermal conductivity of graphite sheet, the long-term reliability of liquid metals, and a comparison of thermal resistance by type are not covered, because they could not be confirmed in primary sources. All figures are for explanation. Figs. 1, 2, 5 and 6 are vector drawings, Fig. 3 is a drawing that includes our calculation, and the hero image and Fig. 4 are AI-generated images; none of them shows an actual cross-section photograph, measurement result or real product.