TECHNOLOGY EXPLAINER
Training Data and Scaling Laws
— how big, and how much to read: data quality, data exhaustion and compute
Empirical work has shown that the performance of a large language model follows, fairly smoothly, how big the model is, how much data it reads and how much compute is used. These relationships are called scaling laws. But they are fits under particular conditions, and cannot be read without the quality and duplication of the data, the amount of public data available, and the load that compute places on energy and facilities. This article sets out, from primary sources, what training data contain and how they are prepared, the ideas behind Kaplan-style and Chinchilla-style scaling laws and how they have since been tested, the chain that turns compute (FLOPs) into an energy estimate, and the debates on data exhaustion and synthetic data. Figures carry checking dates, and published values are kept apart from estimates.
- What training data and scaling laws are (the short version)
- What training data contain and how they are prepared — corpora, de-duplication, quality selection
- Data quality and memorisation — what duplication causes
- Scaling laws — Kaplan-style, Chinchilla-style and later checks
- Compute and energy — from FLOPs to GPU hours to electricity
- Data exhaustion, consent and synthetic data
- Limits, and what could not be confirmed / Summary
- How to read evaluations and standards
- Glossary
- References
- Claim-to-source audit
Sourced = stated in published material (link given)
Our calculation = a figure this article derived, with the assumptions spelled out
Not yet confirmed = an outlook, an estimate, a revision in progress or anything else not yet settled
Readings for materials research are marked separately as Commentary. Inference is shown in bold. Model names, scales and dates are as stated in official material on 15 October 2026.
The exponents and constants of scaling laws are empirical formulae fitted to particular groups of models, data and ranges, not laws of nature. Values differ between studies, and extrapolation beyond the fitted range is not guaranteed. An improvement in loss (cross-entropy) is not the same as an improvement in task accuracy. For energy, we keep published values, our own estimates and third-party estimates apart. Figures that define power differently (TDP, system average, whole facility) are not set side by side.
1. What training data and scaling laws are (the short version)
- Performance can be predicted within a range: the loss of a language model falls smoothly, as a power law, with the number of parameters, the amount of data and the amount of compute. Kaplan et al. reported trends that in some cases hold across more than seven orders of magnitude Sourced [Ref. 12].
- Scale the model and the data together: Hoffmann et al. reported that, for a given compute budget, loss is minimised by increasing model size and the number of training tokens by the same factor (Chinchilla). The optimum shifts, though, once inference cost and the limited supply of public data are taken into account Sourced [Ref. 13, 25, 26].
- Compute converts to energy: training compute is roughly 6 × parameters × tokens (FLOPs), and multiplying GPU hours by power gives an electricity estimate. For Llama 3 405B the published values were 3.8×1025 FLOPs and 30.84M GPU hours Sourced [Ref. 14, 15].
A scaling law is a tool for prediction, not a guarantee. Even between the Kaplan and Chinchilla studies, the exponent for how model size should grow with compute differs, 0.73 against 0.50, and the main cause of the gap is reported to be that Kaplan counted parameters excluding embeddings and analysed small scales Sourced [Ref. 13, 24]. The definition and the range of a fit change the conclusion.
2. What training data contain and how they are prepared — corpora, de-duplication, quality selection
Pre-training data are text collected from the web, books, papers, code, encyclopaedias and so on. The table below sets out the main public corpora and the description of Llama 3's data.
| Corpus / model | Scale and content (as stated) | Source |
|---|---|---|
| C4 (T5) | Hundreds of gigabytes of clean English text scraped from the web: the "Colossal Clean Crawled Corpus" | [3] |
| The Pile (2020) | 825 GiB of English text, built from 22 high-quality subsets, many of academic or professional origin | [4] |
| Dolma (2024) | An open corpus of three trillion tokens. About 200 TB of raw text before curation, about 11 TB after. Six sources including Common Crawl, papers from Semantic Scholar and code from GitHub. Tokens counted with the LLaMA tokenizer | [5] |
| FineWeb (2024) | 15 trillion tokens made from 96 Common Crawl snapshots. A small effective set chosen from more than 50 candidate filters. FineWeb-Edu, restricted to educational text, is 1.3 trillion tokens | [8] |
| Llama 3 (2024) | About 15 trillion (15.6 trillion for the flagship) multilingual tokens, with knowledge up to the end of 2023. Mix of roughly 50% general knowledge, 25% mathematics and reasoning, 17% code and 8% multilingual. The data are not public | [14] |
All Sourced (the papers and technical reports). Token counts depend on the tokenizer, so corpora and models cannot be strictly compared by them (this article's commentary).
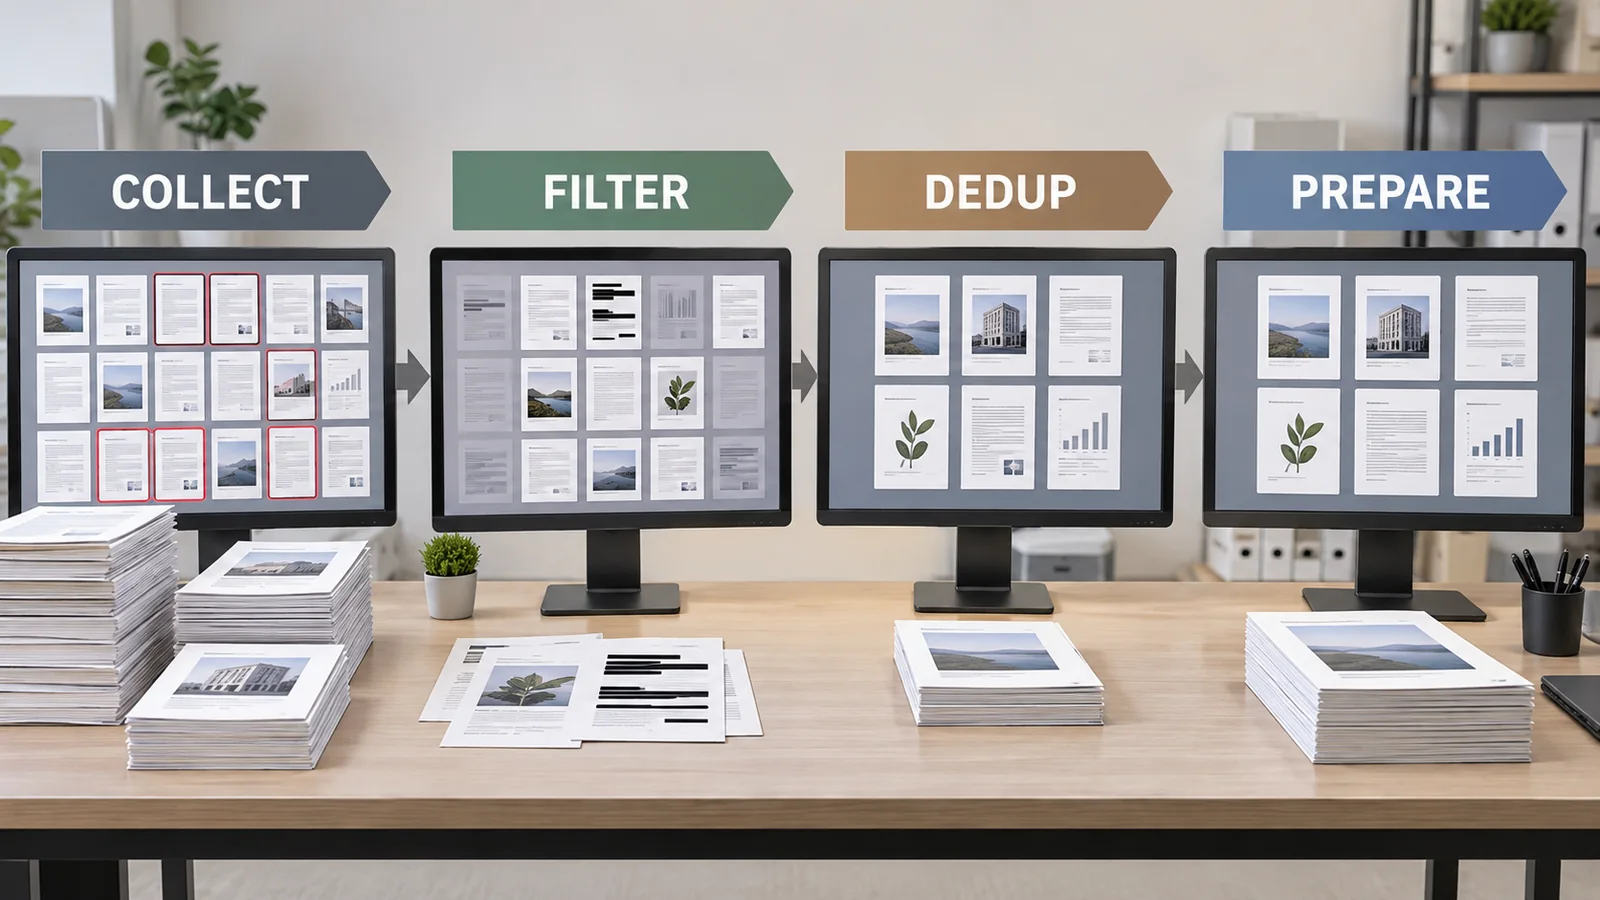
Web data cannot be used for training as it is. The Llama 3 report describes its web-data processing under these items: removal of domains with unsafe content or much personally identifiable information (PII); text extraction and cleaning; de-duplication at three levels (URL, document and line); heuristic filtering; model-based quality filtering; dedicated extraction of code and mathematics; multilingual processing including identification of 176 languages; and deciding the data mix Sourced [Ref. 14].
View original SVG, values and source annotations
- De-duplication: done in turn by URL, by document with MinHash, and by line (removing lines that appear more than six times in a bucket of 30M documents). The report says that line-level de-duplication removes not only boilerplate such as navigation menus but also frequent high-quality text, and yet gave large improvements in experiments [Ref. 14].
- Text extraction: pages with mathematics and code are processed so as to keep their structure, and the alt text of images is kept for pages where equations are shown as images. Markdown markers are removed because they were harmful for a model trained mainly on web data [Ref. 14].
- The mix: decided with a knowledge classifier and "scaling-law experiments" that predict from small models [Ref. 14].
Preparing training data (removing duplicates, removing noise, adjusting the mix) is close, in materials terms, to controlling lots of raw material, removing impurities and adjusting formulations (this article's commentary). If the same passage appears tens of thousands of times, the model learns it by heart (next section). If evaluation questions get mixed into the training data, the evaluation is inflated. This has the same structure as the "data leakage" that occurs when samples of the same family straddle training and evaluation in a materials dataset (see our explainer on machine learning and neural network fundamentals).
When materials and chemistry literature is put into the corpus, how to extract equations, chemical formulae, tables and equations embedded as images becomes a quality issue directly. Llama 3 took the trouble to keep alt text attached to images of mathematics [Ref. 14]. We did not check the quality of figure, table or equation extraction in primary sources.
3. Data quality and memorisation — what duplication causes
Lee et al. reported that existing language-modelling datasets contain many near-duplicate examples and long repeated substrings, and that as a result over 1% of the unprompted output of models trained on them is copied verbatim from the training data. In C4 they found a 61-word English sentence repeated over 60,000 times. Removing duplicates cut the emission of memorised text by a factor of ten and reduced the training steps needed for the same or better accuracy. They also showed that over 4% of the validation sets of standard datasets overlapped with training data Sourced [Ref. 9].
Carlini et al. report that memorisation grows significantly with three factors: the capacity of the model, the number of times an example is duplicated, and the number of tokens of context used to prompt the model Sourced [Ref. 11]. In other words, the larger the model, the stronger the effect of duplicated data (this article's commentary).
There are also attempts to build small, strong models from high-quality data. phi-1, by Gunasekar et al., is a code model of 1.3 billion parameters trained for four days on eight A100 GPUs, on "textbook quality" data selected from the web (6 billion tokens) and textbooks and exercises synthesised with GPT-3.5 (1 billion tokens). The developers report pass@1 of 50.6% on HumanEval and 55.5% on MBPP Sourced (developers' stated values) [Ref. 6]. Sorscher et al. showed, in theory and in experiments on image classification (CIFAR-10, SVHN and ImageNet), that with a good data-pruning metric error can fall faster than a power law Sourced [Ref. 7] (these are not results on language models).
These reports show that not only the amount of data but its quality and selection govern performance. But the definition of quality (what counts as "good") and the method of selection differ from study to study, and have not been established as a general recipe (this article's commentary).
4. Scaling laws — Kaplan-style, Chinchilla-style and later checks
(1) The report by Kaplan et al. (2020)
Kaplan et al. reported that the validation loss (cross-entropy) of language models follows a power law in each of the number of non-embedding parameters N, the amount of data D (tokens) and the amount of compute C. When not limited by the other factors, the exponents are about 0.076 for N, about 0.095 for D and about 0.050 for optimally allocated compute C. The trends can span more than seven orders of magnitude, and dependence on the shape of the model (such as the ratio of depth to width) is weak Sourced [Ref. 12].
For a power law with exponent α, a tenfold increase in scale multiplies the loss by 10−α. That is about 0.84 for N (a 16% reduction), about 0.80 for D and about 0.89 for C (Our calculation). The loss falls by a constant proportion on a logarithmic view as scale increases, never steeply. It can also be read as a tenfold increase in cost buys a reduction in loss of only one to two tenths (this article's commentary). Kaplan et al. concluded that for a fixed compute budget the most compute-efficient course is to train a very large model on a relatively modest amount of data and stop well before convergence. For a tenfold increase in compute, that means a model about 5.5 times larger and about 1.8 times more training tokens Sourced [Ref. 12, 13].
(2) The report by Hoffmann et al. (Chinchilla, 2022)
Hoffmann et al. trained more than 400 models of 70 million to over 16 billion parameters on 5 to 500 billion tokens, and reported that for compute-optimal training, model size and the number of training tokens should be scaled equally (for every doubling of the model, the tokens double too). By three different methods they estimated the exponents of the optimal number of parameters Nopt ∝ Ca and the optimal number of tokens Dopt ∝ Cb against compute C, and the results were close to equal Sourced [Ref. 13].
| Study and method | a in Nopt ∝ Ca | b in Dopt ∝ Cb |
|---|---|---|
| Hoffmann et al., method 1 (lower envelope of training curves) | 0.50 | 0.50 |
| Hoffmann et al., method 2 (IsoFLOP profiles) | 0.49 | 0.51 |
| Hoffmann et al., method 3 (a parametric model of the loss) | 0.46 | 0.54 |
| Kaplan et al. (2020) | 0.73 | 0.27 |
All Sourced (Table 2 of Hoffmann et al. [Ref. 13]). Because compute C ≈ 6ND, a and b sum to about 1.
As a test, Hoffmann et al. trained the 70-billion-parameter Chinchilla on 1.4 trillion tokens with the same compute as Gopher (280 billion parameters, 300 billion tokens). The report states that Chinchilla outperformed Gopher and others on downstream evaluation tasks [Ref. 13]. Most of the large models of the time had been trained on about 300 billion tokens (the figure and table below).
| Model | Parameters | Training tokens | Tokens per parameter | Source |
|---|---|---|---|---|
| GPT-3 | 175 B | 300 B | 1.7 | [10] |
| Gopher | 280 B | 300 B | 1.1 | [13] |
| Megatron-Turing NLG | 530 B | 270 B | 0.5 | [13] |
| Chinchilla | 70 B | 1.4 T | 20 | [13] |
| LLaMA 65B | 65.2 B | 1.4 T | 21.5 | [17] |
| Llama 2 70B | 70 B | 2 T | 28.6 | [19] |
| Llama 3 405B | 405 B | 15.6 T | 38.5 | [14] |
| Llama 3 8B | 8 B | about 15 T | about 1,900 | [14, 15] |
| DeepSeek-V3 (MoE) | 671 B total / 37 B active | 14.8 T | 22 on total / 400 on active | [18] |
Our calculation (tokens ÷ parameters). Parameters and tokens are as stated in each source (Sourced). The token count for Llama 3 8B is the model card's "about 15 trillion" (Llama 3.1). For an MoE model the ratio changes greatly depending on whether total or active parameters are used. "20 tokens per parameter" is a rule of thumb taken from one point of Chinchilla, not a universal value.
Combining the Chinchilla idea with compute C ≈ 6ND and D = 20N gives C = 120N², so N = √(C/120). Putting in the compute Chinchilla used, 5.76×10²³ FLOPs, gives N ≈ 6.9×10¹⁰ (about 69 billion), nearly the same as the actual 70B (Our calculation). Putting in Llama 3's compute of 3.8×1025 FLOPs, on the other hand, gives N ≈ 5.6×10¹¹ (about 560 billion) and D ≈ 11.3 trillion tokens, which differs from the actual 405B and 15.6T. Meta's report says that, by a different fit on its own data, 405B is approximately compute-optimal [Ref. 14]. This is an example of how using a simple ratio on other data and with another fit moves the optimum (this article's commentary).
(3) Later checks and extensions
- Replicating Chinchilla: Besiroglu et al. tried to replicate the third method of Hoffmann et al. and found that the reported estimates were inconsistent with the first two methods, fitted the data badly, and had implausibly narrow confidence intervals. They analyse the causes as the optimiser stopping before convergence and rounding of the estimates in the body text, and say their re-derived values are consistent with the first two methods Sourced [Ref. 23].
- The gap between Kaplan and Chinchilla: Pearce and Song explain much of the gap by Kaplan's counting of parameters without embeddings, combined with analysis at small scale, and so support Chinchilla's coefficients. They recommend that future studies use total parameters and total compute Sourced [Ref. 24].
- Including inference: Sardana et al. note that the Chinchilla formula leaves out inference cost, and report that if a large inference demand (on the order of 1 billion requests) is expected, it is better to train a smaller model for longer than the Chinchilla optimum. They also report that model quality kept improving up to 10,000 tokens per parameter Sourced [Ref. 25].
- When data are limited: Muennighoff et al. report that, at a fixed compute budget with limited data, repeating data for up to 4 epochs changes the loss negligibly compared with unique data, while with more repetition the value of adding compute eventually decays to zero (400 training runs, up to 900 billion tokens and 9-billion-parameter models) Sourced [Ref. 26].
- Beyond language: Henighan et al. report that in image, video, image-and-text and mathematical problem solving too, the loss of autoregressive Transformers improves smoothly as a power law plus a constant, and that the exponent for how optimal model size depends on compute is nearly universal across domains Sourced [Ref. 2]. Hestness et al. likewise report power-law scaling of generalisation error with the amount of training data in four domains: machine translation, language modelling, image processing and speech recognition [Ref. 1].
(1) They are fits to loss (cross-entropy), not to task accuracy. (2) The exponents change with the study, the data and how parameters are counted (Kaplan 0.73, Chinchilla 0.50). (3) Extrapolating beyond the fitted range is not guaranteed. (4) The training optimum changes once inference cost, the amount of data and the number of repeats are included. (5) "Chinchilla-optimal" is the condition that minimises training compute alone, not the optimum for the whole operation.
5. Compute and energy — from FLOPs to GPU hours to electricity
Sevilla et al. summarise that training compute for machine learning doubled roughly every 20 months before 2010, in line with Moore's law, but since the start of deep learning in the early 2010s has doubled about every 6 months, and that in late 2015 large-scale models appeared requiring 10 to 100 times more compute Sourced [Ref. 27] (their summary is from a 2022 paper; we did not check later developments).
From training compute to electricity, the following chain gives an estimate. Compute ≈ 6 × N × D (Section 4) → ÷ effective computing speed → GPU hours → × power × PUE → electricity. Effective computing speed is peak performance multiplied by MFU (model FLOPs utilisation). The PaLM report defined MFU as the ratio of observed throughput to the theoretical maximum throughput of a system running at peak FLOPs, counting no extra operations such as recomputation Sourced [Ref. 22].
| Model | Compute | Hardware and time | How power is defined | Electricity and emissions | Origin |
|---|---|---|---|---|---|
| GPT-3 175B | 3.14×10²³ FLOPs | 10,000 V100 chips, 14.8 days (about 3.55 million chip-hours) | System average 330 W per chip, data-centre PUE 1.10 | 1,287 MWh, 552 tCO2e | Estimate by Patterson et al. [20] |
| BLOOM 176B | — (not checked here) | A100 80GB, 118 days, 1,082,990 GPU hours | Energy figure from the paper's table (the scope it covers was not checked here) | 433,196 kWh. Emissions about 24.7 t counting dynamic power only, about 50.5 tCO2eq including everything up to equipment manufacture | Report by Luccioni et al. [21] |
| Llama 3.1 405B | 3.8×1025 FLOPs [14] | Up to 16K H100 GPUs, 30.84M GPU hours | 700 W (TDP). The card describes the figure as peak GPU power capacity adjusted for PUE | Emissions 8,930 tCO2eq (location-based), 0 (market-based). No electricity figure given | Meta's model card [15] |
All Sourced (as stated in each source). The GPT-3 row is the authors' estimate from public information, not an operational measurement. Power is defined differently in each of the three rows (system average, a whole-system measurement, capacity based on TDP), so do not compare the rows directly. The market-based emission is 0 because Meta states that it matches its electricity use 100% with renewable energy [15].
Our checks (Our calculation)
- Electricity for GPT-3: 3.55M chip-hours × 0.33 kW × PUE 1.10 ≈ 1,289 MWh, close to Patterson et al.'s 1,287 MWh.
- GPU hours for Llama 3 405B: dividing 6·N·D = 3.79×1025 FLOPs by 400 TFLOP/s per GPU, the middle of the stage-by-stage effective speeds of 380 to 430 TFLOP/s per GPU (BF16 MFU 38–43%) reported [14], gives about 26.3M GPU hours. The model card's 30.84M GPU hours is about 1.17 times that. We infer that the gap may include stages other than pre-training, interruptions and restarts.
- Back-calculating peak performance: in Table 4 of the report, 430 TFLOP/s is an MFU of 43%, so the peak performance used as the base is about 1,000 TFLOP/s (430 ÷ 0.43). This is a figure back-calculated from the table; we did not check the GPU's datasheet value.
- A guide to a lower bound on electricity: 30.84M GPU hours × 0.7 kW = about 21.6 GWh (TDP × hours; a simple calculation that leaves out PUE and everything other than the GPUs, such as hosts, networking and cooling). Dividing the 8,930 t of emissions by 21.6 GWh gives about 0.41 kgCO2eq per kWh, but since the model card says it multiplied power by PUE, this division is only a rough guide to carbon intensity.
- The scale of the cluster, not of a single GPU: up to 16,000 GPUs × 700 W ≈ 11.2 MW (the sum of GPU TDP alone) [14]. Power and cooling to remove that much heat are needed in addition.
- Efficiency across generations: comparing FLOPs per kWh for GPT-3 (3.14×10²³ FLOPs / 1,287 MWh) and Llama 3 405B (3.8×1025 FLOPs / about 21.6 GWh) gives about 2.4×10¹⁷ and about 1.8×10¹⁸, a gap of about 7 times. This is the ratio of two rough estimates that differ in generation, numerical precision, utilisation and definition of power, not an exact measure of the efficiency gain.
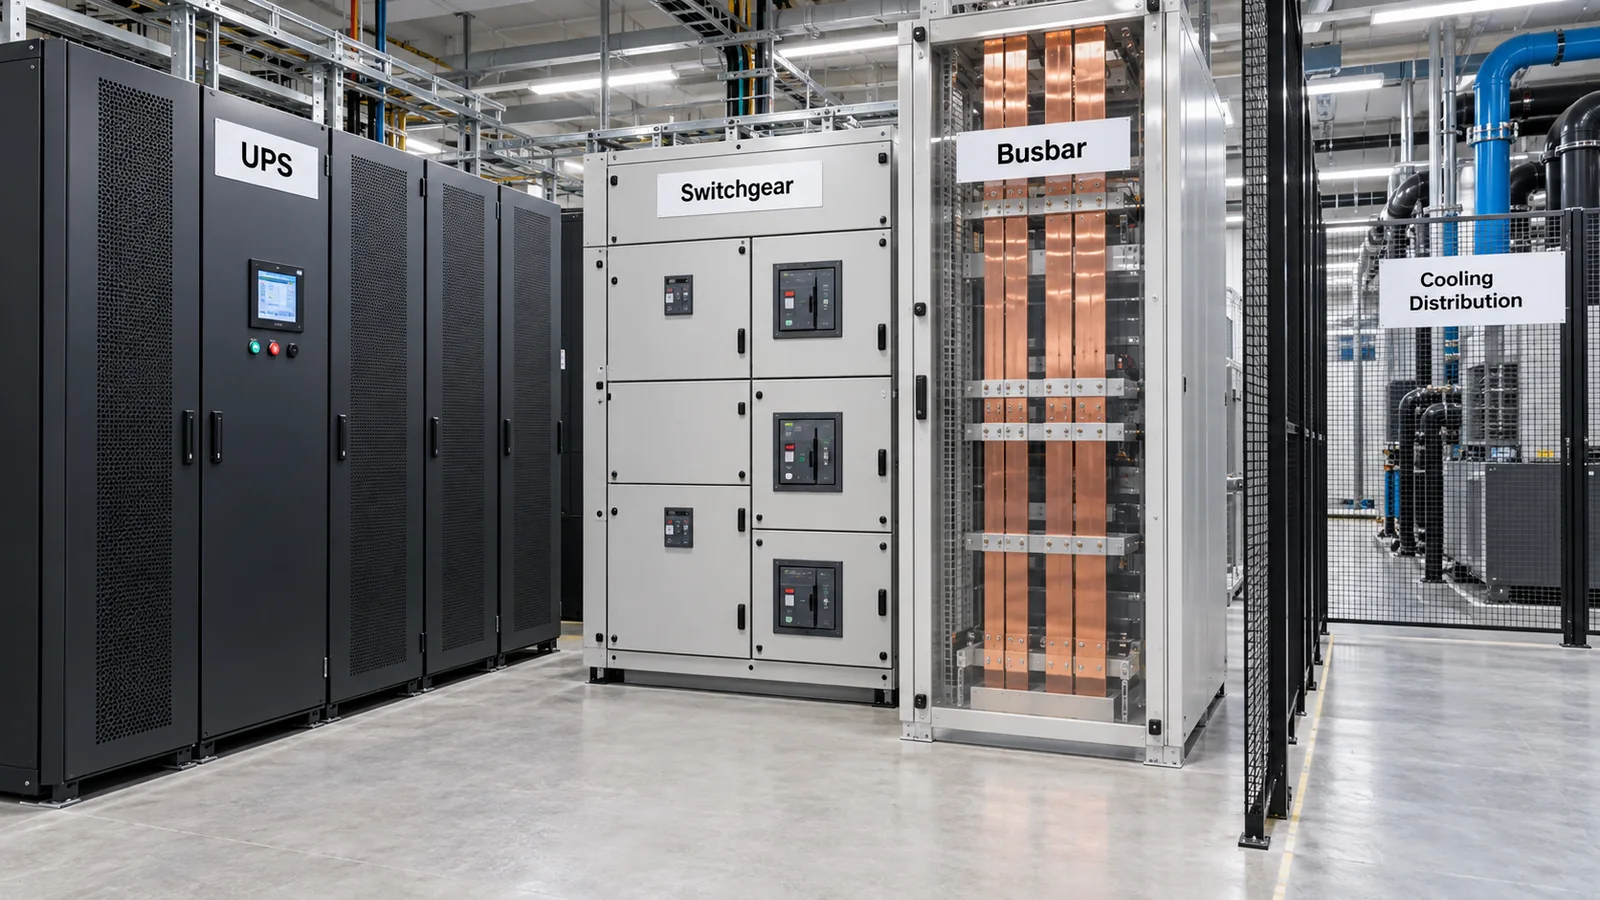
Most of the electricity for one training run ends up as heat. The GPU TDP of up to 16,000 GPUs sums to about 11.2 MW on its own, and carrying that heat away takes liquid or air cooling equipment, thermal interface materials and heat-dissipation components (this article's commentary). Growth in compute directly raises the demands on HBM stacking, 2.5D packaging, thermal interface materials and the materials of power equipment. We cover these in our explainers on power and cooling for AI data centres, thermal interface materials (TIM) and HBM.
For a sense of scale, the IEA reports that global data-centre electricity consumption was about 415 TWh in 2024 (about 1.5% of global electricity consumption), has grown about 12% a year since 2017, and in its Base Case reaches about 945 TWh in 2030 Sourced (the IEA outlook is Not yet confirmed) [Ref. 31]. The roughly 21.6 GWh above is about 0.005% of 415 TWh (about one 19,000th) (Our calculation). But this is the GPU-TDP-only figure for a single training run and excludes repeated experiments, inference and the power of everything other than the GPUs. It does not show training's share of total electricity.
Compute thresholds and regulation
Article 51(2) of the EU's AI Regulation (Regulation (EU) 2024/1689) provides that a general-purpose AI model is presumed to have high-impact capabilities when the cumulative amount of computation used for its training is greater than 1025 FLOPs. The Commission may amend this threshold by delegated act in light of algorithmic improvements and increased hardware efficiency (Article 51(3)) Sourced [Ref. 32]. The consolidated version we checked on EUR-Lex on the checking date (dated 27 July 2026) [Ref. 42] contains the same provision. That consolidated version reflects the amendment made by Regulation (EU) 2026/1744 of 8 July 2026 (the Digital Omnibus on AI) [Ref. 33], but the wording of the threshold in Article 51(2) is unchanged.
Setting published training compute beside this threshold, GPT-3 (3.14×10²³) is about 3% of the threshold, Chinchilla (5.76×10²³) about 6% and Llama 3 405B (3.8×1025) about 3.8 times it (Our calculation). The provision takes "the cumulative amount of computation used for training" as its measure, and this is a mechanism of presumption, not a legal classification of any individual model. The dates of application, the content of the obligations and the details of the Digital Omnibus are covered in our explainer on the EU AI Act.
6. Data exhaustion, consent and synthetic data
(1) How long will public human text last?
Villalobos et al. compared the amount of public human-generated text with the growth in the size of training datasets and estimated that, if current trends continue, models will be trained on datasets approaching essentially all the public text available between 2026 and 2032 (median 2028), or slightly earlier if models are overtrained. Their estimates are about 510 trillion tokens for the whole indexed web (95% interval 130 to 2,100 trillion), about 130 trillion for Common Crawl (100 to 260 trillion), and an effective stock, after allowing for quality and the like, of about 4×10¹⁴ tokens Sourced (estimates) / Not yet confirmed [Ref. 16].
This estimate comes from the 2024 version of the paper, and we did not check how the trend has developed since the checking date. The effective stock depends on how duplication, quality selection and repeated training (the number of epochs) are handled. As Muennighoff et al. showed, repeating up to about 4 epochs has nearly the value of new data, so the practically "usable amount" could be several times the apparent number of tokens, an interpretation that also holds (this article's commentary).
(2) Consent and restrictions: the web's "commons" is closing
Longpre et al. audited over time the terms of service and robots.txt of 14,000 web domains underlying corpora such as C4. In the single year from 2023 to 2024, restrictions on AI training grew rapidly, and they report that over 5% of the tokens in C4, and over 28% of the most actively maintained and critical sources, became fully restricted. Counting restrictions through terms of service, 45% of C4 is restricted Sourced (values at that time) [Ref. 28]. The authors say that, if these restrictions are respected or enforced, they could bias the diversity, freshness and scaling behaviour of general-purpose AI data. The legal questions of copyright and licensing are covered in our explainer on copyright, provenance and deepfakes.
(3) Synthetic data and "model collapse"
One way to make up a shortfall is to use data made by models (synthetic data). phi-1 included textbooks and exercises synthesised with GPT-3.5 (1 billion tokens) in its training data [Ref. 6]. The Llama 3 model card states that its fine-tuning data include over 25 million synthetically generated examples, and the report explains that in each round of post-training, synthetic data were generated from the latest model at that point Sourced [Ref. 14, 15]. On the other hand, Shumailov et al. report that indiscriminate use of model-generated content in training causes irreversible defects in which the tails of the original distribution (rare content) disappear (model collapse), seen in LLMs as well as variational autoencoders Sourced [Ref. 29] (Nature, 2024; a correction was published in March 2025). Gerstgrasser et al. showed, across several model sizes, architectures and hyperparameters, that replacing the original real data with each generation's synthetic data tends towards collapse, whereas accumulating synthetic data alongside the real data avoids it Sourced [Ref. 30].
So synthetic data are not in themselves the problem; how they are mixed with real data, how their quality is controlled and what they are used for matter (this article's commentary). The conclusion changes with the conditions (replacement or accumulation, whether quality selection is applied), so it cannot be generalised to either "synthetic data cannot be used" or "they can be used without limit".
In materials work, data without records of lot, source of raw material and process conditions (traceability) can be neither reproduced nor compared. Training data likewise need records of where they came from, which date they belong to, whether a person or a model wrote them, and whether their use is permitted (provenance). The audit by Longpre et al. shows that the present web mechanisms do not handle provenance and consent information well [Ref. 28] (this article's commentary).
When building a model on in-house materials data too, recording the measurement conditions, instrument, date and sample family together with the data lays the groundwork for later evaluation (how data are split, extrapolation, checking for contamination) (this article's commentary).
7. Limits, and what could not be confirmed / Summary
(1) Training amounts of newer models
The training data volumes and compute in this article come from the principal official sources up to 2025. We did not check values for models released in 2026. Many commercial models do not publish their training data, token counts or compute, and we make no estimates for them.
(2) The correspondence between compute and GPU hours
We could not confirm from the sources whether the 3.8×1025 FLOPs and the 30.84M GPU hours of Llama 3 405B cover the same range of stages. Our check (a gap of about 1.17 times) carries that uncertainty.
(3) Energy on the inference side
This article deals with the electricity of training, not of inference (operation). For the data-centre outlook as a whole we rely on the IEA report and did not check for a 2026 update.
(4) Details of regulation
For the EU threshold we checked only the text of the provision. The dates of application, the content of the obligations and the whole content of the Digital Omnibus are not covered here. The systems of the United States, China and Japan are covered in our explainer on AI policy in the United States, China and Japan.
(5) The texts of standards
The texts of ISO/IEC TR 20226, 30134-2, 5259 and 42001 are paid and we did not check them. We limit ourselves to titles, publication dates and scope.
- A scaling law is a power-law fit to loss. Kaplan's exponents are about 0.076 for N, about 0.095 for D and about 0.050 for C. A tenfold increase in scale cuts loss by only one to two tenths Sourced / Our calculation
- The optimal allocation changes with the study and the conditions. The gap between Kaplan (0.73 on N) and Chinchilla (an equal split, about 0.5) is explained by how parameters are counted and by scale, and including inference cost pushes towards smaller models trained for longer Sourced
- Data quality and duplication matter. Removing duplicates cut memorised output by a factor of ten and reduced the training steps needed Sourced
- Compute converts directly to energy and heat. Llama 3 405B is 3.8×1025 FLOPs, 30.84M GPU hours and about 21.6 GWh as TDP × hours. Data with different definitions of power are not compared directly Sourced / Our calculation
- There is an estimate that public data are finite (to be used up between 2026 and 2032; Not yet confirmed), restrictions on consent are growing, and how to mix in synthetic data is a live question Sourced
8. How to read evaluations and standards
Evaluation for training data and scaling laws divides into the quality of the fit to validation loss, measurement of data quality (duplication, contamination, memorisation), checks of the provenance of data and consent, and reporting of compute and energy. In every case the figure changes with the definition (how parameters are counted, the scope of power), the range and the date. The table below sets out what we could confirm (checked 15 October 2026).
| What is evaluated | Representative benchmarks and methods (name, source) | Standards, guidance and regulation (ISO/IEC, NIST, EU and others) | Cautions in reading |
|---|---|---|---|
| Fitting scaling laws | Power-law fits to validation loss (cross-entropy). Kaplan et al. [12], Hoffmann et al. (three methods) [13]. Checks of replication and consistency: Besiroglu et al. [23], Pearce and Song [24] Sourced | Could not be confirmed | Exponents change with the definition (whether embeddings are counted) and with scale. Outside the fitted range there is no guarantee |
| Data quality, duplication, memorisation | Effect of de-duplication (Lee et al.) [9], measurement of memorisation (Carlini et al.) [11], comparative filter experiments (FineWeb) [8] Sourced | ISO/IEC 5259-1:2024 (data quality: overview, terminology and examples) [36], ISO/IEC 5259-3:2024 (data quality management: requirements and guidelines) [37] Sourced | The definition of "quality" differs between studies. We did not check the standards' texts and state no requirements |
| Benchmark contamination | Measuring overlap between training and validation data (Lee et al.: over 4% of validation sets of standard datasets overlapped) [9]. Proposed countermeasures such as encrypting test data (Jacovi et al.) [41] Sourced | Could not be confirmed | From outside, it is hard to confirm whether contamination exists |
| Provenance and consent of data | A longitudinal audit of the terms of service and robots.txt of 14,000 domains (Longpre et al.) [28] Sourced | Could not be confirmed | Values are for the time of the audit and keep changing. Legal questions are covered in another explainer |
| Training compute and efficiency | FLOPs estimate (6ND) [12], the definition of MFU (PaLM) [22], the reported BF16 MFU of 38–43% (Llama 3 405B) [14]. MLPerf Training: time to reach a quality target [40] Sourced | EU Regulation 2024/1689, Article 51(2): a model is presumed to have high-impact capabilities above 1025 FLOPs of cumulative training compute (retained in the consolidated version of 27 July 2026) [32, 42] Sourced | The FLOP figure changes with how it is counted (MoE, whether post-training compute is included). The threshold is a mechanism of presumption, not an individual classification |
| Energy and environment | Published values: Meta's model card (GPU hours, 700 W, location-based and market-based emissions) [15]. Estimates: Patterson et al. [20], Luccioni et al. [21]. Data centres overall: IEA [31] Sourced | ISO/IEC TR 20226:2025 (environmental sustainability aspects of AI systems, and potentially related metrics; July 2025; a technical report) [34]. ISO/IEC 30134-2:2026 (data centre KPIs, power usage effectiveness (PUE); 2nd edition, January 2026) [35]. NIST AI 600-1: defines "Environmental Impacts" as one of 12 risks [38] Sourced | Check how power is defined (TDP, system average, whole facility), whether PUE is included, and the basis of emissions (location or market). A TR is informational, not certifiable |
| Risk management and operation | — | ISO/IEC 42001:2023 (AI management systems) [39]. NIST AI 600-1 (Generative AI Profile, July 2024) [38] Sourced | Mostly voluntary. We did not check the texts and state no requirements |
The arrangement of the table is Our calculation (organisation). The numbers, titles and publication dates of ISO/IEC standards were checked on the official ISO pages, the EU regulation on EUR-Lex and NIST in the NIST document (checked 15 October 2026). The texts of standards are paid, so we limit ourselves to titles and scope.
Cautions in reading (for materials engineers)
- Scaling-law numbers come with a definition and a range: do not apply exponents, or a rule of thumb such as "20 tokens per parameter", as they stand to other data, other scales or other purposes. An improvement in loss is not an improvement in task performance.
- For energy figures, check how power is defined: the value changes with TDP × hours, system average power, or whole facility (including PUE). Emissions also change with whether they are location-based or market-based. Keep third-party estimates such as GPT-3's apart from published values.
- The "threshold" and the "guidance" of standards and regulation play different roles: the EU regulation's 1025 FLOPs is a presumption mechanism in law, ISO/IEC TR 20226 is an informational technical report, and the PUE standard is a measurement method. None is a figure showing the merit or safety of an individual model. Most ISO/IEC standards are voluntary and generally gain binding force only when cited in law or contract (this article's commentary).
- Forecasts are not results: outlooks for data exhaustion and electricity are Not yet confirmed estimates, and change when their assumptions change.
9. Glossary
- Scaling law
- An empirical power law relating loss to model size, amount of data and compute.
- Power law
- A relation in which loss falls as a power of scale (L ∝ x−α). A straight line on a log-log graph.
- Compute-optimal (Chinchilla-optimal)
- The split of model size and token count that minimises loss for a given compute budget.
- FLOPs / FLOP/s
- The number of floating-point operations / the number per second. Training compute ≈ 6 × N × D.
- MFU
- Model FLOPs utilisation. Observed throughput divided by the theoretical maximum at peak performance.
- TDP / PUE
- A guide to design heat output (W) / the efficiency index of whole-facility power divided by IT equipment power.
- Tokens-per-parameter ratio
- Training tokens divided by parameters. Chinchilla is about 20.
- De-duplication
- Removing identical or near-identical documents and lines, using methods such as MinHash.
- Memorisation
- The state in which a model can output passages of its training data verbatim.
- Overtraining
- Training on more tokens than compute-optimal. Used to make a small model strong for inference.
- Epoch
- How many passes were made over the same data. The number of repeats.
- Model collapse
- The loss of the tails of the original distribution when models are repeatedly trained on data generated by models.
- Synthetic data
- Training data generated by a model rather than a person.
- robots.txt
- A file in which a website tells crawlers which parts they may fetch.
- Consolidated version (EUR-Lex)
- A reference version combining a legal act and its amendments, without legal effect.
10. References
- Hestness J. et al. (Baidu Research) "Deep Learning Scaling is Predictable, Empirically", arXiv:1712.00409 — arxiv.org/abs/1712.00409
- Henighan T. et al. "Scaling Laws for Autoregressive Generative Modeling", arXiv:2010.14701 — arxiv.org/abs/2010.14701
- Raffel C. et al. "Exploring the Limits of Transfer Learning with a Unified Text-to-Text Transformer" (C4), arXiv:1910.10683 — arxiv.org/abs/1910.10683
- Gao L. et al. "The Pile: An 800GB Dataset of Diverse Text for Language Modeling", arXiv:2101.00027 — arxiv.org/abs/2101.00027
- Soldaini L. et al. "Dolma: an Open Corpus of Three Trillion Tokens for Language Model Pretraining Research", arXiv:2402.00159 — arxiv.org/abs/2402.00159
- Gunasekar S. et al. "Textbooks Are All You Need", arXiv:2306.11644 — arxiv.org/abs/2306.11644
- Sorscher B. et al. "Beyond neural scaling laws: beating power law scaling via data pruning", arXiv:2206.14486 — arxiv.org/abs/2206.14486
- Penedo G. et al. "The FineWeb Datasets: Decanting the Web for the Finest Text Data at Scale", arXiv:2406.17557 — arxiv.org/abs/2406.17557
- Lee K. et al. "Deduplicating Training Data Makes Language Models Better", arXiv:2107.06499 — arxiv.org/abs/2107.06499
- Brown T. B. et al. "Language Models are Few-Shot Learners", arXiv:2005.14165 — arxiv.org/abs/2005.14165
- Carlini N. et al. "Quantifying Memorization Across Neural Language Models", arXiv:2202.07646 — arxiv.org/abs/2202.07646
- Kaplan J. et al. "Scaling Laws for Neural Language Models", arXiv:2001.08361 — arxiv.org/abs/2001.08361
- Hoffmann J. et al. "Training Compute-Optimal Large Language Models", arXiv:2203.15556 — arxiv.org/abs/2203.15556
- Grattafiori A. et al. (Llama Team, Meta) "The Llama 3 Herd of Models", arXiv:2407.21783 — arxiv.org/abs/2407.21783
- Meta "Llama 3.1 Model Card" (GitHub: meta-llama/llama-models) — github.com/meta-llama/llama-models/.../MODEL_CARD.md
- Villalobos P. et al. (Epoch AI and others) "Will we run out of data? Limits of LLM scaling based on human-generated data", arXiv:2211.04325 — arxiv.org/abs/2211.04325
- Touvron H. et al. "LLaMA: Open and Efficient Foundation Language Models", arXiv:2302.13971 — arxiv.org/abs/2302.13971
- DeepSeek-AI "DeepSeek-V3 Technical Report", arXiv:2412.19437 — arxiv.org/abs/2412.19437
- Touvron H. et al. "Llama 2: Open Foundation and Fine-Tuned Chat Models", arXiv:2307.09288 — arxiv.org/abs/2307.09288
- Patterson D. et al. "Carbon Emissions and Large Neural Network Training", arXiv:2104.10350 — arxiv.org/abs/2104.10350
- Luccioni A. S., Viguier S., Ligozat A.-L. "Estimating the Carbon Footprint of BLOOM, a 176B Parameter Language Model", arXiv:2211.02001 — arxiv.org/abs/2211.02001
- Chowdhery A. et al. "PaLM: Scaling Language Modeling with Pathways", arXiv:2204.02311 — arxiv.org/abs/2204.02311
- Besiroglu T. et al. "Chinchilla Scaling: A replication attempt", arXiv:2404.10102 — arxiv.org/abs/2404.10102
- Pearce T., Song J. "Reconciling Kaplan and Chinchilla Scaling Laws", arXiv:2406.12907 (TMLR 2024) — arxiv.org/abs/2406.12907
- Sardana N. et al. "Beyond Chinchilla-Optimal: Accounting for Inference in Language Model Scaling Laws", arXiv:2401.00448 — arxiv.org/abs/2401.00448
- Muennighoff N. et al. "Scaling Data-Constrained Language Models", arXiv:2305.16264 — arxiv.org/abs/2305.16264
- Sevilla J. et al. "Compute Trends Across Three Eras of Machine Learning", arXiv:2202.05924 (IJCNN 2022) — arxiv.org/abs/2202.05924
- Longpre S. et al. "Consent in Crisis: The Rapid Decline of the AI Data Commons", arXiv:2407.14933 — arxiv.org/abs/2407.14933
- Shumailov I. et al. "AI models collapse when trained on recursively generated data", Nature 631, 755–759 (2024), DOI 10.1038/s41586-024-07566-y (open access) — nature.com/articles/s41586-024-07566-y
- Gerstgrasser M. et al. "Is Model Collapse Inevitable? Breaking the Curse of Recursion by Accumulating Real and Synthetic Data", arXiv:2404.01413 — arxiv.org/abs/2404.01413
- International Energy Agency (IEA) "Energy and AI" (published 10 April 2025) — iea.org/reports/energy-and-ai
- European Parliament and Council Regulation (EU) 2024/1689 (AI Act), 13 June 2024, OJ L 2024/1689 (EUR-Lex, original text) — eur-lex.europa.eu/eli/reg/2024/1689/oj/eng
- European Parliament and Council Regulation (EU) 2026/1744, 8 July 2026 (Digital Omnibus on AI; amends Regulation (EU) 2024/1689 and others; OJ 24 July 2026) — eur-lex.europa.eu/eli/reg/2026/1744/oj/eng
- ISO/IEC "ISO/IEC TR 20226:2025 Information technology — Artificial intelligence — Environmental sustainability aspects of AI systems" (ISO page) — iso.org/standard/86177.html
- ISO/IEC "ISO/IEC 30134-2:2026 Information technology — Data centres key performance indicators — Part 2: Power usage effectiveness (PUE)" (ISO page) — iso.org/standard/85172.html
- ISO/IEC "ISO/IEC 5259-1:2024 Artificial intelligence — Data quality for analytics and machine learning (ML) — Part 1: Overview, terminology, and examples" (ISO page) — iso.org/standard/81088.html
- ISO/IEC "ISO/IEC 5259-3:2024 Artificial intelligence — Data quality for analytics and machine learning (ML) — Part 3: Data quality management requirements and guidelines" (ISO page) — iso.org/standard/81092.html
- NIST "Artificial Intelligence Risk Management Framework: Generative Artificial Intelligence Profile", NIST AI 600-1, July 2024, DOI 10.6028/NIST.AI.600-1 — doi.org/10.6028/NIST.AI.600-1
- ISO/IEC "ISO/IEC 42001:2023 AI management systems" (ISO page) — iso.org/standard/81230.html
- MLCommons "MLPerf Training" (latest version shown on the checking date: v6.0) — mlcommons.org/benchmarks/training/
- Jacovi A. et al. "Stop Uploading Test Data in Plain Text: Practical Strategies for Mitigating Data Contamination by Evaluation Benchmarks", arXiv:2305.10160 — arxiv.org/abs/2305.10160
- European Parliament and Council Regulation (EU) 2024/1689, consolidated version of 27 July 2026 (EUR-Lex; a reference version without legal effect) — eur-lex.europa.eu/legal-content/EN/TXT/HTML/?uri=CELEX:02024R1689-20260727
11. Claim-to-source audit
| Claim in the text | Basis | Class |
|---|---|---|
| Power-law scaling of generalisation error with data in four domains (machine translation, language modelling, image processing, speech recognition). Power-law-plus-constant improvement of autoregressive Transformer loss in image, video, image-and-text and mathematics, with a nearly universal exponent for optimal size against compute | Hestness et al.; Henighan et al. Reference 1 https://arxiv.org/abs/1712.00409 Reference 2 https://arxiv.org/abs/2010.14701 | Sourced |
| C4 (hundreds of GB of English text), The Pile (825 GiB, 22 subsets), Dolma (3 trillion tokens, about 200 TB to about 11 TB, six sources, counted with the LLaMA tokenizer), FineWeb (96 snapshots, 15 trillion tokens, more than 50 candidate filters, FineWeb-Edu 1.3 trillion) | The original papers Reference 3 https://arxiv.org/abs/1910.10683 Reference 4 https://arxiv.org/abs/2101.00027 Reference 5 https://arxiv.org/abs/2402.00159 Reference 8 https://arxiv.org/abs/2406.17557 | Sourced |
| phi-1 (1.3 billion parameters, 6 billion tokens of textbook-quality data plus 1 billion synthetic, four days on eight A100s, HumanEval 50.6% and MBPP 55.5%). The possibility of beating a power law by data pruning (theory and ResNet experiments) | Gunasekar et al.; Sorscher et al. Reference 6 https://arxiv.org/abs/2306.11644 Reference 7 https://arxiv.org/abs/2206.14486 | Sourced |
| The amount of duplication (over 1% of output copied verbatim, a 61-word sentence over 60,000 times), a tenfold fall in memorised output after de-duplication, over 4% overlap with validation sets. Memorisation growing with capacity, duplication count and context length | Lee et al.; Carlini et al. Reference 9 https://arxiv.org/abs/2107.06499 Reference 11 https://arxiv.org/abs/2202.07646 | Sourced |
| GPT-3: 175B, 300 billion tokens, 3.14×10²³ FLOPs (consistent with Patterson et al.'s table) | Brown et al. Reference 10 https://arxiv.org/abs/2005.14165 | Sourced |
| The exponents of the loss power laws (about 0.076 for N, 0.095 for D, 0.050 for C), trends over seven or more orders of magnitude, weak dependence on shape, C ≈ 6N per token, C ≈ 6NBS, and the compute-efficient course of training very large models on modest data and stopping before convergence | Kaplan et al. (2020) Reference 12 https://arxiv.org/abs/2001.08361 | Sourced |
| Chinchilla: more than 400 models, scaling model and tokens equally, the exponents of the three methods (0.50/0.50, 0.49/0.51, 0.46/0.54), Kaplan's 0.73/0.27, model 5.5 times and tokens 1.8 times for 10 times the compute (implied by Kaplan), Gopher 280B and 300B, Chinchilla 70B and 1.4T, Gopher's compute of 5.76×10²³, and the scale of the models in Table 1 | Hoffmann et al. (2022) Reference 13 https://arxiv.org/abs/2203.15556 | Sourced |
| Llama 3: about 15T (flagship 15.6T) tokens, 1.8T for Llama 2, 3.8×1025 FLOPs, 405B approximately compute-optimal, up to 16K H100 (700 W TDP), BF16 MFU 38–43% (Table 4: 430/400/380 TFLOP/s), the data mix (general knowledge 50%, mathematics and reasoning 25%, code 17%, multilingual 8%), knowledge cut-off (end of 2023), the processing items (PII and safety filters, extraction, URL, document and line de-duplication, heuristics, quality classifiers, code and mathematics, 176 languages), and synthetic data in post-training | Llama Team (2024) Reference 14 https://arxiv.org/abs/2407.21783 | Sourced |
| Llama 3.1 model card: about 15 trillion tokens, GPU hours (8B 1.46M, 70B 7.0M, 405B 30.84M, 39.3M in total), 700 W, emissions (405B: 8,930 tCO2eq location-based, 0 market-based), power as peak GPU capacity adjusted for PUE, over 25 million synthetic examples | Meta's model card Reference 15 https://github.com/meta-llama/llama-models/blob/main/models/llama3_1/MODEL_CARD.md | Sourced |
| Estimates of public human-generated text (about 510 trillion tokens for the indexed web, about 130 trillion for Common Crawl, an effective stock of about 4×10¹⁴) and the outlook that use approaches the full stock between 2026 and 2032 (median 2028) | Villalobos et al. (estimate) Reference 16 https://arxiv.org/abs/2211.04325 | Not yet confirmed |
| LLaMA 65B: 65.2B and 1.4T. Llama 2: 2 trillion tokens. DeepSeek-V3: 14.8T tokens | The respective reports Reference 17 https://arxiv.org/abs/2302.13971 Reference 19 https://arxiv.org/abs/2307.09288 Reference 18 https://arxiv.org/abs/2412.19437 | Sourced |
| The GPT-3 estimate (10,000 V100 chips, 14.8 days, 1,287 MWh, 552 tCO2e, 330 W, PUE 1.10) | Patterson et al. (the authors' estimate) Reference 20 https://arxiv.org/abs/2104.10350 | Sourced |
| BLOOM: 1,082,990 GPU hours, 433,196 kWh, 118 days, A100 80GB, emissions about 24.7 t (dynamic power only) and about 50.5 t (whole life cycle) | Luccioni et al. Reference 21 https://arxiv.org/abs/2211.02001 | Sourced |
| The definition of MFU (observed throughput divided by theoretical maximum throughput) | Chowdhery et al. (PaLM) Reference 22 https://arxiv.org/abs/2204.02311 | Sourced |
| The replication of Chinchilla's third method (inconsistent estimates, the effects of stopping before convergence and of rounding), and the cause of the Kaplan–Chinchilla gap (excluding embeddings, and small scale) | Besiroglu et al.; Pearce and Song Reference 23 https://arxiv.org/abs/2404.10102 Reference 24 https://arxiv.org/abs/2406.12907 | Sourced |
| With inference demand (about 1 billion requests), train smaller and longer than Chinchilla-optimal; quality improving up to 10,000 tokens per parameter. With limited data, up to 4 epochs of repetition is almost as good as new data | Sardana et al.; Muennighoff et al. Reference 25 https://arxiv.org/abs/2401.00448 Reference 26 https://arxiv.org/abs/2305.16264 | Sourced |
| Doubling times of training compute (about 20 months before 2010, about 6 months since), and large-scale models from late 2015 | Sevilla et al. (a 2022 summary) Reference 27 https://arxiv.org/abs/2202.05924 | Sourced |
| The audit of terms of service and robots.txt (14,000 domains; over 5% of C4 and over 28% of critical sources fully restricted; 45% including terms of service) | Longpre et al. Reference 28 https://arxiv.org/abs/2407.14933 | Sourced |
| Model collapse, in which the tails of the original distribution disappear when model-generated content is used indiscriminately (corrected March 2025). Accumulating on real data avoids collapse | Shumailov et al.; Gerstgrasser et al. Reference 29 https://www.nature.com/articles/s41586-024-07566-y Reference 30 https://arxiv.org/abs/2404.01413 | Sourced |
| IEA: data-centre electricity consumption of about 415 TWh in 2024 (about 1.5% of the world), growth of about 12% a year since 2017, about 945 TWh in 2030 in the Base Case (an outlook) | IEA "Energy and AI" (10 April 2025) Reference 31 https://www.iea.org/reports/energy-and-ai | Sourced |
| EU Regulation 2024/1689 Article 51(2) (presumption of high-impact capabilities above 1025 FLOPs of cumulative training compute) and Article 51(3) (threshold amendable by delegated act). The same text in the consolidated version of 27 July 2026. That Regulation (EU) 2026/1744 (8 July 2026, Digital Omnibus on AI) amended it | EUR-Lex Reference 32 https://eur-lex.europa.eu/eli/reg/2024/1689/oj/eng Reference 33 https://eur-lex.europa.eu/eli/reg/2026/1744/oj/eng Reference 42 https://eur-lex.europa.eu/legal-content/EN/TXT/HTML/?uri=CELEX:02024R1689-20260727 | Sourced |
| Numbers, titles and publication dates of ISO/IEC TR 20226:2025 (July 2025; environmental sustainability aspects and potentially related metrics), ISO/IEC 30134-2:2026 (January 2026; 2nd edition; PUE), 5259-1 and 5259-3:2024 and 42001:2023 | ISO pages Reference 34 https://www.iso.org/standard/86177.html Reference 35 https://www.iso.org/standard/85172.html Reference 36 https://www.iso.org/standard/81088.html Reference 37 https://www.iso.org/standard/81092.html Reference 39 https://www.iso.org/standard/81230.html | Sourced |
| NIST AI 600-1: 12 risks, and the definition of "Environmental Impacts" (impacts of high compute use in training or operating) | Text of NIST AI 600-1 Reference 38 https://doi.org/10.6028/NIST.AI.600-1 | Sourced |
| MLPerf Training (time to reach a quality target; latest version shown on the checking date: v6.0). The proposal of contamination countermeasures such as encrypting test data | MLCommons; Jacovi et al. Reference 40 https://mlcommons.org/benchmarks/training/ Reference 41 https://arxiv.org/abs/2305.10160 | Sourced |
| The loss multipliers for a tenfold scale (0.84, 0.80, 0.89), the tokens-per-parameter table, the estimates of N from D = 20N and C = 120N² (about 69 billion, about 560 billion), the check of GPT-3's electricity (about 1,289 MWh), the back-calculated GPU hours for Llama 3 405B (about 26.3M), about 21.6 GWh, about 11.2 MW, the ratio of FLOPs per kWh (about 7 times), the IEA ratio of about one 19,000th, and the ratios to the EU threshold (about 3%, about 6%, about 3.8 times) | Our calculation (rough estimates using each source's published values; TDP × hours without a PUE correction; values with different definitions of power are not compared directly). Not measurements | Our calculation |
| Training volumes and compute of models of 2026, training data and compute of undisclosed models, the range of stages covered by Llama 3 405B's FLOPs and GPU hours, inference-side electricity, the whole content of the Digital Omnibus, and the texts of standards | Could not be confirmed in the primary sources accessible within the scope of this survey, so they are not stated | Commentary |
| The readings that "preparing training data resembles lot and impurity control", "a FLOP figure becomes a figure for heat and facilities", "the provenance of data corresponds to the traceability of a material" and "a scaling law is a tool for prediction, not a guarantee", and their implications for materials and research | This article's arrangement and commentary based on published content. Not views stated by any institution | Commentary |
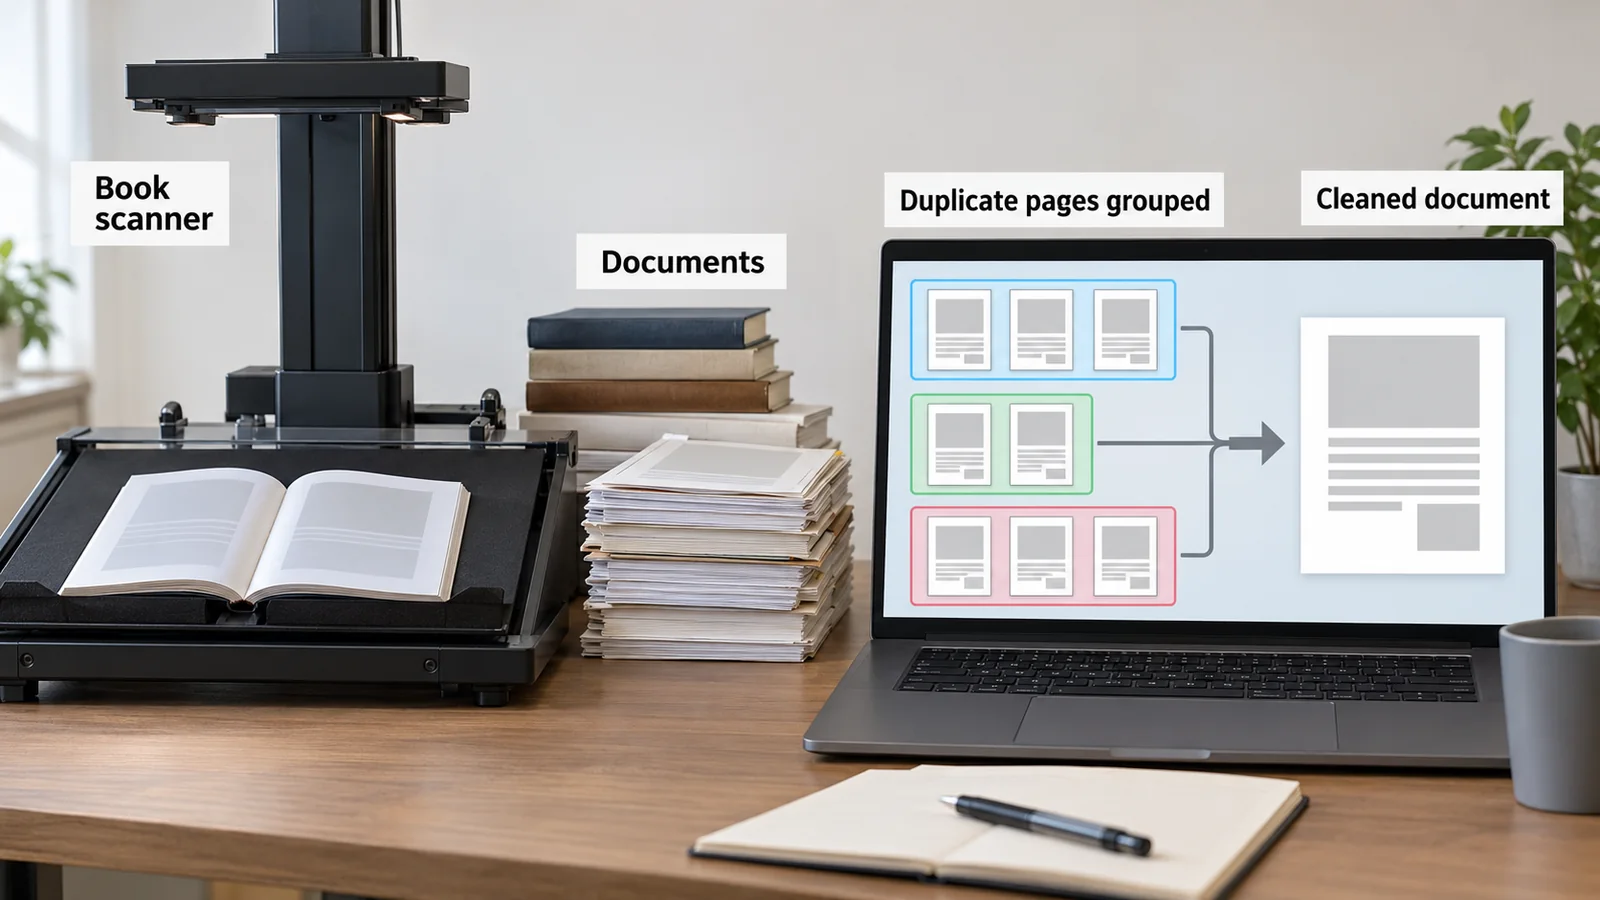
| That Figs. 2 to 5 and 7 are explanatory drawings, not observed data, and that Figs. 1 and 6 are AI-generated image slots | Note by this article | Commentary |
Last updated 15 October 2026. Sources are limited to primary material (the original arXiv papers, a Nature paper, Meta's model card, an IEA report, EUR-Lex, and official ISO and NIST pages). The texts of ISO/IEC standards are paid and could not be checked. Model scales, compute and energy are as stated in published material on the checking date, and third-party estimates are kept apart from published values. Training volumes of models of 2026, the training data and compute of undisclosed models, the range of stages covered by Llama 3 405B's FLOPs and GPU hours, inference-side electricity, the whole content of the Digital Omnibus, and the texts of ISO/IEC standards could not be confirmed and are not stated here. All figures are explanatory concept graphics or drawings that include our calculations. Figs. 1 and 6 are AI-generated image slots (images not yet placed), and none of them shows a real facility or measured data.