TECHNOLOGY EXPLAINER
Impedance Measurement
— Reading an Interface by Its Frequency-by-Frequency Response, Not Just Its Resistance
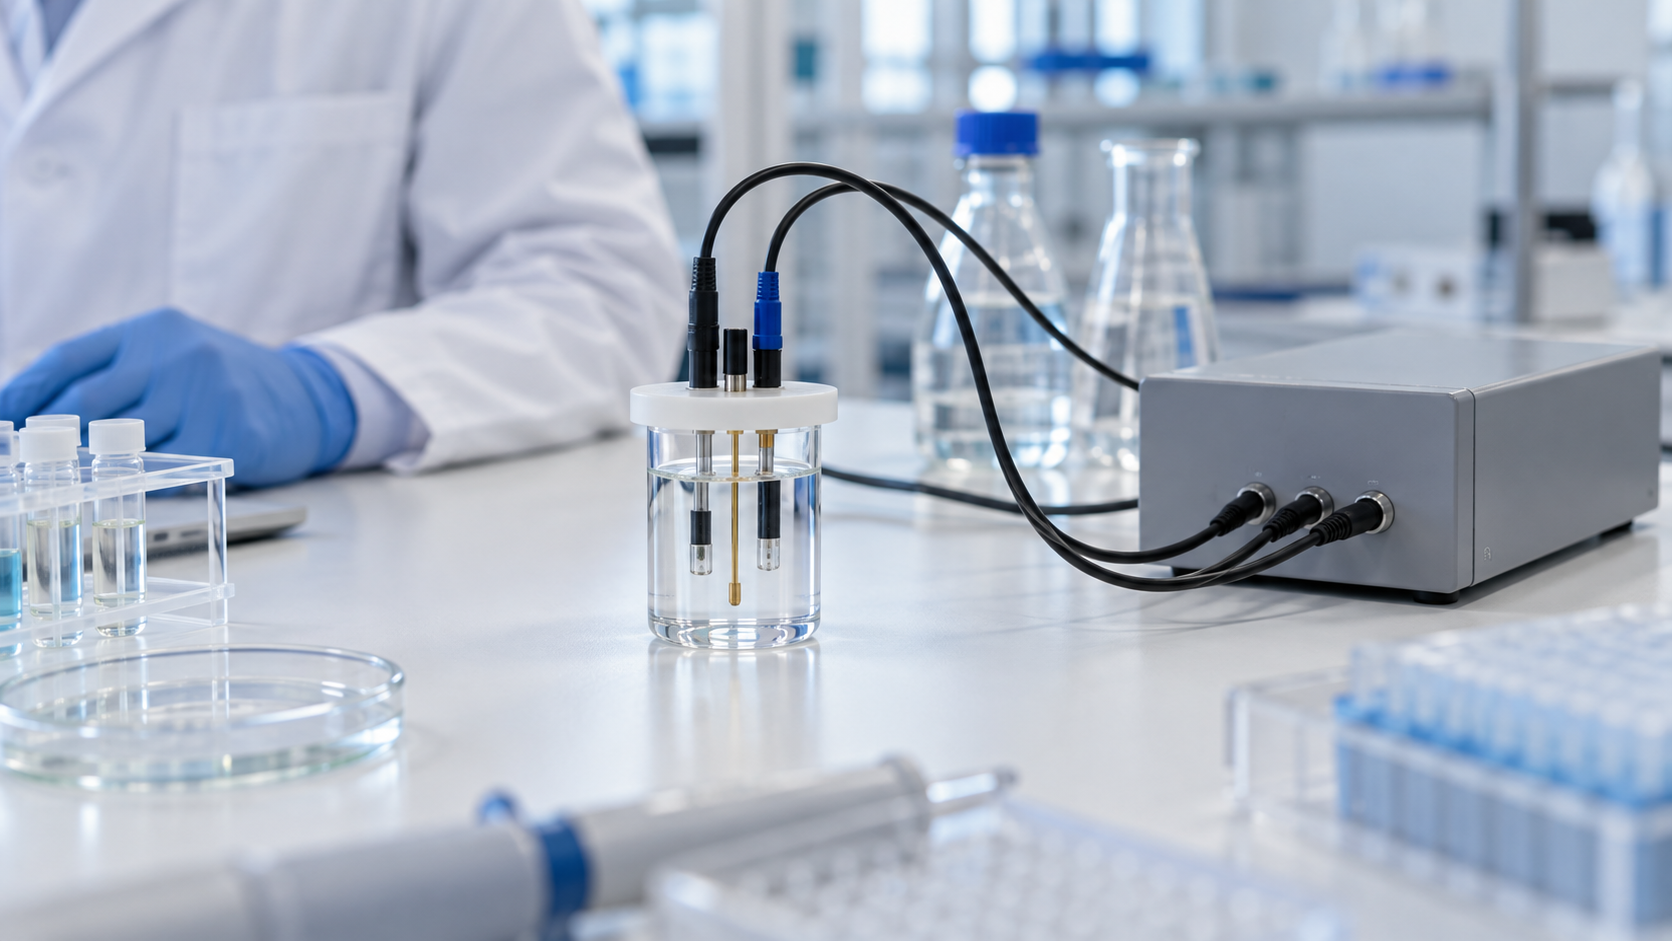
Electrochemical impedance spectroscopy (EIS) applies a small alternating signal at varying frequencies and reads what the electrode-sample interface is doing. It can detect antibody binding without labels and probe the contact between skin and an electrode, and its uses are broad, but interpreting the spectrum is the hardest part. This article sets out the principle, equivalent circuits, materials and the pitfalls of interpretation, for materials engineers. It is not medical advice.
- What impedance measurement is, in three lines
- From resistance to impedance: complex numbers, phase and the Nyquist plot
- Equivalent circuits and the Randles circuit
- Our calculation: where the semicircle peaks, and how long a scan takes
- Label-free immunosensors: reading binding as a rise in Rct
- A materials engineer's view (1): interface materials set Rct
- Impedance of skin and tissue
- A materials engineer's view (2): at the skin, electrode material, moisture and pressure all matter
- Why interpretation is hard: the order in which to doubt
- Standards, regulation and what we could not confirm
- Glossary / References / Claim-to-source audit
Sourced = stated in published material (source linked)
Our calculation = a value this article derived from explicitly stated assumptions
Not yet confirmed = a plan or target with no confirmed outcome
Materials-design readings are marked Commentary; weakly grounded guesses are marked Inference.
Performance figures are given together with what they were compared against, what sample was used and under what conditions. Please do not read in vitro or skin-phantom results as clinical performance in everyday life.
1. What impedance measurement is, in three lines
Impedance measurement is "a method that applies a small alternating voltage (or current) and measures, at each frequency, the size of the response and its phase shift". In electrochemistry it is called electrochemical impedance spectroscopy (EIS).
- How it works: the review by Grieshaber et al. describes applying a small sinusoidal potential, measuring the current response, and varying the frequency to obtain the complex impedance, which combines resistive and capacitive partsSourced
- Strengths: the review by Daniels and Pourmand presents impedance biosensors as a class of electrical biosensors that show promise for point-of-care and other uses because of low cost, ease of miniaturisation and label-free operationSourced
- The hard part: the same review says there are challenges shared by all label-free affinity biosensors and also challenges unique to impedance readoutSourced. The second half of this article digs into these from the viewpoints of materials and interpretation
This article explains principles, materials and interpretation. It gives no advice to individual readers about diagnosis, treatment or how to read a measured value. It does not rank any particular product or company.
2. From resistance to impedance: complex numbers, phase and the Nyquist plot
With direct current, the ratio of voltage to current is a single number (resistance). With alternating current, capacitors make the current lag or lead the voltage. Combining this magnitude and phase shift gives the impedance Z, a complex number with a real part (resistive, Z′) and an imaginary part (capacitive or inductive, Z″). Grieshaber et al. write Z(jω) = U(jω)/I(jω) = Z′(ω) + jZ″(ω), with ω = 2πfSourced.
| Plot | Axes | What it shows well |
|---|---|---|
| Nyquist plot | Real part Z′ against the sign-reversed imaginary part −Z″. Frequency is hidden in the position of each point | Resistive processes (the size of a semicircle is a resistance). Magar et al. say Nyquist plots are typically used for analysing resistive processesSourced |
| Bode plot | Frequency against impedance magnitude |Z| and phase angle | Capacitive systems and frequency-by-frequency behaviour. Magar et al. say Bode plots are used for evaluating capacitive systemsSourced |
Magar et al. 2021 [Ref. 2], Grieshaber et al. 2008 [Ref. 3].
EIS comes in two forms. Faradaic EIS looks at the electron transfer of a redox probe in solution reacting at the electrode, while non-Faradaic EIS triggers no reaction and looks at changes in the capacitance of the electrical double layerSourced (Magar et al.). As an example of measurement conditions, the figure in Magar et al. uses 1 mM ferricyanide as the standard redox probe, an AC potential of 5 mV and a frequency sweep from 10,000 to 0.1 HzSourced. In an immunosensor example introduced in the tutorial by Lazanas and Prodromidis, 0.1 to 10⁵ Hz, a +0.200 V bias and 10 mV (rms) were usedSourced.
3. Equivalent circuits and the Randles circuit
To pull information about an electrode interface out of a spectrum, a common approach is to model the interface as a combination of resistors and capacitors (an equivalent circuit) and choose element values that reproduce the spectrum. The most basic is the Randles circuit (Randles' original paper was published in Discussions of the Faraday Society in 1947Sourced). Lazanas and Prodromidis describe it as a solution resistance Ru (called Rs in this article) in series with a parallel combination of the double-layer capacitance Cdl and the impedance of the Faradaic process ZF, where ZF splits into the charge-transfer resistance Rct and the Warburg impedance Zw, which expresses the difficulty of mass transportSourced.
| Element | What it represents | From the electrode and materials side |
|---|---|---|
| Rs (solution resistance) | Resistance of the electrolyte. The left end of the semicircle on the high-frequency side | Varies with electrode spacing, ionic strength of the sample and temperature (commentary) |
| Cdl (double-layer capacitance) | Capacitance of the electrical double layer at the electrode-solution interface | Varies with electrode area, roughness, and the thickness and permittivity of any film on the surface. Capacitance is inversely proportional to the thickness of the insulating layer (C = εε₀A/d)Sourced (Grieshaber et al.) |
| Rct (charge-transfer resistance) | Resistance to the redox probe exchanging electrons at the electrode. The diameter of the semicircle | Increases the more a molecular layer on the surface (SAM, antibody, protein) hinders electron transferSourced (Lazanas et al.) |
| Zw (Warburg) | Difficulty of redox species diffusing to the electrode. A 45° straight line on the low-frequency side | Tends to appear as the diffusion resistance of a film on the electrode grows (commentary) |
| CPE (constant phase element) | An element used in place of an ideal capacitor. Its exponent n changes its character | n = 1 is an ideal capacitor, n = 0 a resistor, and n = 0.5 is Warburg-likeSourced. Often used to represent roughness and non-uniform current distributionSourced |
Lazanas and Prodromidis [Ref. 1], Magar et al. [Ref. 2], Grieshaber et al. [Ref. 3]. The parts of the right-hand column marked (commentary) are this article's own grouping.
4. Our calculation: where the semicircle peaks, and how long a scan takes
- The shape of the semicircle: Lazanas and Prodromidis derive that on the high-frequency side of the Randles circuit (where the Warburg term is negligible) the Nyquist plot is a circle centred at Rs + Rct/2 with radius Rct/2, and that −Z″ peaks at an angular frequency ω = 1/(Cdl·Rct)Sourced. So with Rs = 100 Ω, Cdl = 1 µF and Rct = 1,000 Ω, the semicircle runs from Z′ = 100 to 1,100 Ω and peaks at f = 1/(2π × 1,000 Ω × 1 µF) ≈ 159 HzOur calculation
- When binding raises Rct: if antibody binding raises Rct to 1,500 Ω, the right-hand end moves to 1,600 Ω and the peak frequency falls to about 106 Hz. The rise in Rct is +500 Ω (+50%)Our calculation
- A lower bound on measurement time: sweeping from 10 kHz to 0.1 Hz (five decades) at 10 points per decade gives 51 points. Even if each point is measured for just one period of the alternating signal, the periods add up to Σ(1/f) ≈ about 49 seconds, of which the lowest-frequency point alone takes 10 secondsOur calculation. Settling time and averaging make real scans longer, so this is a lower bound
Assumptions and limits: Rs, Cdl and Rct are all values assumed in this article; real electrodes can differ by orders of magnitude. How a rise in Rct maps onto the amount bound depends on the sensor design and conditions, and is not discussed here. Teles' review likewise says impedance spectroscopy is time-consuming because it needs a spectrum over a wide frequency region, and that its use in bioanalysis has been restricted mainly to characterisation and as an auxiliary techniqueSourced.
5. Label-free immunosensors: reading binding as a rise in Rct
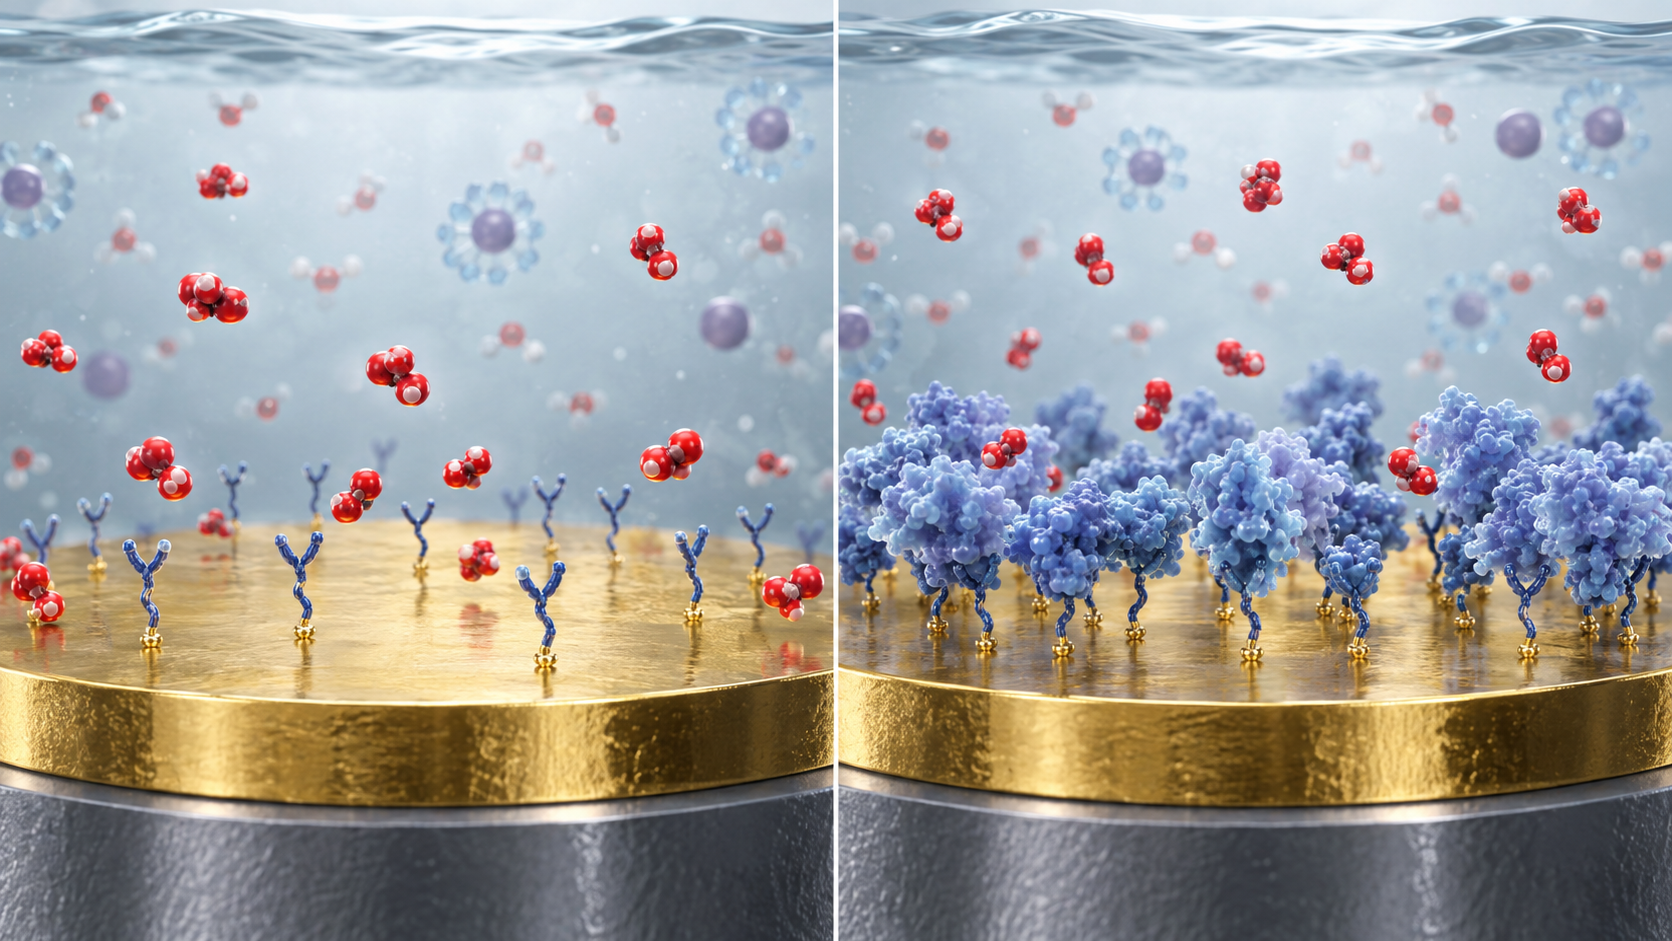
Immobilise an antibody on an electrode and, when the target binds, electron transfer at the surface is hindered and Rct rises. This is the basic idea of an immunosensor that uses Faradaic EIS. Lazanas and Prodromidis explain that a redox probe (an equimolar [Fe(CN)₆]³⁻/⁴⁻ mixture is often used) is added to the solution, the antigen-antibody complex acts as a physical barrier that reduces the flux of the probe, and Rct rises in a concentration-dependent waySourced. Depending on the measuring pH and the isoelectric point (pI) of the biomolecules, the probe flux is also affected by electrostatic attraction or repulsion between the surface and the probeSourced.
View the original SVG schematic, source notes and numerical details
The example in that tutorial is an immunosensor in which a mixed thiol SAM (MUAM and MH) was put on a gold electrode, the antibody was immobilised with glutaraldehyde, and non-specific binding sites were blocked with BSA. Measurements were made in PBS at pH 7 containing 5 mM hexacyanoferrate(II)/(III); adding a bacterial culture sample (initial concentration 10⁶ cfu/mL) raised Rct, while another bacterium (Escherichia coli) gave no responseSourced. This is a proof of principle on culture samples; it does not show performance on real food or clinical samples.
| Reported examples (as introduced in the review by Magar et al.) | Target | Reported detection limit (authors' value) |
|---|---|---|
| Label-free DNA sensor on gold nanoparticle / carbonised glass-fibre electrodes | HIV-1 gene sequence | 13 fM |
| Gold nanoparticle + protein G modified electrode (compared with a planar gold electrode) | Escherichia coli O157:H7 | 48 cfu/mL (planar gold: 140 cfu/mL) |
| Antibody immobilised on amine-functionalised reduced graphene oxide | LDL cholesterol | 5 mg/dL (within 250 s) |
All Sourced (the review text of Magar et al. 2021 [Ref. 2]). The detection limit in each paper may differ in sample (buffer or real sample), statistical definition and units, and we have not checked them here. Do not rank by the size of the numbers. How to read detection limits is covered in our explainer on label-free detection and the limit of detection in this series.
Where adding a redox probe to the solution is awkward, such as on skin or on the body surface, capacitive (non-Faradaic) measurement without a probe is one option. Lazanas et al. note that Faradaic impedimetric biosensors are usually considered more sensitive than capacitive ones, while the capacitive ones can operate without adding reagents, which is attractive for point-of-care useSourced.
6. A materials engineer's view (1): interface materials set Rct
Lazanas and Prodromidis state that the analytical performance of Faradaic impedimetric biosensors depends on the thickness of the sensing layer, the electrocatalytic properties of the base electrode (or modified surface) towards the redox probe, the size of the probe molecule, the density of the recognition layer, blocking of non-specific binding sites, and the accessibility of the target to the surfaceSourced. Nearly all of these are materials-side design variables.
- Make the background small: for a good signal-to-noise ratio it is desirable that electron transfer in the absence of target is easy, giving a narrow semicircle with a very small Rct (low background signal)Sourced. That is because small changes at low concentrations are measured as small changes on top of a small Rct (commentary)
- A mixed SAM contains a "diluent": MUAM (the molecule whose amino end attaches proteins) is mixed with MH so that MH "dilutes" MUAM and reduces steric hindrance. Too much MUAM can lead to antibodies being attached at several points, reducing their flexibility and binding capacitySourced
- Blocking can be too little or too much: non-specific sites are blocked with a protein such as BSA, but excessive coverage also blocks specific binding sites and weakens the response, so it must be carefully optimisedSourced
- Probe size: bulky redox molecules (for example heteropolyacids such as silicotungstic acid) may raise sensitivity, but because the rate at which the probe penetrates the immunocomplex levels off at a lower target concentration, the detection range is expected to be narrowerSourced
In short, how the "foundation film" that carries the antibody is built decides the size of the semicircle and how readable its change is. Carbon and graphene electrode materials are covered in our explainer on graphene and carbon nanotubes, and recognition elements such as aptamers in our aptamer explainer.
7. Impedance of skin and tissue
Impedance is used not only for electrode interfaces but also for measuring skin and tissue. The outermost skin layer, the stratum corneum (SC), is described as roughly 10–40 µm thick on the forearm with about 20% moisture, hydrophobic with narrow transport channels, and showing high impedanceSourced (Lu et al.). Lu et al. say the high impedance from the SC can be measured below 1,000 Hz, and Goyal et al. say the SC accounts for most of the skin impedance in the low-frequency range of 1 Hz to 10 kHzSourced (the papers express the range differently).
- Goyal et al. model the contact between skin and a dry electrode as a series of the resistance of deep tissue, Rd, a parallel combination of the stratum corneum resistance Rsc and capacitor Csc, and a contact capacitance CcSourced
- Assume Rsc = 1 MΩ, Csc = 10 nF and Rd = 1 kΩ. The corner frequency of Rsc‖Csc is 1/(2π × 1 MΩ × 10 nF) ≈ 16 Hz. |Z| is about 850 kΩ at 10 Hz, about 16 kΩ at 1 kHz and falls to about 1 kΩ at 100 kHz (essentially Rd alone)Our calculation
- In the skin phantom of Goyal et al., going from dry to moist changed Rsc from 6.4 to 3.0 MΩ·cm² (about 0.47 times) and Csc from 41 to 190 nF/cm² (about 4.6 times)Sourced. Applying these ratios to the assumed values above lowers |Z| at 10 Hz to about 280 kΩ, about one third of the dry valueOur calculation
Assumptions and limits: this is a simple calculation with assumed values and ideal elements (an ideal capacitor rather than a CPE, and Cc omitted), and it does not match what Goyal et al. report (an overall impedance fall of about one order of magnitude with moisture). All the figure shows is the tendency that the stratum corneum dominates at low frequencies and deep tissue at high frequencies; it is not an estimate of values for human skin.
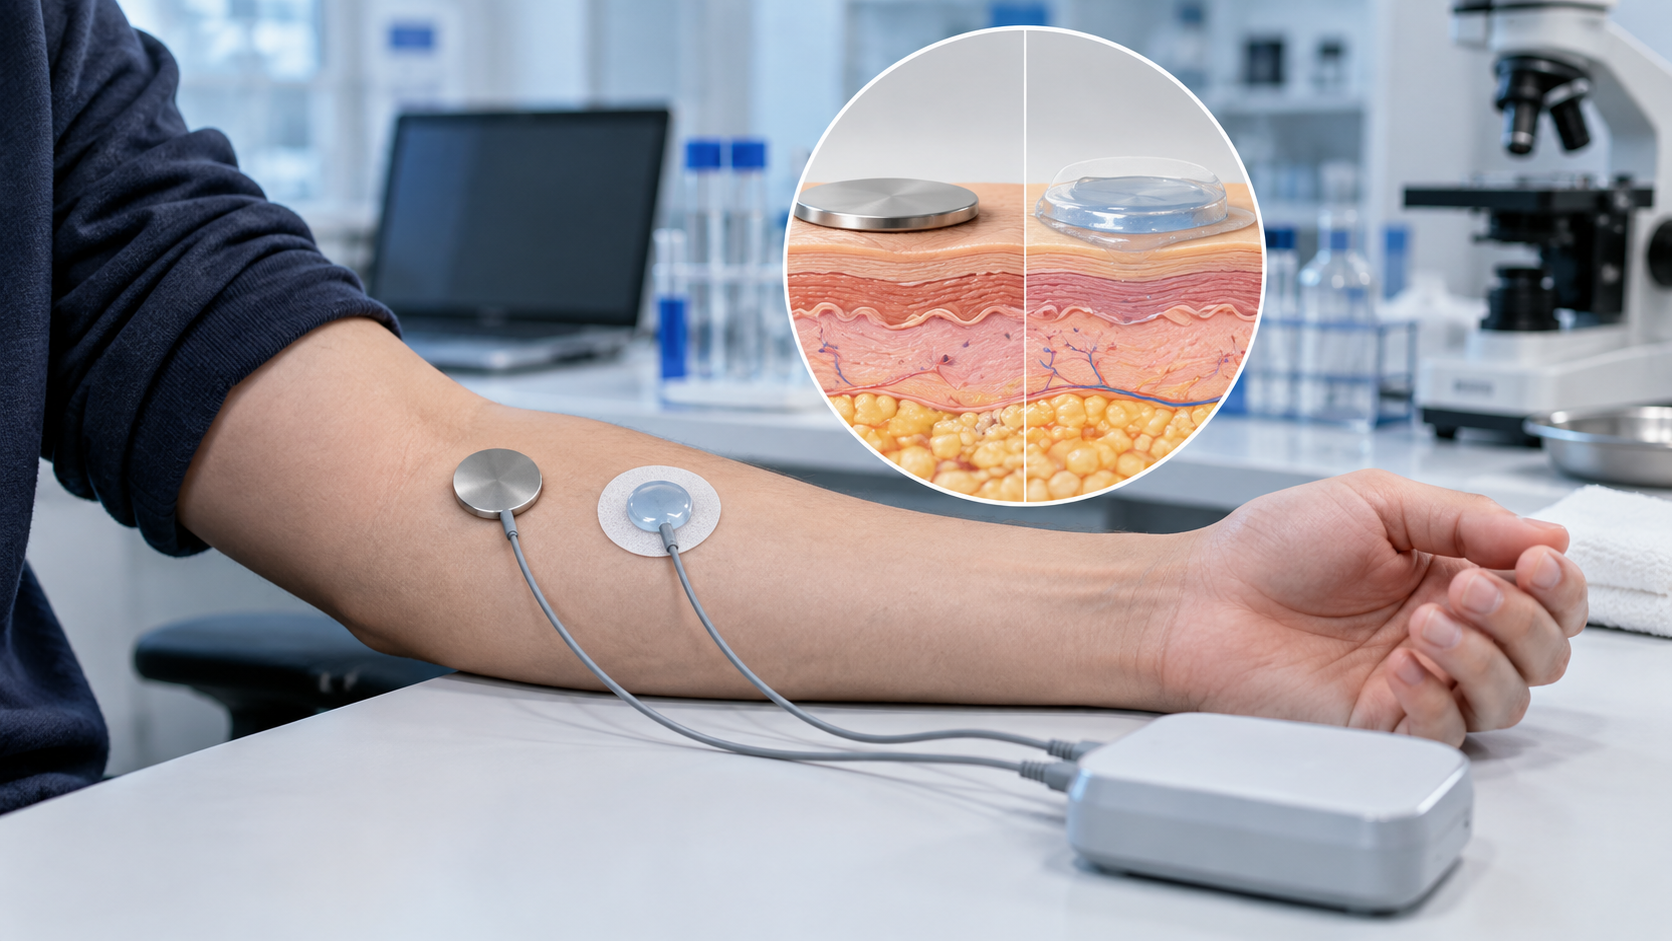
Wet and dry electrodes: each has its drawbacks
According to the review by Lu et al., wet (gelled Ag/AgCl) electrodes are preferred in electrophysiological recording because they are cheap, fit the skin well and conduct well. Their drawbacks are that ions from the gel or electrolyte move into the skin and change its electrical properties, that the stratum corneum becomes over-hydrated, and that over long use sweat and grease accumulate, worsening contact and gel conductivity, so they are suited to single-use, short measurementsSourced. Dry electrodes are mainly metal and behave more like "polarisable" electrodes with a large contact capacitance. Without gel they do not adhere fully to skin, and an air gap acts as a dielectric and greatly increases impedance. The electrode-skin interface impedance depends strongly on pressure and humidity: pressing harder lowers it, and higher humidity raises skin hydration and conductivity. Sweat accumulation also changes the conductivity of the dielectric layer, so allowing enough settling time before measurement is recommendedSourced. Hard electrodes fit skin poorly and produce contact resistance and motion artefacts, so a commonly adopted measure is to use soft substrates (flexible polyimide, PDMS, textiles and so on)Sourced.
In the study by Goyal et al. (funded by the NIH), dry electrodes of stainless steel (SS) and titanium (Ti) were compared on dry and moist skin phantoms and also measured on the thighs of 10 participants. At 10 Hz, the mean area-normalised electrode-skin impedance was 2.68 MΩ·cm² for SS and 2.06 MΩ·cm² for Ti, and a paired t-test showed Ti to be significantly lower (p = 0.032). However, in the five participants above the median Ti was significantly lower, while in the other five there was no significant differenceSourced. These results are limited to the specific electrodes, site and 10 participants, and also show large individual differences.
8. A materials engineer's view (2): at the skin, electrode material, moisture and pressure all matter
Skin-contact impedance changes a great deal not only with the electrode material but also with stratum corneum moisture, contact pressure, sweat and elapsed time. The same metal gives different results on different skin.
- Where contact capacitance comes from: Goyal et al. treat the thin native oxide, the air gap from skin roughness, the stiff metal and the stratum corneum interface together as a "dielectric", giving a contact capacitance Cc, and organise it as depending on the relative permittivity of the material, the oxide thickness and the air gap (which depends on pressure and fit)Sourced. What materials can change is oxide thickness and permittivity, surface roughness and softness (commentary)
- Supplying moisture through the material: because moisture is the largest factor, "semi-dry electrodes", which release a little electrolyte to moisten the stratum corneum locally, are being developed, as Goyal et al. introduceSourced. Materials design is asked to secure moisture while avoiding the problems of gels (drying out, cleaning, irritation) (commentary). Hydrogels are covered in our hydrogel explainer in this series, and adhesion to skin in our explainer on patch sensors and skin adhesion
- Soft substrates: against motion noise and imperfect contact, soft substrates such as polyimide, PDMS and textiles are usedSourced (Lu et al.). Combining softness with conductivity is a materials challenge (commentary)
9. Why interpretation is hard: the order in which to doubt
The biggest difficulty of EIS is not measuring but reading. The same spectrum can lead to different conclusions depending on which equivalent circuit is used and what is taken as the cause. Below, the pitfalls named in published tutorials and reviews are arranged in an "order of doubt".
| Pitfall | What happens | What the sources say |
|---|---|---|
| Equivalent circuits are not unique | For one spectrum there are different circuits that give mathematically identical spectra, and choosing the best circuit takes deep understanding of the electrochemical system. Adding elements always improves the fit, so each element must be tied to an individual physical process by scientific reasoning | Lazanas and ProdromidisSourced |
| Validity of the data itself | Before analysing with an equivalent circuit, check data validity with a Kramers-Kronig (KK) test. A KK transformation would need integration over an infinite frequency range, which is experimentally impossible, so approximate tests are used | Lazanas and ProdromidisSourced |
| The CPE exponent n | Using a CPE instead of an ideal capacitor means n (0 to 1) changes its character. In the skin model of Goyal et al. α = 0.9 was obtained and was interpreted as indicating skin roughness and a non-uniform distribution of time constants. The value of n supports an interpretation but does not identify a cause (commentary) | Lazanas and Prodromidis, Goyal et al.Sourced |
| Non-specific signal changes | EIS biosensors can show non-specific signal changes that are easily mistaken for specific interactions. Blocking with BSA works, but too much blocks specific binding sites too and weakens the response | Lazanas and ProdromidisSourced |
| Challenges common to label-free methods | Challenges originating in the affinity-capture step are shared by all label-free affinity biosensors, and there are further challenges unique to impedance readout | Daniels and PourmandSourced |
| Measurement takes time | A spectrum over a wide frequency range must be recorded, and use in bioanalysis has been restricted mainly to characterisation and auxiliary roles. A market is nevertheless suggested where low cost, portability and speed matter and moderate sensitivity suffices | TelesSourced |
| Electrode placement and mismatch | In bioimpedance measurement, a report found that mismatched potential electrodes caused about 4% overestimation of R₀ and R∞. Artefacts from inaccurate electrode spacing have also been pointed out | Khalil et al. (reports they cite)Sourced |
| Skin: pressure, humidity and time | Electrode-skin interface impedance depends strongly on pressure and humidity, and changes as sweat accumulates. Enough settling time is needed before measurement | Lu et al.Sourced |
| Handling of the redox probe | The probe flux is affected by electrostatic effects of pH and isoelectric point. A bulky probe raises sensitivity but narrows the range | Lazanas and ProdromidisSourced |
Lazanas and Prodromidis [Ref. 1], Goyal et al. [Ref. 4], Lu et al. [Ref. 5], Daniels and Pourmand (abstract) [Ref. 6], Khalil et al. [Ref. 7], Teles [Ref. 8].
Saying anything about an individual's body or disease from a change in impedance is beyond the scope of this article. The "order of doubt" shown here is a way of checking experimental design and analysis; it is not a procedure for diagnosis or health management.
10. Standards, regulation and what we could not confirm
EIS is a measurement technique and does not in itself carry a regulatory category. Whether a sensor or instrument counts as a medical device or an in vitro diagnostic is decided by its intended use (what is measured, and for what purpose). The regulatory position of individual products is covered in our explainer on regulatory pathways for medical devices and home use in this series. Within the scope of this survey, we could not confirm a single international standard that applies to EIS biosensors in general.
For skin electrodes, Goyal et al. write that "FDA guidelines suggest 10 Hz as the reference frequency to validate the performance of recording electrodes"Sourced (as cited in that paper; we did not open the FDA source document ourselves).
Strengths and challenges
- Strengths: it can read interface changes without labels (fluorescent or enzyme tags), is easy to miniaturise and is low in costSourced (Daniels and Pourmand). It can also be a tool for non-invasive examination of skin and tissueSourced (Lu et al.)
- Challenges: uniqueness of interpretation, non-specific signal changes, measurement time, and, on skin, moisture, pressure and individual differences (above)
What we could not confirm
- Definition and sample of each reported detection limit: we did not check the statistical definition of the detection limits introduced by Magar et al., nor whether they were in buffer or real samples.
- An international standard specific to EIS biosensors: not confirmed within the scope of this survey.
- The full text of Daniels and Pourmand: only the abstract was checked, not the full text (the PubMed Central record is not openly full-text).
- The original FDA document for the 10 Hz reference: only the statement as cited by Goyal et al.; the original was not checked.
- Representative impedance values for real human skin: individual, site and condition differences are large, so none are given here. Fig. 3 is illustrative.
- EIS applies a small alternating signal at varying frequencies and reads an interface through its complex impedanceSourced
- The Randles circuit consists of solution resistance Rs, double-layer capacitance Cdl, charge-transfer resistance Rct and the Warburg impedance Zw, and the diameter of the semicircle is RctSourced
- With illustrative values (Rct from 1,000 Ω to 1,500 Ω), the semicircle's peak moves from 159 Hz to 106 Hz and its right-hand end from 1,100 Ω to 1,600 ΩOur calculation
- A label-free immunosensor basically reads binding as a rise in Rct, and performance is decided by interface materials design: mixed SAMs, blocking and probe sizeSourced
- In skin measurements, the stratum corneum dominates at low frequencies and deep tissue at high frequencies, and the result varies greatly with moisture, pressure and electrode materialSourced
- The greatest difficulty is interpretation. After doubting the non-uniqueness of equivalent circuits, non-specific signal changes and measurement time, only the change that remains is treated as a candidate for bindingSourced
11. Glossary
- Impedance Z
- Opposition to alternating current. A complex number combining magnitude and phase shift.
- EIS
- Electrochemical impedance spectroscopy. Measuring impedance while varying frequency.
- Nyquist plot
- A graph with the real part Z′ on the horizontal axis and −Z″ on the vertical. The size of a semicircle represents a resistance.
- Bode plot
- A graph of |Z| and phase angle against frequency.
- Faradaic EIS
- Measurement that includes electron transfer of a redox probe.
- Non-Faradaic EIS
- Measurement of changes in double-layer capacitance without electron transfer.
- Randles circuit
- A basic equivalent circuit made of Rs, Cdl, Rct and Zw.
- Rct
- Charge-transfer resistance. The diameter of the semicircle in a Nyquist plot.
- Cdl
- Electrical double-layer capacitance.
- Warburg impedance
- Impedance representing the difficulty of redox-species diffusion. Appears as a 45° straight line.
- CPE
- Constant phase element. An element representing a non-ideal capacitor. Its exponent n changes its character.
- KK test
- Kramers-Kronig test. Checks whether measured data satisfy the assumptions of linearity, causality and stability.
- SAM
- Self-assembled monolayer. An ordered molecular film formed on gold by thiols.
- Redox probe
- A molecule that is oxidised and reduced at the electrode. Ferri/ferrocyanide is often used.
- Stratum corneum (SC)
- The outermost layer of skin, about 10–40 µm thick (forearm). The main part of skin impedance.
- Wet / dry electrode
- An electrode attached to skin through gel / an electrode attached directly without gel.
- Phantom
- A test material that imitates skin or tissue.
12. References
- Lazanas AC, Prodromidis MI "Electrochemical Impedance Spectroscopy—A Tutorial" ACS Meas Sci Au 2023;3:162–193 — https://pmc.ncbi.nlm.nih.gov/articles/PMC10288619/
- Magar HS, Hassan RYA, Mulchandani A "Electrochemical Impedance Spectroscopy (EIS): Principles, Construction, and Biosensing Applications" Sensors 2021;21:6578 — https://pmc.ncbi.nlm.nih.gov/articles/PMC8512860/
- Grieshaber D, MacKenzie R, Vörös J, Reimhult E "Electrochemical Biosensors – Sensor Principles and Architectures" Sensors 2008;8:1400–1458 — https://pmc.ncbi.nlm.nih.gov/articles/PMC3663003/
- Goyal K, Borkholder DA, Day SW "Dependence of Skin-Electrode Contact Impedance on Material and Skin Hydration" Sensors 2022;22:8510 — https://pmc.ncbi.nlm.nih.gov/articles/PMC9656728/
- Lu F, Wang C, Zhao R, Du L, Fang Z, Guo X, Zhao Z "Review of Stratum Corneum Impedance Measurement in Non-Invasive Penetration Application" Biosensors 2018;8:31 — https://pmc.ncbi.nlm.nih.gov/articles/PMC6023082/
- Daniels JS, Pourmand N "Label-Free Impedance Biosensors: Opportunities and Challenges" Electroanalysis 2007;19:1239–1257 (abstract) — https://pubmed.ncbi.nlm.nih.gov/18176631/
- Khalil SF, Mohktar MS, Ibrahim F "The Theory and Fundamentals of Bioimpedance Analysis in Clinical Status Monitoring and Diagnosis of Diseases" Sensors 2014;14:10895–10928 — https://pmc.ncbi.nlm.nih.gov/articles/PMC4118362/
- Teles FSRR "Biosensors and rapid diagnostic tests on the frontier between analytical and clinical chemistry for biomolecular diagnosis of dengue disease: a review" Anal Chim Acta 2011;687:28–42 — https://pmc.ncbi.nlm.nih.gov/articles/PMC7094386/
- Randles JEB "Kinetics of rapid electrode reactions" Discuss Faraday Soc 1947;1:11–19 (bibliographic record) — https://doi.org/10.1039/df9470100011
13. Claim-to-source audit
| Claim in the text | Basis | Label |
|---|---|---|
| The description of EIS (a small sinusoidal potential is applied and the complex impedance is obtained at varying frequency) and the equations Z(jω) = U(jω)/I(jω), ω = 2πf; the capacitance relation C = εε₀A/d; the distinction between Faradaic EIS (including electron transfer) and non-Faradaic EIS (capacitance); the use of Nyquist and Bode plots; the example measurement conditions (1 mM ferricyanide, 5 mV, 10,000 to 0.1 Hz); and the reported examples (HIV-1 gene 13 fM, E. coli O157:H7 48 cfu/mL versus 140 cfu/mL on planar gold, LDL 5 mg/dL) | Grieshaber et al. and Magar et al. Reference 2 https://pmc.ncbi.nlm.nih.gov/articles/PMC8512860/ Reference 3 https://pmc.ncbi.nlm.nih.gov/articles/PMC3663003/ | Sourced |
| The structure of the Randles circuit (Ru, Cdl, ZF = Rct + Zw); the semicircle centred at Rs + Rct/2 with radius Rct/2 on the high-frequency side and the −Z″ maximum at ω = 1/(Cdl·Rct); the CPE exponent n (n = 1 capacitor, 0 resistor, 0.5 Warburg-like); non-uniqueness of equivalent circuits and the KK test; the rise in Rct in Faradaic immunosensors, redox probes, the effects of pH and pI, mixed SAMs and BSA blocking, bulky probes, non-specific signal changes and the factors governing performance; the immunosensor example (gold electrode, MUAM and MH, glutaraldehyde, BSA, pH 7 PBS, 5 mM hexacyanoferrate, 0.1 to 10⁵ Hz, +0.200 V, 10 mV); and the remark that Faradaic types are more sensitive while capacitive types need no reagents | Lazanas and Prodromidis Reference 1 https://pmc.ncbi.nlm.nih.gov/articles/PMC10288619/ | Sourced |
| That Randles' original paper was published in Discussions of the Faraday Society in 1947 | Bibliographic record Reference 9 https://doi.org/10.1039/df9470100011 | Sourced |
| The model of skin and a dry electrode (Rd, Rsc‖Csc, Cc); the SC accounting for most skin impedance between 1 Hz and 10 kHz; the phantom values for dry and moist states of Rsc and Csc (6.4 to 3.0 MΩ·cm², 41 to 190 nF/cm²); an overall impedance fall of about one order of magnitude with moisture; SS 2.68 and Ti 2.06 MΩ·cm² (10 Hz, 10 participants, p = 0.032) with individual differences; the CPE α = 0.9; semi-dry electrodes; and the FDA 10 Hz reference (as cited) | Goyal et al. Reference 4 https://pmc.ncbi.nlm.nih.gov/articles/PMC9656728/ | Sourced |
| The thickness of the stratum corneum (about 10–40 µm on the forearm), its moisture of about 20%, high SC impedance below 1,000 Hz, the strengths and drawbacks of wet and dry electrodes (ion transfer from gel, over-hydration, sweat and grease, air gap, pressure and humidity, settling time, soft substrates), and four-electrode and two-electrode methods | Lu et al. Reference 5 https://pmc.ncbi.nlm.nih.gov/articles/PMC6023082/ | Sourced |
| That impedance biosensors are low cost, easy to miniaturise and label-free, and that there are challenges common to label-free affinity biosensors as well as challenges unique to impedance | Abstract of Daniels and Pourmand Reference 6 https://pubmed.ncbi.nlm.nih.gov/18176631/ | Sourced |
| A report that mismatched potential electrodes in bioimpedance analysis caused about 4% overestimation of R₀ and R∞, and a note on artefacts from inaccurate electrode spacing | Khalil et al. (reports they cite) Reference 7 https://pmc.ncbi.nlm.nih.gov/articles/PMC4118362/ | Sourced |
| That impedance spectroscopy is time-consuming because of the wide frequency range, that its use in bioanalysis has been limited to characterisation and auxiliary roles, and that a market may exist where low cost, portability and speed matter and moderate sensitivity suffices | Teles Reference 8 https://pmc.ncbi.nlm.nih.gov/articles/PMC7094386/ | Sourced |
| Rs = 100 Ω, Cdl = 1 µF, Rct = 1,000 Ω giving a peak at 159 Hz, Rct = 1,500 Ω giving 106 Hz, the right-hand end moving from 1,100 to 1,600 Ω, and +500 Ω (+50%); a lower bound of about 49 s on the sum of periods for a 10 kHz to 0.1 Hz sweep at 10 points per decade; and, for Rsc = 1 MΩ, Csc = 10 nF and Rd = 1 kΩ, a corner frequency of about 16 Hz and |Z| (about 850 kΩ at 10 Hz, about 16 kΩ at 1 kHz, about 1 kΩ at 100 kHz) and about 280 kΩ at 10 Hz when moist (Rsc x0.47, Csc x4.6), about one third of the dry value | Our calculation. The Randles circuit equations (Lazanas and Prodromidis) and the change ratios of Goyal et al. were combined with values assumed in this article | Our calculation |
| The grouping of "from the electrode and materials side" for each element; the point that the Warburg term tends to appear with membrane diffusion resistance; why a small-background semicircle makes low-concentration changes readable; oxide thickness, permittivity, roughness and softness as variables materials can change; the materials design asked of semi-dry electrodes; the "order of doubt"; and the strengths and challenges | Commentary by this article. A materials-viewpoint rearrangement of the sources | Commentary |
| An international standard applying to EIS biosensors in general, the statistical definition and sample of each reported detection limit, the original FDA document for the 10 Hz reference, and representative impedance values for human skin | Not confirmable from published primary sources within the scope of this survey, so not stated | Commentary |
| That Figs. 1, 2, 3 and 5 are explanatory drawings and not real measurement data or product structures, and that the hero image and Fig. 4 are AI-generated images | Note by this article | Commentary |
Last updated October 2026. Sources are limited to primary material (peer-reviewed tutorials and reviews, abstracts, and the bibliographic record of Randles' original paper). Because the article includes materials-design readings, those are marked as Commentary and kept separate from sourced fact. The statistical definition and sample of each reported detection limit, an international standard specific to EIS biosensors, the original FDA document for the 10 Hz reference, and representative values for human skin are not stated here because no published primary source could be confirmed. The calculations in this article are derived from assumed values and ideal elements and are not measurements from real sensors or human skin. All figures are explanatory concept graphics. Figs. 1, 2, 3 and 5 are vector drawings; the hero image and Fig. 4 are AI-generated images, and none of them shows a real cross-section, micrograph or physical product. This article explains principles, materials and interpretation and is not medical advice.