TECHNOLOGY EXPLAINER
Energy Harvesting
— reading the “output” of elements that generate power from light, heat and vibration together with input and load
To remove battery replacement and wiring, there are technologies that extract tiny amounts of power from ambient light, temperature differences, vibration and human motion. Piezoelectric, triboelectric (TENG), thermoelectric and photovoltaic approaches are studied as power sources for IoT sensors and wearables. This article sets out, from primary sources, how each approach works and what materials it uses, and the conditions to check whenever a “power density” is compared (frequency, acceleration, load, illuminance, temperature difference).
- What energy harvesting is (the short version)
- The overall structure — from energy source to load
- How each approach works, and its materials — piezoelectric, triboelectric, thermoelectric, light
- Read power density against "which input, which load"
- Applications to IoT and wearables
- Our calculations: daily energy, dependence on input, dependence on material conditions
- Limits, and what could not be confirmed
- How to read evaluations and standards
- Glossary
- References (primary sources)
- Claim-to-source audit
Sourced = stated in published material (link given)
Our calculation = a figure this article derived, with the assumptions spelled out
Not yet confirmed = a plan or schedule whose outcome has not been confirmed
Materials-design interpretations are marked separately as Commentary. Inference is shown in bold.
The outputs and power densities here are representative values or laboratory results whose element shape, input (vibration frequency and acceleration, illuminance, temperature difference and so on), load and measurement method differ by source. They are not product specifications and do not show the performance of other elements. Please do not read laboratory champion data as performance under practical conditions. This article does not rank materials or companies, and gives no individual advice on medical devices or safety.
1. What energy harvesting is (the short version)
- It turns tiny ambient energy into electric power: light, temperature differences and vibration or human motion are tapped to run sensors and radios. A paper notes that some IoT communication protocols consume power only in the µW rangeSourced [Ref. 5]
- The character of the output differs greatly by approach: a review sets out solar cells as DC at about 1 V, thermoelectric elements as DC at the mV scale, triboelectric elements as AC pulses at about 102 V and piezoelectric elements at about 101 VSourced [Ref. 1]. Power management has to be designed separately for each
- A “power density” cannot be compared without its conditions: even for one piezoelectric element, the output changes with the acceleration and frequency of vibration and with the load resistance. For triboelectric elements, the number changes with how the surface charge density of the material is measured (the contact partner)Sourced [Ref. 2]
The “output” of a harvester is set not by the element alone but by the combination of input (light, heat, vibration), load and power management. Numbers in µW/cm2 or mW/cm3 mean something only once you check which input, which load, and per which area or volume.
2. The overall structure — from energy source to load
The review by Park et al. sets out that a self-sustaining sensor system using a harvester is designed by combining harvesting, sensing, storage, power management, readout and wireless communicationSourced [Ref. 1]. The energy sources are light, temperature differences, vibration and human motion, converted into electric power by solar cells (PV), thermoelectric generators (TEG), piezoelectric elements, triboelectric elements (TENG), electromagnetic devices and so on.
The review says the design approach divides according to whether the input is continuous or intermittent. Always-on sensing is governed by average-power matching, and event-driven operation by low standby power and the delivery of short bursts of energy [Ref. 1]. Power taken from human motion appears intermittently, only during actions such as walking, tapping and bending, so storage and power management play a large role [Ref. 1].
3. How each approach works, and its materials — piezoelectric, triboelectric, thermoelectric, light
Piezoelectric (vibration)
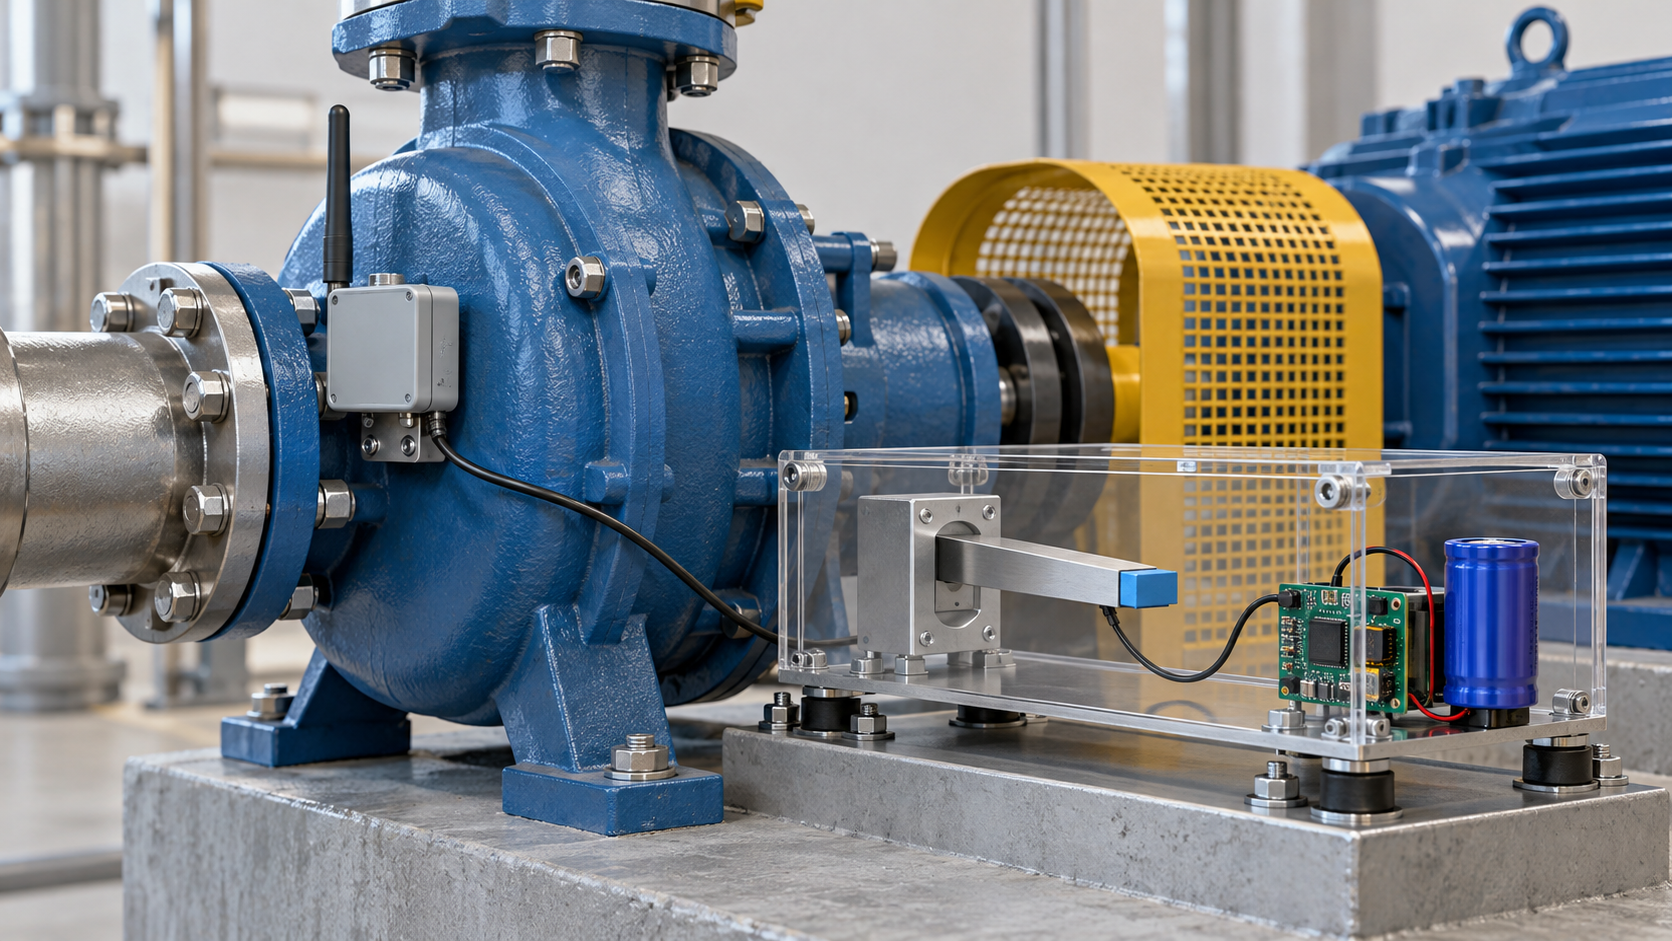
The review by Beeby et al. sets out that most generators that turn vibration into power are inertial spring-mass systems, with three ways of extracting energy: piezoelectric, electromagnetic and electrostaticSourced [Ref. 4]. Safaei et al. state that piezoelectric transducers, with their inherent electromechanical coupling and a power density higher than electromagnetic and electrostatic transducers, have been widely explored [Ref. 3]. However, another review says that the frequency bandwidth of a linear piezoelectric harvester is very narrow, while vibration sources are often random and broadband [Ref. 7]. The sources of vibration include human motion, bridges, industrial equipment, vehicles and household appliances [Ref. 7]. For the piezoelectric constants of the materials and the lead-free issue, see our explainer on piezoelectric materials and lead-free alternatives.
Triboelectric (TENG)
A triboelectric element generates power by combining triboelectrification from contact and separation or sliding with electrostatic induction. Zi et al. state that there are four basic operating modes (vertical contact-separation, lateral sliding, single-electrode and freestanding triboelectric layer), each with its own structure and mechanical triggering conditions, so a common standard is needed to compare performanceSourced [Ref. 2]. The proposed performance index is the product of a structural index and a material index, the square of the surface charge density σ [Ref. 2]. The output power also depends on the load resistance [Ref. 2].
How σ is measured affects any comparison of materials. Zi et al. note that in solid-solid contact the surface roughness prevents intimate contact, so the measured σ falls short of its maximum, and they proposed a standard measurement that uses a liquid metal (gallium or galinstan) as the contact partner. For FEP, σ was 133.24 µC/m2 against galinstan and 218.64 µC/m2 against liquid gallium, so the number changes with the partner. The measurements were made in an argon glove box at room temperature, 1 atm and 0.006% relative humidity [Ref. 2]. The triboelectric order from their measurements was FEP (most negative), Kapton, PVDF, PE, natural rubber, galinstan and cellulose (most positive) [Ref. 2].
Thermoelectric
A thermoelectric element gives a DC voltage from a temperature difference. The table of the review says the voltage of one unit is at the mV scale and that low-voltage boosting, impedance matching and management of thermal contact are the issuesSourced [Ref. 1]. The ZT of a material, and the difference between element and material, are covered in our explainer on thermoelectric materials. ISO 24687:2023 specifies a method for measuring the Seebeck coefficient and electrical conductivity of bulk thermoelectric materials together from 300 K to 1,200 K, for materials used in power generation, energy harvesting, cooling and heating [Ref. 12].
Light (solar cells)
Indoor light differs from outdoor sunlight: its spectrum from LEDs and fluorescent lamps is limited to the visible range (380–780 nm), and the illuminance is generally 200–1,000 luxSourced [Ref. 5]. The same paper says that common silicon, CdTe and CIGS cells perform poorly under these conditions, that materials with a band gap near 1.7–1.9 eV (perovskites and others) have a high efficiency limit (about 56%), and it reports a perovskite indoor module with fewer bromine vacancies that reached a certified efficiency of 36.36% at 1,000 lux under TL84 [Ref. 5]. The review by Mathews et al. states that indoor solar cells can power the distributed sensors, actuators and communication devices of the IoT [Ref. 6].
In the review’s summary, a solar cell gives DC at about 1 V, a thermoelectric element DC at the mV scale, a piezoelectric element AC pulses at about 101 V and a triboelectric element AC pulses at about 102 VSourced [Ref. 1]. Even for the same “1 µW”, the boosting, rectification and impedance matching required are completely different depending on whether the voltage is mV or 100 V, and whether it is continuous or intermittent. From a materials viewpoint, optimizing a material includes not only the size of the output but whether the output impedance and the shape of the voltage suit the power-management circuit. For example, from the orders of magnitude of voltage in the review one can read that a triboelectric element has high voltage and small current (high output impedance), and a thermoelectric element low voltage and comparatively large current (low internal resistance) (this article’s commentary). That output depends on the load resistance is also shown in the evaluation of TENGs [Ref. 2].
4. Read power density against “which input, which load”
The review by Park et al. summarizes representative power densities for each approach in the table below. The review notes that these are “representative values obtained under different device geometries and operating conditions, intended to indicate characteristic output scales rather than a direct performance ranking among mechanisms”Sourced [Ref. 1].
| Approach | Input condition | Representative power density (per area) | Power-management points (review) |
|---|---|---|---|
| Solar cell | Indoor / outdoor light | 10–100 µW/cm2 (indoor), 10–30 mW/cm2 (outdoor) | Voltage regulation and storage under changing illumination |
| Thermoelectric | Wearable / industrial | 10–100 µW/cm2 (wearable), 10–1000 mW/cm2 (industrial) | Boosting of low voltage, impedance matching, thermal-interface management |
| Triboelectric | Low / high frequency | 1–10 µW/cm2 (low frequency), 1–10 mW/cm2 (high frequency) | Rectification, charge management, temporary storage |
| Piezoelectric | Low / high stress | 0.1–1 µW/cm2 (low stress), 1–10 mW/cm2 (high stress) | Rectification and buffer storage for transient inputs |
All Sourced (table in the review by Park et al. [Ref. 1]). The division of input conditions (indoor and outdoor, low and high frequency and so on) differs by approach, so even a single row is not a comparison under the same input.
Even for one piezoelectric element, the output changes with the frequency and acceleration of vibration and with the load resistance. IEC 62830-1 is a standard that defines terms, symbols, configurations and test methods for vibration-based piezoelectric harvesters, without limits on application or element sizeSourced [Ref. 10]. ISO 5712:2022 specifies a method for measuring, for piezoelectric resonant devices used as self-sustaining power sources, the output power, mechanical quality factor, electromechanical coupling factor and output efficiency [Ref. 9]. So a comparison needs these quantities and the vibration conditions to be aligned.
Also, power per area (µW/cm2) and power per volume (µW/cm3) cannot be converted into each other. Ylli et al., who studied electromagnetic generators for a shoe sole, report an average output of up to 0.84 mW for a swing-type generator, 40 µW/cm3 for a total volume of 21 cm3, and up to 4.13 mW for a shock-type generator, 86 µW/cm3 for a total volume of 48 cm3 (treadmill, two test subjects, motion speeds varied)Sourced [Ref. 8]. The denominator here is the “total volume including the housing”, a different quantity from the per-area values in the table.
The performance index of a TENG is proportional to the square of the surface charge density σSourced [Ref. 2]. Yet σ itself changes with the contact partner (galinstan, liquid gallium or a solid metal), the environment (humidity) and the intimacy of contact (surface roughness) [Ref. 2]. The σ of FEP went from 133.24 to 218.64 µC/m2 just by changing the partner. The ratio is 1.64, and as a ratio of σ2 it is about 2.7 (calculated in Chapter 6). From a materials viewpoint, the ranking of materials that “electrify easily” can be compared only when the σ against the same partner is aligned. The same holds for piezoelectric materials: d33 differs for sintered bodies, single crystals and thin films, and g depends on permittivity (see our explainer on piezoelectric materials and lead-free alternatives).
5. Applications to IoT and wearables
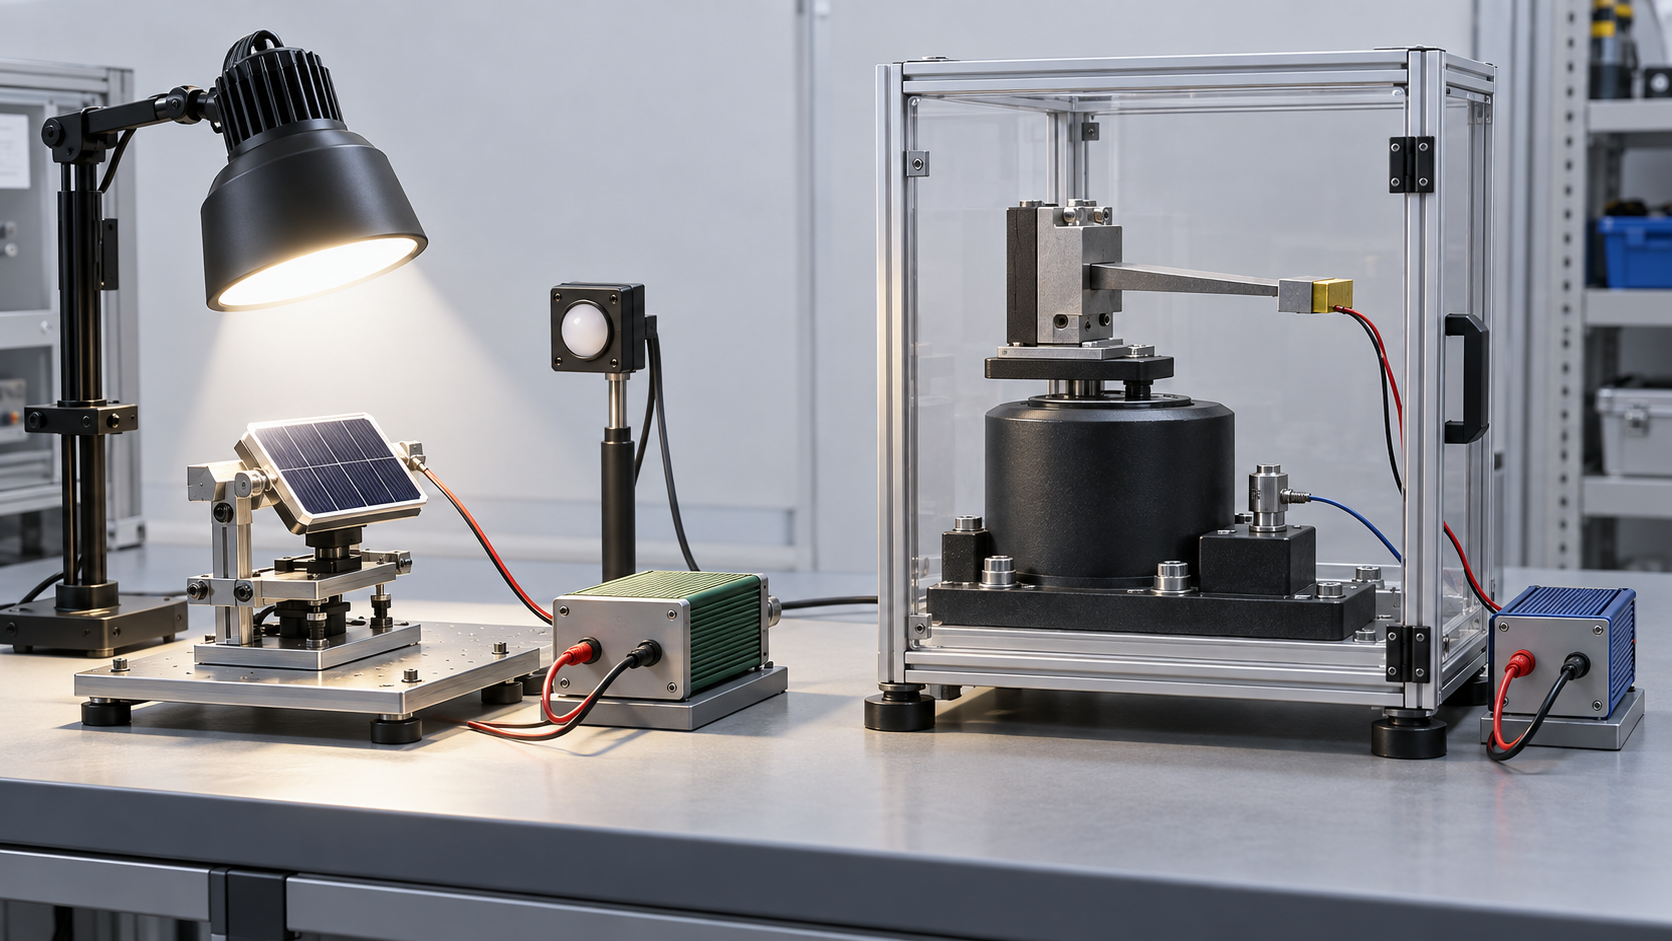
Zhang et al. say that some IoT communication protocols on certain chips consume power in the µW range, the same order as the light power reaching less than one square centimetre under ordinary indoor illuminationSourced [Ref. 5]. Mathews et al. also say that indoor solar cells can power distributed sensors and communication devices [Ref. 6].
For wearables, thermoelectric elements using body heat and piezoelectric, triboelectric and electromagnetic elements using motion are being considered. The review introduces an example of a wearable system that combines a body-heat thermoelectric element, energy-management electronics, and a sensor with Bluetooth Low Energy radio, and notes that power taken from intermittent motion such as walking, tapping and bending must be redistributed over time by storage and power managementSourced [Ref. 1]. Starner sets out the possibility of using the energy spent in everyday actions (walking, breathing, blood pressure, body heat, finger and limb motion) to power a computer [Ref. 25].
Elements built into fabrics and films (conductive yarns, sensors, washing durability, the skin interface) are covered in our explainer on smart textiles and wearable materials.
6. Our calculations: daily energy, dependence on input, dependence on material conditions
(1) The daily energy of a 1 cm2 element
We multiply the representative values of the review’s table [Ref. 1] by 86,400 s to get the daily energy if the element ran for 24 hoursOur calculation. One measurement and transmission is assumed to cost 100 µJ (an example).
- Solar cell (indoor light) and thermoelectric (wearable): 10–100 µW/cm2 → 0.864–8.64 J/cm2 per day → about 8,640–86,400 messages per day
- Triboelectric (low frequency): 1–10 µW/cm2 → 0.0864–0.864 J/cm2 per day → about 864–8,640 messages per day
- Piezoelectric (low stress): 0.1–1 µW/cm2 → 0.00864–0.0864 J/cm2 per day → about 86–864 messages per day
Assumptions and limits: this is an upper bound under the strong assumptions of 24 hours of continuous operation and zero loss in conversion, storage and power management. Neither indoor lighting nor body motion lasts 24 hours. The 100 µJ is our example and not a value for any product. The representative power densities summarize reports under differing conditions, so this calculation is not a prediction of any element’s performance. Even so, the table’s representative values show that for the same 1 cm2, the number of messages that can be sent differs by three orders of magnitude or more depending on approach and input.
(2) The energy of a shoe-sole generator over one hour of walking
Assume the maximum average output of Ylli et al. [Ref. 8] is obtained continuously for one hour (3,600 s)Our calculation. The swing type gives 0.84 mW × 3,600 s = about 3.0 J, and the shock type 4.13 mW × 3,600 s = about 14.9 J. At 100 µJ per measurement and transmission, this corresponds to about 30,000 and about 149,000 messages. Per volume, 0.84 ÷ 21 = 40 µW/cm3 and 4.13 ÷ 48 = about 86 µW/cm3, matching the paper.
Assumptions and limits: the “maximum average output” is an upper bound for particular subjects and speeds on a treadmill and does not represent everyday walking. The assumptions of walking for one hour and of zero loss are both strong. The elements are electromagnetic and do not give values for piezoelectric or triboelectric elements.
(3) How much the output changes when an input or material condition changes a little
For a resonant vibration harvester, with the same mass, damping, resonance frequency and load, the output is taken to be proportional to the square of the acceleration (commentary). At 0.5 times the acceleration the output is 0.25 times, and at 0.25 times it is 0.0625 timesOur calculation.
For a TENG, the performance index is proportional to σ2 [Ref. 2]. If the σ of FEP is measured against galinstan (133.24 µC/m2) rather than liquid gallium (218.64 µC/m2), the ratio of σ is 133.24 ÷ 218.64 = 0.61 and its square is 0.37Our calculation. Seen the other way, the σ against liquid gallium is about 1.64 times that against galinstan, which is about 2.7 times in σ2.
Assumptions and limits: the resonant relation is a general proportionality in a linear model of an inertial generator, and we did not check the text of the source of the formula. A real element is nonlinear, and both its resonance frequency and the input frequency shift. The TENG ratio takes only the material term out of the definition of Zi et al. (structural index × σ2) and can be used only to compare elements of the same structure. Because σ changes with the partner it is measured against, do not compare values of σ measured against different partners in one table.
7. Limits, and what could not be confirmed
(1) Texts of the standards
We have not checked the texts of ISO 5712, ISO 24687, the parts of IEC 62830, IEC 62047-28, IEC TS 62607-7-2, JIS R 1762, JIS C 5630-28 and JIS R 1650 (we checked the titles and scopes shown on the IEC Webstore, ISO and JSA pages). Test conditions, procedures and acceptance criteria are not given.
(2) Representative power densities
The table in Chapter 4 gives the review’s representative values, and we did not check the conditions (frequency, acceleration, load, temperature difference, illuminance) in each original paper. The review itself notes that it is not a ranking.
(3) The formula for resonant generation
The relation that resonant output is proportional to the square of acceleration is commentary based on a general linear model, and we did not check the texts of formulas such as that of Williams and Yates.
(4) Standards for thermoelectric, indoor-light and TENG evaluation
We could not confirm an ISO, JIS or ASTM standard defining the evaluation of TENGs in the range searched (we did confirm IEC 62830-6 and -7). We also could not confirm a JIS limited to indoor light. We could not find an applicable ASTM standard (the ASTM site was not opened).
(5) Evaluation as a practical power source
We did not address the efficiency of real power-management circuits, leakage of storage elements, measured power of radios or product life. Public statistics on market size and product shipments could not be confirmed, so none are given.
- A harvester’s output is set by the combination of element, input, load and power management. The review’s representative values span more than six orders of magnitude, from µW/cm2 to mW/cm2, across light, heat, triboelectric and piezoelectric, and are not a rankingSourced
- The “shape” of the output differs by approach. About 1 V DC (solar), mV-scale (thermoelectric), and AC pulses of about 101–102 V (piezoelectric, triboelectric)Sourced
- Material indices are conditional too. The TENG index is proportional to σ2, and the σ of FEP is 133.24 or 218.64 µC/m2 depending on the partnerSourced / Our calculation
- What 1 cm2 can supply in a day differs by three orders of magnitude or more by approach and input. 8,640–86,400 messages per day for indoor light and wearable thermoelectric (assuming 100 µJ) and 86–864 per day for piezoelectric (low stress)Our calculation
- Evaluation standards are being built up. IEC 62830 covers piezoelectric, thermoelectric, electromagnetic and triboelectric devices, ISO 5712 and JIS R 1762 the generation of piezoelectric resonant devices, and there is also IEC TS 62607-7-2 for indoor lightSourced
8. How to read evaluations and standards
The performance of a harvester is measured through these quantities: the power generated (with the load resistance and the input conditions), the waveform of voltage and current, energy conversion efficiency, for resonant devices the resonance frequency, mechanical quality factor and coupling factor, for triboelectric devices the surface charge density and the V–Q cycle, for thermoelectric devices the Seebeck coefficient, electrical conductivity and output per temperature difference, and for solar cells an efficiency at a defined illuminance and spectrum. Since 2017 IEC has built up a series of evaluation standards for semiconductor devices (IEC 62830), and ISO/TC 206 and Japan’s JIS have a standard for the power generation of piezoelectric resonant devices.
| Item evaluated | ISO | IEC / IEEE | JIS | ASTM | What changes the value |
|---|---|---|---|---|---|
| Power generation of piezoelectric resonant devices (vibration) Sourced | ISO 5712:2022, “Fine ceramics (advanced ceramics, advanced technical ceramics) — Method for measuring the power generation characteristics of piezoelectric resonant devices for stand-alone power sources” (Edition 1, May 2022; evaluates output power, mechanical quality factor, electromechanical coupling factor and output efficiency) [Ref. 9] | IEC 62830-1:2017, “Semiconductor devices – Semiconductor devices for energy harvesting and generation – Part 1: Vibration based piezoelectric energy harvesting” (Edition 1, 3 March 2017) [Ref. 10] | JIS R 1762:2020, fine ceramics — method for measuring power generation characteristics of piezoelectric devices for stand-alone power sources (title translated by us) [Ref. 21] | Could not be confirmed | Vibration frequency and acceleration, load resistance, resonance bandwidth |
| Flexible piezoelectric harvesters Sourced | Could not be confirmed | IEC 62830-4:2019, “…Part 4: Test and evaluation methods for flexible piezoelectric energy harvesting devices” (Edition 1, 27 February 2019; wearables are among the targets) [Ref. 16] | Could not be confirmed | Could not be confirmed | Bending conditions, speed of deformation, load |
| Triboelectric harvesters (TENG) Sourced | Could not be confirmed | IEC 62830-6:2019, “…Part 6: Test and evaluation methods for vertical contact mode triboelectric energy harvesting devices” (Edition 1, 25 July 2019) [Ref. 17] IEC 62830-7:2021, “…Part 7: Linear sliding mode triboelectric energy harvesting” (Edition 1, 3 March 2021) [Ref. 18] | Could not be confirmed | Could not be confirmed | Operating mode, load resistance, operating frequency, surface charge density (contact partner, humidity) [Ref. 2] |
| Electromagnetic and MEMS electret types Sourced | Could not be confirmed | IEC 62830-3:2017, “…Part 3: Vibration based electromagnetic energy harvesting” [Ref. 15] IEC 62047-28:2017, “Semiconductor devices – Micro-electromechanical devices – Part 28: Performance testing method of vibration-driven MEMS electret energy harvesting devices” (Edition 1, 20 January 2017) [Ref. 19] | JIS C 5630-28:2020, Micromachines and MEMS — Part 28: Performance testing method of vibration-driven MEMS electret energy harvesting devices (title translated by us). Identical (IDT) to IEC 62047-28:2017 [Ref. 20] | Could not be confirmed | Vibration conditions, electrode gap, load |
| Thermoelectric (power generation and materials) Sourced | ISO 24687:2023, “Fine ceramics (advanced ceramics, advanced technical ceramics) — Measurement of Seebeck coefficient and electrical conductivity of bulk-type thermoelectric materials at room and high temperatures” (Edition 1, April 2023; 300 K to 1,200 K) [Ref. 12] | IEC 62830-2:2017, “…Part 2: Thermo power based thermoelectric energy harvesting” (thermopower of thin films; 20 January 2017) [Ref. 14] IEC 62830-5:2021, “…Part 5: Test method for measuring generated power from flexible thermoelectric devices” (21 January 2021) [Ref. 13] | JIS R 1650-1:2002 (thermoelectric power), -2:2002 (resistivity) and -3:2002 (thermal diffusivity, specific heat capacity and thermal conductivity); the series title is measuring methods for thermoelectric materials of fine ceramics (translated by us) [Refs. 22, 23, 24] | Could not be confirmed | Temperature difference, hot-side and cold-side temperatures, thermal contact resistance. Material and device are different (see our explainer on thermoelectric materials) |
| Solar cells under indoor light Sourced | Could not be confirmed | IEC TS 62607-7-2:2023, “Nanomanufacturing – Key control characteristics – Part 7-2: Nano-enabled photovoltaics – Device evaluation method for indoor light” (Edition 1 technical specification, 27 July 2023; efficiency testing of cells other than multi-junction under indoor light) [Ref. 11] | Could not be confirmed (we found no JIS limited to indoor light) | Could not be confirmed | Illuminance (lux), light-source spectrum, colour temperature. A paper noted that a standardized evaluation method for indoor efficiency was still under development (2022) [Ref. 5] |
| Summary (our own) Our calculation | How the standards are positioned: for piezoelectric resonant devices there are three, ISO 5712 (2022), IEC 62830-1 (2017) and JIS R 1762 (2020); JIS was established earlier than ISO, and no corresponding international standard was shown on JSA’s page. For MEMS electrets, IEC 62047-28 and JIS C 5630-28 are identical. For triboelectric devices there are only the IEC standards 62830-6 and -7, and we could not confirm an ISO, JIS or ASTM standard. For indoor-light efficiency, an IEC TS was issued in 2023, the year after a paper said the evaluation method was still under development. Standards exist to align the “conditions” of an evaluation, not to decide which number is better. | ||||
Because the texts are paid, we keep to number, title, edition, date and scope. ASTM International’s site states that AI use is not permitted, so we did not open it. We found no applicable ASTM standard in the non-ASTM sources searched (IEC, ISO, JIS, papers).
Notes on reading standards
- A standard is a test method, not a guarantee of element performance. IEC 62830 sets the terms, symbols, configurations and test methods used for evaluation. Even a value measured according to the standard is a different value if the frequency, acceleration and load of vibration differ
- The same quantity name has different standards and methods by approach. Piezoelectric resonant devices (ISO 5712, IEC 62830-1), flexible piezoelectric (IEC 62830-4), triboelectric (IEC 62830-6, -7) and thermoelectric (IEC 62830-2, -5, ISO 24687) fall under different standards, and their output numbers cannot be compared directly
- Read a manufacturer’s or paper’s value together with the standard, edition and conditions. An indoor-light efficiency means something only when illuminance and source spectrum are fixed, and the certified value at 1,000 lux under TL84 [Ref. 5] differs from values for other sources and illuminances
- Material indices (σ, ZT, d33) and element output are different quantities. Most of the standards evaluate elements and devices and do not decide the merit of a material directly. An element’s output also depends on structure, load and power management (this article’s commentary)
9. Glossary
- Energy harvesting
- Technology that turns ambient light, heat and vibration into tiny amounts of electric power.
- PV / TEG / PENG / TENG
- Solar cell / thermoelectric generator / piezoelectric generator / triboelectric generator.
- Power density
- Output per area or per volume of an element. Different units cannot be converted.
- Load resistance
- The resistance of the load connected to the element; the output depends on it.
- Resonant type
- A type that matches the natural frequency of the element to the input frequency; the bandwidth is narrow.
- Surface charge density σ
- The areal density of charge on a surface after triboelectrification; the material index of a TENG.
- V–Q cycle
- A curve of voltage against transferred charge over one cycle; it represents the output energy of a TENG.
- Seebeck coefficient
- The voltage produced per unit temperature difference; a basic quantity of thermoelectric materials.
- Illuminance (lux)
- A measure of the brightness of light; indoor-light efficiency depends on illuminance and spectrum.
- Always-on / event-driven sensing
- Measuring continuously / operating only when an event occurs; the idea of power matching differs.
- Power management
- Circuits that adapt the element’s output to the load: rectification, boosting, matching and storage.
10. References (primary sources)
- Park T. et al. “Self-Sustaining Sensing Systems: Integration Strategies and Signal–Power Matching in Energy-Harvesting Electronics”, Adv. Sci. e77712 (2026), DOI 10.1002/advs.77712 (open access) — doi.org/10.1002/advs.77712
- Zi Y. et al. “Standards and figure-of-merits for quantifying the performance of triboelectric nanogenerators”, Nat. Commun. 6, 8376 (2015), DOI 10.1038/ncomms9376 (open access) — doi.org/10.1038/ncomms9376
- Safaei M. et al. “A review of energy harvesting using piezoelectric materials: state-of-the-art a decade later (2008–2018)”, Smart Mater. Struct. 28, 113001 (2019), DOI 10.1088/1361-665X/ab36e4 — doi.org/10.1088/1361-665X/ab36e4
- Beeby S. P. et al. “Energy harvesting vibration sources for microsystems applications”, Meas. Sci. Technol. 17, R175–R195 (2006), DOI 10.1088/0957-0233/17/12/R01 — doi.org/10.1088/0957-0233/17/12/R01
- Zhang C. et al. “Br Vacancy Defects Healed Perovskite Indoor Photovoltaic Modules with Certified Power Conversion Efficiency Exceeding 36%”, Adv. Sci. 9, 2204138 (2022), DOI 10.1002/advs.202204138 (open access) — doi.org/10.1002/advs.202204138
- Mathews I. et al. “Technology and Market Perspective for Indoor Photovoltaic Cells”, Joule 3, 1415–1426 (2019), DOI 10.1016/j.joule.2019.03.026 — doi.org/10.1016/j.joule.2019.03.026
- Jiang X. et al. “A Review of Piezoelectric Vibration Energy Harvesting with Magnetic Coupling Based on Different Structural Characteristics”, Micromachines 12, 436 (2021), DOI 10.3390/mi12040436 (open access) — doi.org/10.3390/mi12040436
- Ylli K. et al. “Energy harvesting from human motion: exploiting swing and shock excitations”, Smart Mater. Struct. 24, 025029 (2015), DOI 10.1088/0964-1726/24/2/025029 — doi.org/10.1088/0964-1726/24/2/025029
- International Organization for Standardization (ISO) “ISO 5712:2022 Fine ceramics (advanced ceramics, advanced technical ceramics) — Method for measuring the power generation characteristics of piezoelectric resonant devices for stand-alone power sources” (ISO page) — iso.org/standard/81569.html
- International Electrotechnical Commission (IEC) “IEC 62830-1:2017” product page (IEC Webstore) — webstore.iec.ch/en/publication/27039
- International Electrotechnical Commission (IEC) “IEC TS 62607-7-2:2023” product page (IEC Webstore) — webstore.iec.ch/en/publication/61819
- International Organization for Standardization (ISO) “ISO 24687:2023 Fine ceramics (advanced ceramics, advanced technical ceramics) — Measurement of Seebeck coefficient and electrical conductivity of bulk-type thermoelectric materials at room and high temperatures” (ISO page) — iso.org/standard/80856.html
- International Electrotechnical Commission (IEC) “IEC 62830-5:2021” product page (IEC Webstore) — webstore.iec.ch/en/publication/26500
- International Electrotechnical Commission (IEC) “IEC 62830-2:2017” product page (IEC Webstore) — webstore.iec.ch/en/publication/30355
- International Electrotechnical Commission (IEC) “IEC 62830-3:2017” product page (IEC Webstore) — webstore.iec.ch/en/publication/30924
- International Electrotechnical Commission (IEC) “IEC 62830-4:2019” product page (IEC Webstore) — webstore.iec.ch/en/publication/26798
- International Electrotechnical Commission (IEC) “IEC 62830-6:2019” product page (IEC Webstore) — webstore.iec.ch/en/publication/60105
- International Electrotechnical Commission (IEC) “IEC 62830-7:2021” product page (IEC Webstore) — webstore.iec.ch/en/publication/62444
- International Electrotechnical Commission (IEC) “IEC 62047-28:2017” product page (IEC Webstore) — webstore.iec.ch/en/publication/30684
- Japanese Standards Association (JSA) “JIS C 5630-28:2020” standard page (JSA Webdesk; title in Japanese: Micromachines and MEMS — Part 28: Performance testing method of vibration-driven MEMS electret energy harvesting devices; identical to IEC 62047-28:2017) — webdesk.jsa.or.jp/…bunsyo_id=JIS+C+5630-28:2020
- Japanese Standards Association (JSA) “JIS R 1762:2020” standard page (JSA Webdesk; title in Japanese: Fine ceramics — Method for measuring power generation characteristics of piezoelectric devices for stand-alone power sources) — webdesk.jsa.or.jp/…bunsyo_id=JIS+R+1762:2020
- Japanese Standards Association (JSA) “JIS R 1650-1:2002” standard page (JSA Webdesk; title in Japanese: Measuring methods for thermoelectric materials of fine ceramics — Part 1: Thermoelectric power) — webdesk.jsa.or.jp/…bunsyo_id=JIS+R+1650-1:2002
- Japanese Standards Association (JSA) “JIS R 1650-2:2002” standard page (JSA Webdesk; title in Japanese: … Part 2: Electrical resistivity) — webdesk.jsa.or.jp/…bunsyo_id=JIS+R+1650-2:2002
- Japanese Standards Association (JSA) “JIS R 1650-3:2002” standard page (JSA Webdesk; title in Japanese: … Part 3: Thermal diffusivity, specific heat capacity and thermal conductivity) — webdesk.jsa.or.jp/…bunsyo_id=JIS+R+1650-3:2002
- Starner T. “Human-powered wearable computing”, IBM Syst. J. 35, 618–629 (1996), DOI 10.1147/sj.353.0618 — doi.org/10.1147/sj.353.0618
11. Claim-to-source audit
| Claim in the text | Basis | Type |
|---|---|---|
| A design that combines harvesting, sensing, storage, power management, readout and radio; always-on sensing as average-power matching and event-driven sensing as low standby power plus short bursts; intermittent motion (walking, tapping, bending) and storage; the example of a body-heat thermoelectric system with BLE; the character of each output (solar cell about 1 V DC, thermoelectric mV-scale DC, triboelectric AC pulses of about 10² V, piezoelectric AC pulses of about 10¹ V); the table of representative power densities (solar cell indoor 10–100 µW/cm², outdoor 10–30 mW/cm²; thermoelectric wearable 10–100 µW/cm², industrial 10–1000 mW/cm²; triboelectric low frequency 1–10 µW/cm², high frequency 1–10 mW/cm²; piezoelectric low stress 0.1–1 µW/cm², high stress 1–10 mW/cm²) and the note that it is not a ranking; points of power management | Review by Park et al. (2026) Reference 1 https://doi.org/10.1002/advs.77712 | Sourced |
| The four operating modes of TENGs; performance index = structural index × σ²; the dependence of output power on load resistance; the standard measurement of σ with liquid metals; σ of FEP (133.24 µC/m² against galinstan, 218.64 µC/m² against liquid gallium); measurement conditions (argon glove box, room temperature, 1 atm, 0.006% relative humidity); the triboelectric order | Zi et al. (2015) Reference 2 https://doi.org/10.1038/ncomms9376 | Sourced |
| Piezoelectric elements have been widely explored for their high electromechanical coupling and a power density higher than electromagnetic and electrostatic transducers | Abstract of Safaei et al. (2019) Reference 3 https://doi.org/10.1088/1361-665X/ab36e4 | Sourced |
| Most vibration generators are inertial spring-mass systems with three ways of extraction (piezoelectric, electromagnetic, electrostatic); characteristic equations exist for inertial generators | Abstract of Beeby et al. (2006) Reference 4 https://doi.org/10.1088/0957-0233/17/12/R01 | Sourced |
| Some IoT protocols consume power in the µW range; indoor illuminance of 200–1000 lux; visible-only spectra; an ideal band gap of 1.7–1.9 eV and an efficiency limit of about 56%; common silicon, CdTe and CIGS cells perform poorly under indoor light; a certified efficiency of 36.36% (module) at 1000 lux, TL84; the statement that standardized indoor evaluation methods were still under development | Zhang et al. (2022) Reference 5 https://doi.org/10.1002/advs.202204138 | Sourced |
| Indoor solar cells can power distributed sensors, actuators and communication devices of the IoT | Abstract of Mathews et al. (2019) Reference 6 https://doi.org/10.1016/j.joule.2019.03.026 | Sourced |
| The frequency bandwidth of linear piezoelectric harvesters is very narrow while vibration sources are random and broadband; examples of vibration sources (human motion, bridges, industrial equipment, vehicles, household appliances) | Jiang et al. (2021) Reference 7 https://doi.org/10.3390/mi12040436 | Sourced |
| Shoe-sole electromagnetic generators: swing type with up to 0.84 mW average, 21 cm³, 40 µW/cm³; shock type with up to 4.13 mW, 48 cm³, 86 µW/cm³; treadmill and two test subjects | Abstract of Ylli et al. (2015) Reference 8 https://doi.org/10.1088/0964-1726/24/2/025029 | Sourced |
| Title, edition and date of ISO 5712:2022, and that it specifies how to measure output power, mechanical quality factor, electromechanical coupling factor and output efficiency | ISO page (checked on 10 October 2026) Reference 9 https://www.iso.org/standard/81569.html | Sourced |
| Titles, editions, dates and scope of IEC 62830-1:2017, -2:2017, -3:2017, -4:2019, -5:2021, -6:2019 and -7:2021 | IEC Webstore Reference 10 https://webstore.iec.ch/en/publication/27039 Reference 14 https://webstore.iec.ch/en/publication/30355 Reference 15 https://webstore.iec.ch/en/publication/30924 Reference 16 https://webstore.iec.ch/en/publication/26798 Reference 13 https://webstore.iec.ch/en/publication/26500 Reference 17 https://webstore.iec.ch/en/publication/60105 Reference 18 https://webstore.iec.ch/en/publication/62444 | Sourced |
| Title, date and scope of IEC TS 62607-7-2:2023 (efficiency testing of cells other than multi-junction under indoor light) | IEC Webstore Reference 11 https://webstore.iec.ch/en/publication/61819 | Sourced |
| Title and date of ISO 24687:2023, a method for the Seebeck coefficient and electrical conductivity of bulk thermoelectric materials from 300 K to 1200 K, for materials used in power generation, energy harvesting, cooling and heating | ISO page Reference 12 https://www.iso.org/standard/80856.html | Sourced |
| Title, date and scope of IEC 62047-28:2017 | IEC Webstore Reference 19 https://webstore.iec.ch/en/publication/30684 | Sourced |
| Title of JIS C 5630-28:2020 and its identity (IDT) with IEC 62047-28:2017; title of JIS R 1762:2020; titles of JIS R 1650-1, -2 and -3:2002 | JSA Webdesk standard pages Reference 20 https://webdesk.jsa.or.jp/books/W11M0090/index/?bunsyo_id=JIS+C+5630-28%3A2020 Reference 21 https://webdesk.jsa.or.jp/books/W11M0090/index/?bunsyo_id=JIS+R+1762%3A2020 Reference 22 https://webdesk.jsa.or.jp/books/W11M0090/index/?bunsyo_id=JIS+R+1650-1%3A2002 Reference 23 https://webdesk.jsa.or.jp/books/W11M0090/index/?bunsyo_id=JIS+R+1650-2%3A2002 Reference 24 https://webdesk.jsa.or.jp/books/W11M0090/index/?bunsyo_id=JIS+R+1650-3%3A2002 | Sourced |
| The possibility of powering a computer from the energy of everyday actions (walking, breathing, blood pressure, body heat, finger and limb motion) | Abstract of Starner (1996) Reference 25 https://doi.org/10.1147/sj.353.0618 | Sourced |
| Calculations in Chapter 6: daily energy (0.864–8.64, 0.0864–0.864, 0.00864–0.0864 J/cm²) and message counts (about 8,640–86,400, 864–8,640, 86–864 per day); the energy of one hour of shoe-sole generation (about 3.0 J, 14.9 J) and volume power (40, 86 µW/cm³); power of 0.25 at half the acceleration and 0.0625 at a quarter; a σ ratio of 0.61 and its square 0.37; the inverse ratio of 1.64 and 2.7 times | Our calculation. Assumptions and limits are in Chapter 6 (an upper bound of 24 h continuous operation and zero loss; 100 µJ is an example; the resonant proportionality is commentary) | Our calculation |
| Texts of the standards; the conditions of each original paper behind the representative power densities; the source of the resonant-generator formula; an ISO, JIS or ASTM standard for triboelectric devices; a JIS limited to indoor light; efficiency of real power-management circuits; market and shipment statistics | Could not be confirmed in the primary sources accessible to this article, so they are not stated | Commentary |
| The readings that “the output of an element is read as the form it takes at the input of power management” and “material indices also change with how they are measured”; the positioning of the standards (Chapter 8); the general relation that resonant power is proportional to the square of acceleration | This article’s own organization and commentary based on the published content. Not views stated by the companies or institutions | Commentary |
| That Figs. 2, 3, 4, 6 and 7 are explanatory drawings and not actual observation images or data themselves, and that Figs. 1 and 5 are AI-generated images | Note by this article | Commentary |
Last updated: 10 October 2026. Sources are limited to primary material (peer-reviewed papers and reviews, standards-body pages). The texts of the standards are paid and could not be checked. Because the article includes structural summaries and materials-design readings, these are marked as “commentary” and kept apart from sourced facts. The texts of the standards, the conditions behind the representative power densities, the source of the resonant-generator formula, an ISO, JIS or ASTM standard for triboelectric devices, a JIS limited to indoor light, the efficiency of real power-management circuits and market statistics could not be confirmed and are not stated. Output and power-density values differ by source in element shape, input and load and cannot be generalized to other elements or products. All figures are explanatory conceptual drawings. Figs. 2, 3, 4, 6 and 7 are vector drawings and Figs. 1 and 5 are AI-generated images; none of them shows an actual cross-section photograph, micrograph or real product.