TECHNOLOGY EXPLAINER
CCS (Carbon Dioxide Capture and Storage)
— "capture rate" in blue hydrogen: a percentage of what?
Making hydrogen from natural gas and similar feedstocks produces carbon dioxide (CO2). Capturing that CO2, transporting it and storing it underground is CCS, and hydrogen paired with it is called "blue hydrogen". But "90% capture" means very different things depending on what the 90% is of. Using official documents as primary sources, this article sets out from a materials engineer's viewpoint the flow of capture (including chemical absorption), transport and storage, the definitions of capture rate, the degradation of materials (absorbents, pipelines, cement) and the regulations. It is not legal or investment advice, nor advice on designing or operating equipment.
- What CCS is (the short version)
- The whole flow — capture, transport, storage, monitoring, closure
- Capture — chemical absorption, and where CO2 comes from in hydrogen production
- Our calculation: what is the denominator of the "capture rate"?
- A materials engineer's view (1): absorbents degrade and corrode equipment
- Transport — pipelines and ships, and materials issues
- Storage — formations, monitoring, and the difference from enhanced oil recovery (EOR)
- A materials engineer's view (2): well cement and interfaces
- Regulation — the EU, Japan, the United States, standards
- Our calculation: what is 45Q worth per kilogram of hydrogen?
- Challenges, and what we could not confirm
- Glossary / References / Claim-to-source audit
Sourced = stated in published material (link given)
Our calculation = a figure this article derived, with the assumptions spelled out
Not yet confirmed = a plan, target or item under review with no confirmed outcome
Structural readings are marked separately as Commentary, and weakly supported ideas are labelled Inference.
Rules are described by stage: proposal, adoption (enactment) and entry into force (application). The date of checking is 8 October 2026.
This article is an explanation of principles, materials and rules. Equipment for capturing, transporting and storing CO2 is subject to laws and standards such as Japan's High Pressure Gas Safety Act and the Act on Carbon Dioxide Storage Business, and nothing here is individual advice on design, construction, operation or safety. Rules are amended, so check the original text and the latest position before any actual decision.
1. What CCS is (the short version)
CCS (carbon dioxide capture and storage) is the general name for technology that separates and captures CO2 from flue gas or process gas (Capture), compresses and moves it (Transport), and stores it in underground formations (Storage). The IPCC special report (2005) includes fossil-fuel-based hydrogen production plants among the large point sources to which CCS is relevantSourced [Reference 3].
- Relation to hydrogen: hydrogen from natural gas or coal with the CO2 captured and stored is generally called "blue hydrogen" (informal; see our explainer on hydrogen colors and carbon intensity).
- Present scale: according to the IEA, over 80% of hydrogen in 2024 came from coal, oil and natural gas, and less than 1% of those routes were equipped with CCUS (about 16 facilities worldwide, mostly in North America). Cumulative capture capacity is about 12 Mtpa (12 million tonnes a year) of CO2, but only about 1 Mtpa is injected into dedicated storage (Quest in Canada); the rest goes to enhanced oil recovery (EOR) and other usesSourced [Reference 1].
- Scope of this article: the use of captured CO2 (CCU) is not covered.
"90% capture" means nothing unless the denominator is stated. Retrofits of existing hydrogen plants mostly use "partial capture" of only the concentrated process CO2; the IEA says all facilities operating at the end of 2024 were retrofitted with partial capture, so only about 0.6 Mtpa of the 0.9–1.2 Mtpa of hydrogen produced qualified as low-emissionsSourced [Reference 1].
2. The whole flow — capture, transport, storage, monitoring, closure
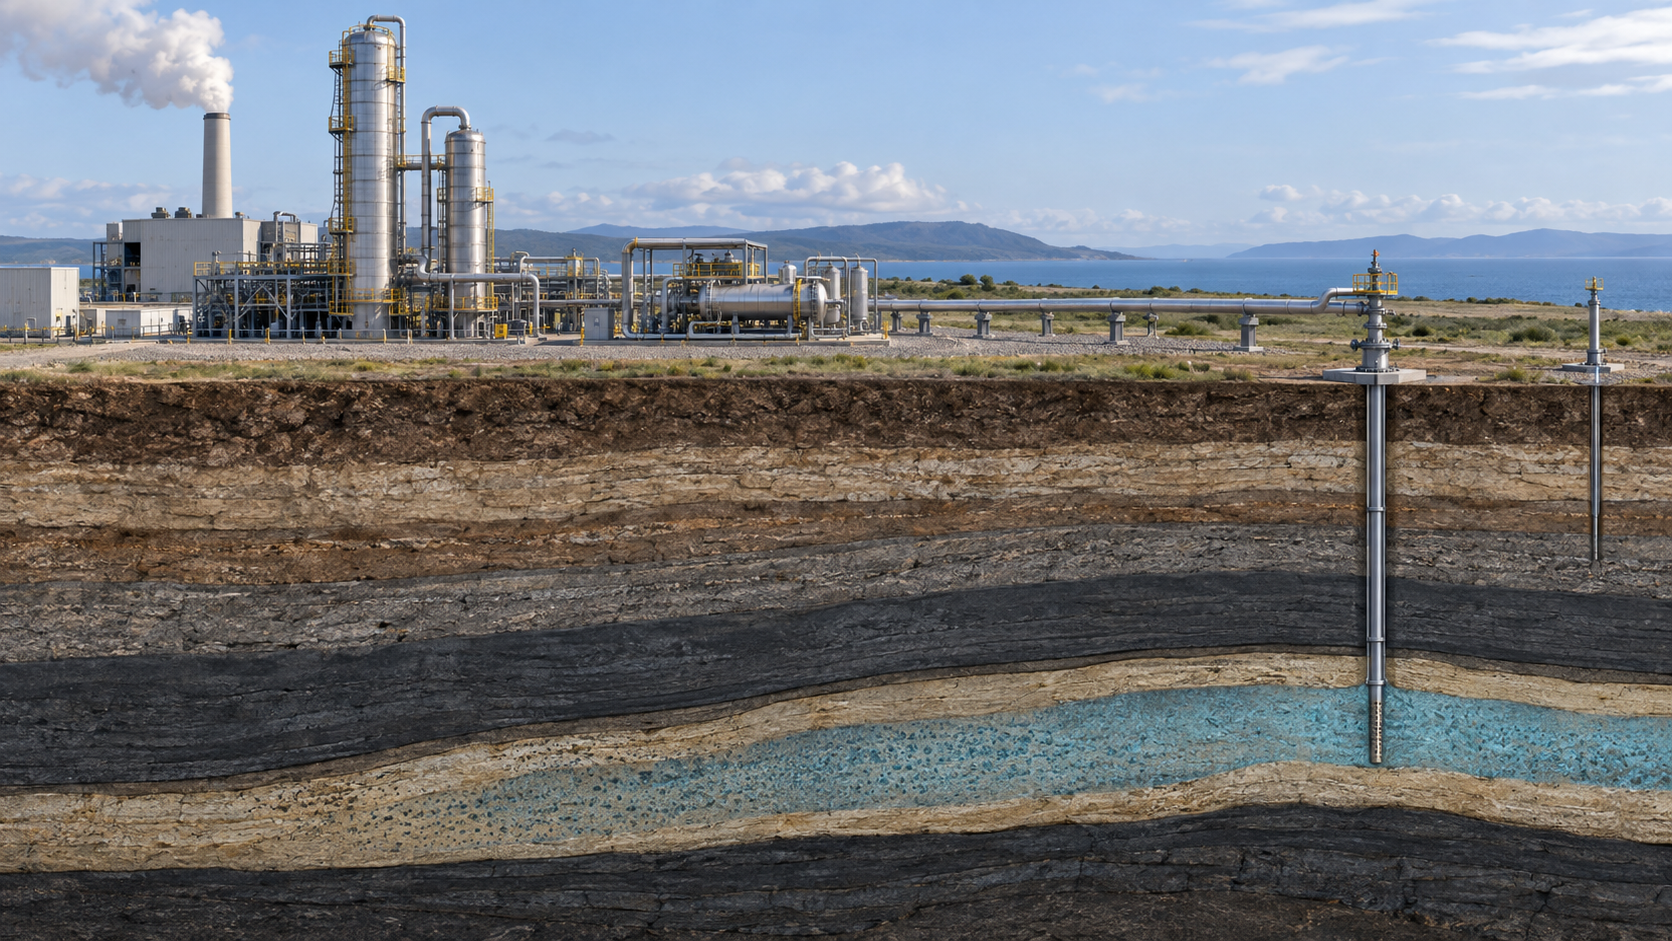
View the original SVG schematic with technical details
The IPCC special report states that the emissions reduction from CCS depends on the fraction of CO2 captured, the extra CO2 produced by the additional energy needed for capture, transport and storage, any leakage in transport, and the fraction retained in storage over the long termSourced [Reference 3].
3. Capture — chemical absorption, and where CO2 comes from in hydrogen production
(1) Capture methods
The IPCC report divides capture systems into post-combustion (separating from flue gas), pre-combustion (including hydrogen and fertilizer production, where the fuel is gasified or reformed before separation) and oxyfuel combustion, among others [Reference 3]. The most mature post-combustion method is chemical absorption in aqueous alkanolamine. The review by Kittel and Gonzalez says this method is well suited to large industrial point sources, is one of the most mature technologies, and has similar applications already in acid gas removal from natural gasSourced [Reference 14]. In an absorber the CO2 dissolves into the solvent; in a regenerator heat releases the CO2, and the solvent is recirculated (our general description).
(2) Where does CO2 come from in hydrogen production?
In steam reforming of natural gas, CO2 is emitted in two streams: the process gas (the product of the reforming reaction, rich in CO2) and the reformer flue gas (from burning fuel for heat, with a low CO2 concentration). The IEA says that every facility operating in 2024 uses partial capture of only the process emissions (high concentration) [Reference 1]. It also says autothermal reforming (ATR) makes a single concentrated CO2 stream and so allows high capture rates; the first ATR-plus-CCUS plant is under construction in the United States (start-up expected in 2026) and a second project in Canada has reached FID but has been delayed to 2028Sourced [Reference 1].
4. Our calculation: what is the denominator of the "capture rate"?
"Capture rate" is used in at least three senses. When reading a source, one has to check which is meant.
| Name (our grouping) | Denominator | Example in the sources |
|---|---|---|
| Capture efficiency of the capture plant | The CO2 in the gas fed to the capture unit | IPCC: "available technology captures about 85–95% of the CO2 processed in a capture plant" [Reference 3] |
| Overall capture rate of the facility | The total emissions of the facility (including streams not captured) | IEA: in estimating low-emissions hydrogen it assumes overall capture rates of 40–60% for gas-based and 90–95% for coal- and oil-based production [Reference 1]. EU: the formula takes actual capture rates into account [Reference 4] |
| Net lifecycle reduction | The baseline emissions without CCS (including extra energy and leakage) | IPCC: a power plant with CCS needs 10–40% more energy, and with secure storage achieves a reduction of about 80–90% (power plant example) [Reference 3] |
The IPCC figures are from the 2005 special report (mainly about power plants) and are not values for hydrogen production. The IEA's "40–60%" is an assumption for an estimate based on the configuration of facilities in 2024.
Using the same convention as our explainer on hydrogen colors and carbon intensity, we take direct emissions of natural-gas-based hydrogen as D = 9 kg-CO2e/kg-H2 and upstream and midstream emissions as U (back-calculated from the IEA's 10–14 kg and upstream 1–5 kg [Reference 2]). Carbon intensity after capture is CI = (1 − η) × 9 + U, where η is the overall capture rate relative to direct emissionsOur calculation.
- CO2 from the reaction: from CH4 + 2H2O → CO2 + 4H2, 1 kg of hydrogen (about 496 mol) comes with about 124 mol of CO2 = about 5.46 kg. That is about 61% of the 9 kg of direct emissions (5.46 ÷ 9 = 0.607). The remaining 3.54 kg can be read as coming from combustion of the reformer heat source and the like (Commentary).
- Capturing only the process gas: even at 90% efficiency the overall capture rate is 0.9 × 0.607 = about 55%, consistent with the IEA citing capture of feedstock-related CO2 (capture rate about 60%) as one type [Reference 2].
- Capturing both streams: at 90% efficiency the overall capture rate is also 90%; at 95% it is 95%.
| Case | Overall capture rate η | CI (U = 1 kg) | CI (U = 3 kg) |
|---|---|---|---|
| No capture | 0% | 10.0 kg | 12.0 kg |
| Process gas only (90% efficiency) | about 55% | about 5.1 kg | about 7.1 kg |
| Both streams (90% efficiency) | 90% | 1.9 kg | 3.9 kg |
| Both streams (95% efficiency) | 95% | 1.45 kg | 3.45 kg |
Assumptions and limits: D = 9 kg is back-calculated from the IEA's range and is not a value for any individual plant. The energy and emissions of capture, compression, transport and injection (eCO2-c, eCO2-t and eCO2-i in the EU formula) must be deducted separately [Reference 4]. The numbers above agree in order of magnitude with the IEA's ranges (5 to 8 kg at about 60% capture and 0.8 to 6 kg above 90%) [Reference 2]. Against the Japanese and EU threshold of 3.4 kg, 95% capture does not suffice if upstream emissions are 3 kg (Commentary).
5. A materials engineer's view (1): absorbents degrade and corrode equipment
- The review by Gouedard et al. (2012) divides amine degradation into oxidative and thermal degradation, and organizes that amines degrade in the presence of oxygen, CO2, NOx, SO2 and heat, causing solvent loss, equipment corrosion and volatile degradation productsSourced [Reference 15].
- The review by Kittel and Gonzalez (2014) says corrosion control is a major challenge in operating alkanolamine post-combustion capture, and covers lessons from decades of use in natural gas treating, the specifics of post-combustion capture, corrosion mitigation strategies and research on new solvents, together with recommendations on CO2 quality and impurity concentrations for transport and geological storageSourced [Reference 14].
What a materials engineer can read from this is as follows (Commentary).
- The causes of degradation come from the gas composition. Oxygen, NOx and SO2 are components of combustion flue gas. The process gas of hydrogen production (gas after reforming), by contrast, is high-pressure, high-concentration CO2 and differs in composition from flue gas. Inference: degradation behavior of the absorbent may therefore differ, but we could not confirm a comparison of absorbent degradation in hydrogen-plant process gas.
- Absorbent "loss" is an operating cost, and degradation products raise corrosion and emission issues. Solvent has to be topped up, and volatile degradation products can become subjects of assessment of emissions to air.
- Material choice changes with absorbent, temperature and CO2 loading (the amount of CO2 in the solvent). Because these conditions govern the degree of corrosion, the review devotes a section specifically to corrosion control [Reference 14].
6. Transport — pipelines and ships, and materials issues
- Choice of method (IPCC, 2005): for large quantities over distances up to around 1,000 km pipelines are preferred, while for amounts under a few million tonnes a year or for longer sea distances ships may be economically more attractive. Dry CO2 is not corrosive to pipelines, even if it contains contaminants; where moisture is present it is removed to prevent corrosionSourced [Reference 3].
- Standard (ISO 27913:2024, 2nd edition, published October 2024): it specifies requirements and recommendations for transporting CO2 streams from the capture site to the storage facility by rigid metallic pipelines (onshore and offshore, including conversion of existing pipelines), covering gaseous and dense phases, CO2 stream quality assurance and converging streams from different sources. Transport by ship, rail or road is not coveredSourced [Reference 12]. The full text is paid, so this article stays with the title and stated scope and has not checked the permitted composition of the CO2 stream.
- Water and impurities: CO2 with water forms carbonic acid, which corrodes steel (general explanation). That is why the IPCC says moisture is removed [Reference 3]. The review by Kairy et al. (2023) critically organizes test methodologies for corrosion of pipeline steel in dense-phase CO2 containing impurities (title and subject only confirmed) [Reference 19].
- Fracture in the dense phase: the propagation of a running ductile fracture when a high-pressure CO2 pipeline ruptures depends on steel toughness and decompression behavior, and probabilistic assessments for dense-phase and supercritical pipelines are being researched (Zhou et al., 2024; title and subject only confirmed) [Reference 18].
- Mixed-in impurities: quality assurance for converging streams from different sources is within the scope of ISO 27913 [Reference 12]. Whether hydrogen, carbon monoxide, methane and the like remain in streams from hydrogen plants we could not confirm.
- Seals: it is generally known that rubber permeated by high-pressure gas can blister or crack on rapid decompression (rapid gas decompression), as with elastomer seals. We could not confirm a specific assessment for CO2 pipelines (Inference). See also our explainers on polyurethanes and elastomers and on silicones.
7. Storage — formations, monitoring, and the difference from enhanced oil recovery (EOR)
- Types of formation: the IPCC lists as targets for geological storage oil and gas fields, unminable coal beds and deep saline formations [Reference 3]. Japan's Act defines a storage formation as "an underground stratum whose temperature, pressure and other properties, inside and around it, are suited to stable storage of CO2" (our translation of the Japanese text) [Reference 7].
- Retention (IPCC, 2005): in appropriately selected and managed geological reservoirs, the fraction retained is "very likely" to exceed 99% over 100 years and "likely" to exceed 99% over 1,000 yearsSourced [Reference 3]. This is a 2005 assessment, not a guarantee for any project.
- Standard (ISO 27914:2026, 2nd edition, published March 2026): it sets requirements for geological storage that minimize the risk of CO2 losses (site screening, characterization, design and development, operation, preparation for termination) and a methodology for quantifying the net mass of CO2 stored. Injection for enhanced hydrocarbon recovery (EOR) and storage associated with it are outside its scope; ISO 27916 is said to apply to storage associated with CO2-EORSourced [Reference 13].
- Difference from EOR (IEA): most CO2 injected for EOR can be retained in the reservoir over the life of the project, but additional monitoring and verification is required to confirm permanent storage [Reference 1]. Indeed, of the CO2 captured at hydrogen plants, only about 1 Mtpa goes to dedicated storage (Quest in Canada) and the rest is used for EOR and the like [Reference 1]. Quest is reported to have stored over 9 Mt of CO2 since start-up in 2015 [Reference 1].
- Treatment in EU accounting: Delegated Regulation (EU) 2025/2359 credits CCS only for geological storage permitted under Directive 2009/31/EC and the like and not used for enhanced recovery. Leaks are not credited, and the recitals say sites that repeatedly leak should not be accepted for injection [Reference 4].
8. A materials engineer's view (2): well cement and interfaces
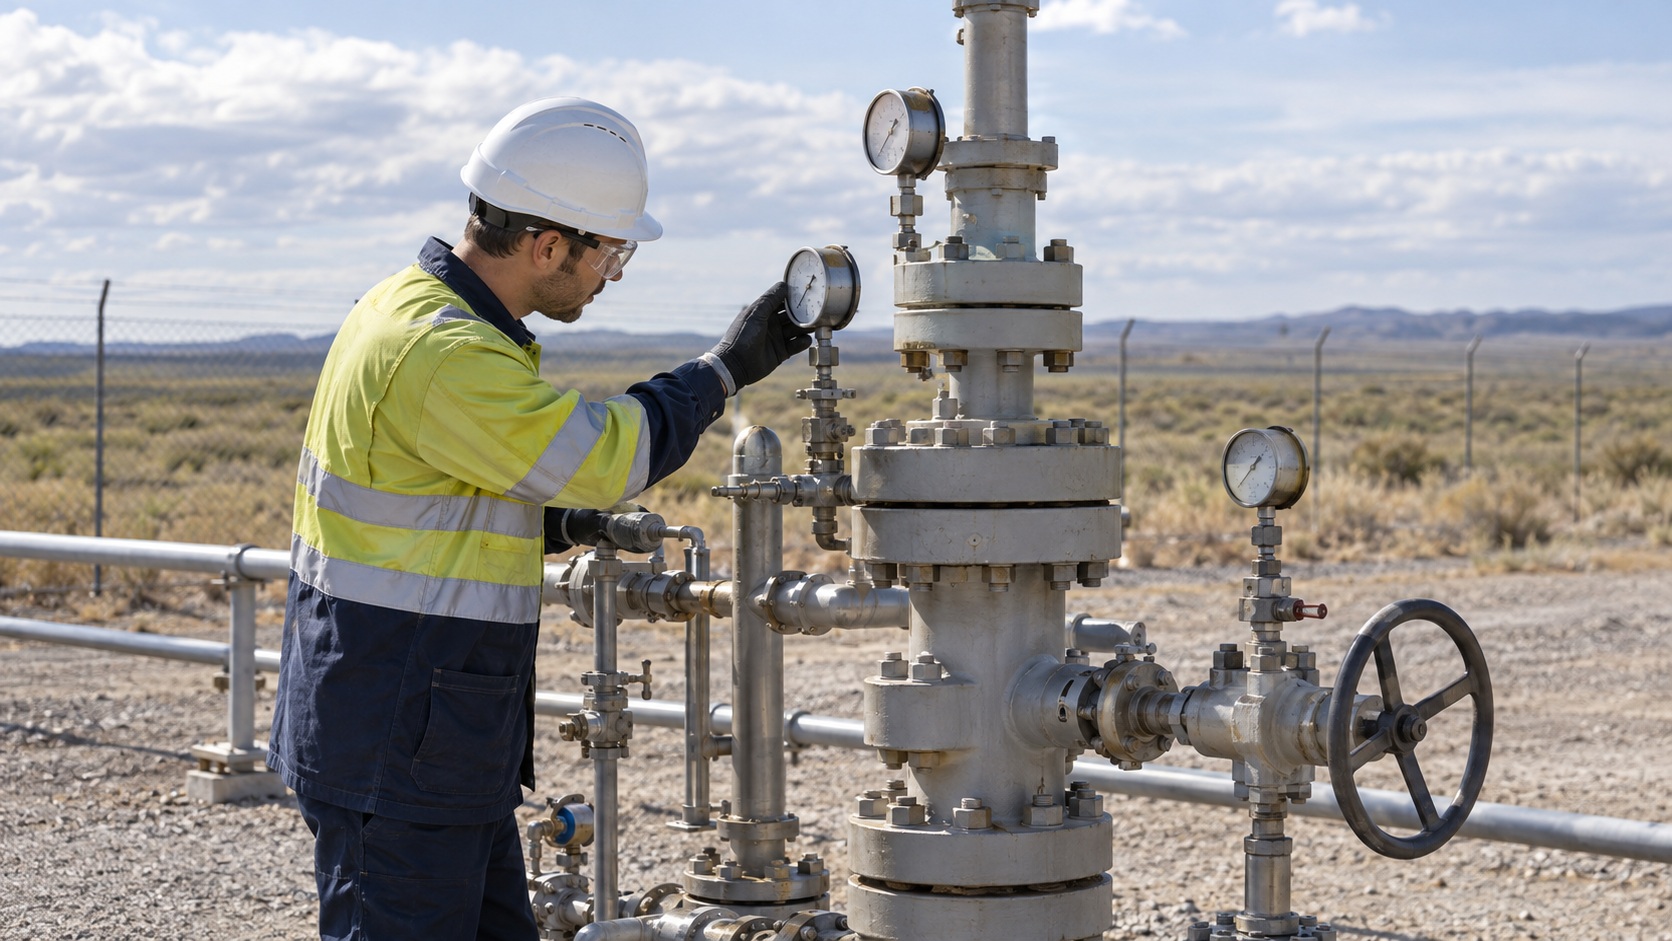
The wells leading into the formation are considered more likely than the storage formation itself to be leak paths for CO2. Carey et al. analyzed cement recovered from a well at SACROC in Texas (an oil field using CO2 for enhanced oil recovery), drilled 55 years earlier and exposed to CO2 for 30 years.
- The recovered cement had permeabilities in the millidarcy (mD) range and retained its capacity to prevent significant flow of CO2Sourced [Reference 16].
- However, cement within about 1 cm of the contact with the shale was heavily carbonated, transformed to calcite, aragonite, vaterite and the like and orange in color [References 16, 17]. The heavily carbonated region was separated from less altered cement by a narrow, dense zone of silica and carbonate deposition [Reference 16].
- Carey's presentation (hosted on a U.S. EPA site) lists the observations as: evidence of CO2 migration at the cement-caprock interface and at the casing-cement interface; the steel was not corroded (though cathodic protection was present); and healed fractures in the cement [Reference 17].
- The same material lists reasons wells leak: formation damage during drilling, incomplete cement placement, poor bonding of cement to formation and casing, cement shrinkage, micro-annuli and fractures from mechanical and thermal stress, plus geochemical attack (corrosion of steel casing, degradation of Portland cement, carbonation, hydrogen sulfide, sulfate and acid attack) [Reference 17].
A materials engineer should separate chemical degradation of the cement itself (carbonation and so on) from gaps caused by adhesion and stress at interfaces (Commentary). The SACROC case shows that "the cement did not lose its function in 30 years" while also showing that alteration concentrates at interfaces. It is the case of one well and cannot be generalized to other formations, temperatures or fluid compositions.
9. Regulation — the EU, Japan, the United States, standards
(1) EU
- Treatment in accounting: Delegated Regulation (EU) 2025/2359 (adopted 8 July 2025, published 21 November 2025) credits CCS only for permitted geological storage not used for enhanced recovery, under law that ensures detection and remediation of leaks. The recitals say that currently, avoided surrender of allowances under the EU ETS applies only to emissions stored in a storage site permitted under Directive 2009/31/ECSourced [Reference 4]. We have not checked the text of the directive itself.
- Storage target: the European Commission presents a goal of enabling hard-to-abate industries to store at least 50 million tonnes of captured CO2 underground each year by 2030 (Climate Action page, updated 19 November 2025)Not yet confirmed [Reference 6]. We have not confirmed the legal basis for this target.
(2) Japan
- The Act on Carbon Dioxide Storage Business (Act No. 38 of Reiwa 6) was promulgated on 24 May 2024. It came into force in stages: on a date set by Cabinet Order within three months of promulgation (Chapters 1 and 4 and so on), within six months (parts on test drilling), and then in full on "22 May Reiwa 8" (22 May 2026), as fixed by Cabinet Order No. 151 of Reiwa 8 (the order setting the date of entry into force)Sourced [References 7, 8]. As of the date of checking (8 October 2026), the Act is therefore fully in force.
- Permits and plans: the Minister of Economy, Trade and Industry can designate an area with a storage formation as a specified area and invite and select an operator (Article 3). A storage operator draws up a storage business implementation plan for each permitted storage area and needs approval before starting. The plan covers the method of storing CO2, safety, measures to prevent leakage, monitoring of the storage state and characteristics of the CO2 stored, and meeting the criteria is a condition for approval (Article 38). For storage under the seabed, the CO2 must meet standards set by Cabinet Order, and there must be no other appropriate way of disposal (Article 38, paragraph 2, item 5) [Reference 7].
- Transport: pipeline transport (pipeline transport business) is under a notification system with provisions on safety obligations, construction plans and inspection (Article 78 onward) [Reference 7].
- Closure and handover of management: to end a storage business the operator must obtain approval of a plan for closure measures (such as plugging the wellhead), have the results confirmed, and obtain permission to cease after meeting criteria including that the storage state of CO2 is stable (Article 53). After that, the storage right transfers to the Japan Organization for Metals and Energy Security (JOGMEC), which manages the notified storage area. To fund that, the storage operator pays contributions to JOGMEC (Articles 45, 54 and 55). If a leak occurs or is likely, JOGMEC takes emergency measures and reports (Article 56) [Reference 7].
- Liability for damage: a storage operator (or, if the storage right has already passed to JOGMEC, the operator at the time of transfer) is liable when damage to others is caused by excavation for storing CO2, discharge of pit water, or leakage of stored CO2 (Article 124) [Reference 7].
- National target: the Basic Hydrogen Strategy (June 2023) aims to improve the business environment for starting CCS projects by 2030 and to secure a prospect of storing 6 to 12 million tonnes a year by 2030Not yet confirmed [Reference 9].
(3) United States
- 45Q (credit for carbon oxide sequestration): the "applicable dollar amount" in the current text is US$17 per tonne for 2025 and 2026 (inflation-adjusted from 2027), and five times that (US$85) if wage and apprenticeship requirements are met. The same amount applies whether CO2 is stored geologically, stored through EOR, or utilized. Direct air capture gets US$36 (US$180 at five times). The credit runs for 12 years from when the equipment is placed in service, and construction must begin before 1 January 2033. This structure results from the amendment by the law of 4 July 2025 (Pub. L. 119-21 §70522)Sourced [Reference 10]. The IEA's 2025 report gives US$85 for storage and US$60 for use [Reference 1], and we could not confirm how that relates to the amendment.
- Relation to 45V: no 45V credit is allowed for hydrogen at a facility with carbon capture equipment for which a 45Q credit is allowed (§45V(d)(2)) [Reference 11]. The IEA likewise says the two cannot be combined [Reference 1].
(4) Standards
ISO/TC 265 has issued ISO 27913:2024 (pipeline transportation) and ISO 27914:2026 (geological storage) [References 12, 13]. The full texts are paid, so this article stays with the stated scope.
10. Our calculation: what is 45Q worth per kilogram of hydrogen?
We convert using the premise the IEA gives (natural-gas-based hydrogen emits 0.9105 kg of CO2 per Nm³ of H2 [Reference 1]) and the 45Q figure of US$85 per tonne (wage and apprenticeship requirements met)Our calculation.
- CO2 per kg of hydrogen: taking the density of hydrogen as 0.0899 kg/Nm³ (standard conditions, our assumption), 1 kg is about 11.1 Nm³. Emissions = 0.9105 × 11.1 = about 10.1 kg-CO2/kg-H2 (the same order as D plus upstream of about 10 kg in chapter 4).
- Overall capture rate 90%: captured = about 9.1 kg. × US$0.085/kg = about US$0.78/kg-H2 (the IEA states "around US$0.8" [Reference 1]).
- Overall capture rate 55% (process gas only): captured = about 5.6 kg. × 0.085 = about US$0.47/kg-H2.
- Comparison: in the table of chapter 4, capturing both streams (90% efficiency, U = 1 kg) gives CI ≈ 1.9 kg, which falls in the "1.5 to 2.5 kg" tier (25%) of 45V; with the five-times requirement met, the base amount is 0.60 × 25% × 5 = US$0.75/kg (before inflation adjustment).
Assumptions and limits: the density of hydrogen, the IEA emission figure and the capture rates are assumptions, not values for any real facility. Because 45Q and 45V cannot be combined, the two figures above are guides for one or the other. Amounts are before inflation adjustment, and the "17 dollars" of 45Q is the value through 2026. The relation between the IEA's statement and the statute carries the caution noted above. The 45V accounting includes upstream methane, which the IEA says averages about 1.8 kg on upstream and midstream alone [Reference 1].
11. Challenges, and what we could not confirm
- The limit of partial capture: retrofits of existing plants mostly capture only the concentrated process gas, so overall capture is only about 55–60% [References 1, 2]
- Upstream methane: even a high capture rate leaves upstream and midstream emissions (1 to 5 kg) to decide whether a threshold is reached [Reference 2]
- Skew in storage track record: of CO2 from hydrogen production, dedicated storage is about 1 Mtpa and EOR is most of the rest [Reference 1]
- Long-term integrity of materials and interfaces: absorbent degradation, pipeline corrosion and alteration of well cement and interfaces depend on conditions and are hard to generalize [References 14 to 17]
(1) We could not confirm a comparison of absorbent degradation and corrosion for hydrogen production
The reviews we consulted deal mainly with capture from combustion flue gas. We could not confirm a comparison of absorbent degradation or equipment corrosion in the process gas of hydrogen production.
(2) We could not confirm permitted CO2 stream compositions or pipeline material specifications
The full text of ISO 27913 is paid, so permitted impurity levels in the CO2 stream, steel toughness and coating specifications, and seal material selection are not covered. For research on corrosion and ductile fracture in the dense phase, we confirmed only titles and subjects.
(3) We could not confirm Directive 2009/31/EC or the legal basis of the 2030 storage target
Access to the EU Official Journal was temporarily restricted, and we could not read the text of Directive 2009/31/EC or of the regulation on storage capacity in the Union. Statements on the EU rest on the articles and recitals of Delegated Regulation 2025/2359 and on a European Commission page.
(4) We could not confirm permit status, costs or cost records of individual projects in Japan
We could not confirm the record of storage business permits and specified-area designations, the storage operators, the costs of transport and storage, or the amounts of contributions.
(5) Use of captured CO2 (CCU), direct air capture and ocean storage are not covered
These are outside the scope. The IPCC's 2005 figures (capture efficiency, retention, pipeline distance and volume) are assessments of that time and may differ from present records.
- CCS is a chain of capture, compression, transport, storage, monitoring and closure, and the emissions avoided depend on net reduction, not the amount capturedSourced
- Under 1% of the world's hydrogen has CCUS; dedicated storage is about 1 Mtpa and the rest goes to EOR and the likeSourced
- The meaning of a capture rate changes with the denominator. Capturing only the process gas at 90% efficiency cuts only about 55% of direct emissionsOur calculation
- With 3 kg of upstream emissions, even 95% capture does not reach the Japanese and EU threshold of 3.4 kgOur calculation
- The materials issues are absorbent degradation and corrosion, water and impurities in pipelines, and well cement and interfacesSourced
- Japan's Act on Carbon Dioxide Storage Business came fully into force on 22 May 2026; in the United States 45Q has since July 2025 given the same amount for storage, EOR and use, and cannot be combined with 45VSourced
12. Glossary
- CCS / CCUS
- CO₂ capture and storage / capture, utilization and storage.
- Chemical absorption
- A method in which CO₂ is chemically absorbed in an aqueous amine solution and released by heating.
- Process gas
- The gas obtained from the reforming reaction. It has a high CO₂ concentration.
- Partial capture
- Capturing only part of the emissions (for example the concentrated process emissions).
- ATR (autothermal reforming)
- Reforming with oxygen added. It gives a single concentrated CO₂ stream and is said to allow high capture rates.
- Dense phase
- The state of CO₂ at high pressure where its density is close to a liquid's. Used in pipeline transport.
- EOR
- Enhanced oil recovery. Injecting CO₂ into an oil reservoir to raise recovery.
- Storage formation
- An underground formation able to hold CO₂ stably (saline formations, depleted oil and gas fields and so on).
- 45Q
- The U.S. tax code section giving a credit for carbon oxide sequestration.
- Casing
- The steel pipe that protects the wall of a well, with cement set around it.
- Permeability (mD)
- How readily rock or cement passes fluid, expressed in millidarcy.
- JOGMEC
- The Japan Organization for Metals and Energy Security. Under the storage business Act it manages storage areas after closure.
13. References
- International Energy Agency (IEA) "Global Hydrogen Review 2025" (revised October 2025) — iea.org
- International Energy Agency (IEA) "Towards hydrogen definitions based on their emissions intensity" (2023, for the G7) — iea.org
- IPCC "Special Report on Carbon Dioxide Capture and Storage — Summary for Policymakers" (2005, PDF) — ipcc.ch
- European Commission Delegated Regulation (EU) 2025/2359 (methodology for savings of low-carbon fuels), 8 July 2025, Official Journal 21 November 2025 — eur-lex.europa.eu
- European Commission Delegated Regulation (EU) 2023/1185 (methodology for savings of RFNBO and recycled carbon fuels), 10 February 2023, Official Journal 20 June 2023 — eur-lex.europa.eu
- European Commission, Directorate-General for Climate Action "Industrial Carbon Management" (mentions the 2030 storage target; updated 19 November 2025) — climate.ec.europa.eu
- Japan Act on Carbon Dioxide Storage Business (Act No. 38 of Reiwa 6; in Japanese), promulgated 24 May 2024 (e-Gov Law Search) — laws.e-gov.go.jp
- Japan Cabinet Order setting the date of entry into force of the Act on Carbon Dioxide Storage Business (Cabinet Order No. 151 of Reiwa 8; in Japanese) (e-Gov Law Search) — laws.e-gov.go.jp
- Cabinet-level Ministerial Council on Renewable Energy and Hydrogen "Basic Hydrogen Strategy" (in Japanese), 6 June 2023 (PDF) — meti.go.jp
- United States 26 U.S. Code § 45Q (credit for carbon oxide sequestration), amended by Pub. L. 119-21 §70522 (4 July 2025) — law.cornell.edu
- United States 26 U.S. Code § 45V (credit for production of clean hydrogen) — law.cornell.edu
- ISO "ISO 27913:2024 Carbon dioxide capture, transportation and geological storage — Pipeline transportation systems" (2nd edition, October 2024; title and scope only, the full text is paid) — committee.iso.org
- ISO "ISO 27914:2026 Carbon dioxide capture, transportation and storage — Geological storage" (2nd edition, March 2026; title and scope only, the full text is paid) — committee.iso.org
- Kittel, Gonzalez "Corrosion in CO2 Post-Combustion Capture with Alkanolamines – A Review", Oil & Gas Science and Technology – Rev. IFP Energies nouvelles 69, 915–929 (2014) (abstract checked) — doi.org/10.2516/ogst/2013161
- Gouedard, Picq, Launay et al. "Amine degradation in CO2 capture. I. A review", International Journal of Greenhouse Gas Control 10, 244–270 (2012) (content of the abstract checked) — doi.org/10.1016/j.ijggc.2012.06.015
- Carey, Wigand, Chipera et al. "Analysis and performance of oil well cement with 30 years of CO2 exposure from the SACROC Unit, West Texas, USA", International Journal of Greenhouse Gas Control 1, 75–85 (2007) (content of the abstract checked) — doi.org/10.1016/s1750-5836(06)00004-1
- Carey (Los Alamos National Laboratory) "Well Integrity and Long-Term Well Performance Assessment (Insights from work on CO2 Sequestration)" (presentation hosted on a U.S. EPA site, PDF) — epa.gov
- Zhou, Ghoraishi, Hu et al. "Probabilistic assessments of running ductile fractures in dense-phase and supercritical CO2 pipelines", Process Safety and Environmental Protection 191, 2034–2043 (2024) (title and subject only checked) — doi.org/10.1016/j.psep.2024.09.083
- Kairy, Zhou, Turnbull "Corrosion of pipeline steel in dense phase CO2 containing impurities: A critical review of test methodologies", Corrosion Science 214, 110986 (2023) (title and subject only checked) — doi.org/10.1016/j.corsci.2023.110986
14. Claim-to-source audit
| Claim in the text | Basis | Label |
|---|---|---|
| Over 80% of 2024 hydrogen from fossil fuels and under 1% with CCUS (about 16 facilities worldwide). Cumulative capture capacity of about 12 Mtpa, dedicated storage about 1 Mtpa (Quest), the rest EOR and the like. All facilities at the end of 2024 with partial capture (process emissions only), and about 0.6 Mtpa of 0.9–1.2 Mtpa qualifying as low-emissions. Overall capture rate assumed at 40–60% for gas-based production. ATR gives a single concentrated CO2 stream and high capture rates, with a U.S. plant under construction (expected 2026) and a Canadian project at FID but delayed to 2028. Quest has stored over 9 Mt since 2015. EOR needs additional monitoring. 45Q at US$85/t for storage and US$60/t for use (as written by the IEA), no combination with 45V, upstream and midstream emissions averaging about 1.8 kg, and about US$0.8/kg-H2 at 0.9105 kg-CO2/Nm3 H2 and 90% capture | IEA Global Hydrogen Review 2025[Reference 1] https://www.iea.org/reports/global-hydrogen-review-2025 | Sourced |
| IEA (2023): natural gas without capture 10 to 14 kg-CO2e/kg-H2, upstream and midstream 1 to 5 kg, 5 to 8 kg at about 60% capture, 0.8 to 6 kg above 90% (no plant operating then), no generic ceiling, the type of capture of feedstock-related CO2 (capture rate about 60%) | IEA report[Reference 2] https://www.iea.org/reports/towards-hydrogen-definitions-based-on-their-emissions-intensity | Sourced |
| IPCC (2005): CCS applies to fossil-fuel-based hydrogen production plants. Capture systems (post-combustion, pre-combustion, oxyfuel). About 85–95% of the CO2 processed in a capture plant captured. For power plants 10–40% more energy and a net reduction of about 80–90%. Reduction depends on capture fraction, extra energy, leakage and retention. Retention in geological storage "very likely" over 99% in 100 years and "likely" in 1,000 years. Storage targets (oil and gas fields, coal beds, saline formations). Pipelines preferred up to about 1,000 km and ships for small or long-distance cases. Dry CO2 not corrosive and moisture removed | IPCC SRCCS Summary for Policymakers[Reference 3] https://www.ipcc.ch/site/assets/uploads/2018/03/srccs_summaryforpolicymakers-1.pdf | Sourced |
| Delegated Regulation 2025/2359: the formula E = e_i + e_p + e_td + e_u − e_ccs − e_ccu, the terms of e_ccs (emissions of capture, transport and injection), taking actual capture rates and upstream methane into account, crediting only permitted geological storage not used for enhanced recovery, leaks not credited, the recital that sites that repeatedly leak should not be accepted, and the recital on avoided surrender of allowances for storage sites permitted under Directive 2009/31/EC. Adopted 8 July 2025, Official Journal 21 November 2025 | Delegated Regulation (EU) 2025/2359[Reference 4] https://eur-lex.europa.eu/eli/reg_del/2025/2359/oj | Sourced |
| Delegated Regulation 2023/1185: the formula includes e_ccs (savings from capture and geological storage) | Delegated Regulation (EU) 2023/1185[Reference 5] https://eur-lex.europa.eu/eli/reg_del/2023/1185/oj | Sourced |
| European Commission: reference to the goal of storing at least 50 million tonnes of captured CO2 underground each year by 2030 (updated 19 November 2025) | Climate Action page[Reference 6] https://climate.ec.europa.eu/eu-action/carbon-capture-use-and-storage_en | Sourced |
| Act on Carbon Dioxide Storage Business: Act No. 38 of Reiwa 6, promulgated 24 May 2024. Article 2 (definitions of storage formation, storage business, test drilling and so on), Article 3 (specified area), Article 38 (approval of the storage business implementation plan, sub-seabed criteria), Article 45 (contributions to JOGMEC), Articles 53 to 56 (closure measures, permission to cease, transfer of the storage right to JOGMEC, measures on leakage), Article 66 onward (safety), Article 78 onward (pipeline transport business), Article 124 (liability for damage), Supplementary Provisions Article 1 (date of entry into force) and Article 2 (review after five years) | e-Gov Law Search (Act)[Reference 7] https://laws.e-gov.go.jp/law/506AC0000000038 | Sourced |
| Cabinet Order No. 151 of Reiwa 8: the date of entry into force of the Act is 22 May Reiwa 8 (22 May 2026) | e-Gov Law Search (Cabinet Order)[Reference 8] https://laws.e-gov.go.jp/law/508CO0000000151 | Sourced |
| Basic Hydrogen Strategy (6 June 2023): improving the environment for starting CCS projects by 2030 and securing a prospect of 6 to 12 million tonnes a year of storage by 2030. Low-carbon hydrogen at most 3.4 kg-CO2e (Well to Production Gate) | Basic Hydrogen Strategy[Reference 9] https://www.meti.go.jp/shingikai/enecho/shoene_shinene/suiso_seisaku/pdf/20230606_2.pdf | Sourced |
| 26 U.S.C. §45Q: applicable amount of US$17 for 2025 and 2026 (inflation-adjusted from 2027), five times for wage and apprenticeship requirements, the same amount for storage, EOR and use (amendment by Pub. L. 119-21 §70522), US$36 for direct air capture, 12 years, construction beginning before 1 January 2033 | 26 U.S.C. §45Q[Reference 10] https://www.law.cornell.edu/uscode/text/26/45Q | Sourced |
| 26 U.S.C. §45V: tiers up to 4 kg (20%, 25%, 33.4%, 100%), the base amount of US$0.60, five times, and no combination with 45Q under §45V(d)(2) | 26 U.S.C. §45V[Reference 11] https://www.law.cornell.edu/uscode/text/26/45V | Sourced |
| ISO 27913:2024 (2nd edition, October 2024): rigid metallic pipelines, gaseous and dense phases, CO2 stream quality assurance, converging streams, ships, rail and road not covered | ISO standard page[Reference 12] https://committee.iso.org/standard/84840.html | Sourced |
| ISO 27914:2026 (2nd edition, March 2026): requirements for geological storage, a method of quantifying net mass stored, EOR injection and storage with EOR outside scope (ISO 27916 applies) | ISO standard page[Reference 13] https://committee.iso.org/standard/84578.html | Sourced |
| Kittel and Gonzalez: amine post-combustion capture suited to large point sources and among the most mature technologies, corrosion control a major challenge, lessons from natural gas treating, mitigation strategies, and recommendations on CO2 quality and impurities for transport and storage | Abstract of Kittel and Gonzalez (2014)[Reference 14] https://doi.org/10.2516/ogst/2013161 | Sourced |
| Gouedard et al.: amine degradation as oxidative and thermal, degradation in the presence of oxygen, CO2, NOx, SO2 and heat, causing solvent loss, equipment corrosion and volatile degradation products | Content of the abstract of Gouedard et al. (2012)[Reference 15] https://doi.org/10.1016/j.ijggc.2012.06.015 | Sourced |
| Carey et al. (2007): a well 55 years old with 30 years of CO2 exposure (SACROC). Recovered cement with permeability in the mD range retaining the capacity to prevent significant flow of CO2. Cement within about 1 cm of the shale contact heavily carbonated (calcite, aragonite, vaterite, orange) and a dense zone of silica and carbonate deposition | Content of the abstract of Carey et al. (2007)[Reference 16] https://doi.org/10.1016/s1750-5836(06)00004-1 | Sourced |
| Carey's presentation: evidence of CO2 migration at the cement-caprock and casing-cement interfaces, steel not corroded (with cathodic protection), healed fractures, and the list of reasons wells leak | Los Alamos National Laboratory presentation[Reference 17] https://19january2021snapshot.epa.gov/sites/static/files/documents/carey.pdf | Sourced |
| That research exists on probabilistic assessment of running ductile fracture in dense-phase and supercritical CO2 pipelines (title and subject only checked) | Zhou et al. (2024)[Reference 18] https://doi.org/10.1016/j.psep.2024.09.083 | Sourced |
| That a paper exists critically reviewing test methodologies for corrosion of pipeline steel in dense-phase CO2 with impurities (title and subject only checked) | Kairy et al. (2023)[Reference 19] https://doi.org/10.1016/j.corsci.2023.110986 | Sourced |
| About 5.46 kg of CO2 per kg-H2 from the reaction equation (about 61% of direct emissions of 9 kg). Overall capture rate of about 55% when only the process gas is captured at 90% efficiency. The CI = (1−η)×9 + U table (10.0 / 12.0, about 5.1 / about 7.1, 1.9 / 3.9, 1.45 / 3.45). 0.9105 kg/Nm3 ÷ 0.0899 kg/Nm3 = about 10.1 kg/kg-H2, about 9.1 kg captured at 90%, × US$85/t = about US$0.78/kg. About 5.6 kg at 55%, about US$0.47/kg. 0.60 × 25% × 5 = US$0.75/kg under 45V | Our calculation. D = 9 kg is back-calculated from the IEA range and is not a value for any individual plant. The hydrogen density of 0.0899 kg/Nm3 is our assumption. Emissions of capture, transport and injection are not included. Amounts are before inflation adjustment, and 45Q and 45V cannot be combined. The relation between the IEA's statement (US$85 for storage, US$60 for use) and the amended statute is not confirmed | Our calculation |
| The EU 2030 storage target, Japan's goal of starting CCS projects by 2030 with a prospect of 6 to 12 million tonnes a year of storage, the review five years after Japan's Act, and the expected start-up of ATR-plus-CCUS plants | Plans and targets, with no confirmed record of achievement. An outlook | Not yet confirmed |
| A comparison of absorbent degradation and corrosion for hydrogen production, permitted CO2 stream compositions, pipeline material specifications, the text of EU Directive 2009/31/EC and the legal basis of the storage target, permit records and costs of individual projects in Japan, and impurities in CO2 streams from hydrogen production | Could not be confirmed in primary sources within the scope of our survey, so not stated (as of 8 October 2026). Access to the EU Official Journal was temporarily restricted | Commentary |
| The grouping of three meanings of capture rate. The reading that process gas is about 60% of direct emissions and so explains the limit of partial capture. The view that absorbent degradation may differ between flue gas and process gas (inference). The framing that leak paths are man-made objects and interfaces. The framing that chemical degradation of cement is separate from gaps at interfaces | Our organization and commentary based on published content. Not views stated by any institution | Commentary |
| That Figs. 1, 2 and 3 are explanatory drawings, and that the hero image and Fig. 4 are AI-generated images | Our note | Commentary |
Last updated: 8 October 2026 (rules were checked on the same date). Sources are limited to primary material (the IEA, the IPCC, the Official Journal of the EU, e-Gov Law Search, the Basic Hydrogen Strategy, U.S. federal law, ISO standard pages and peer-reviewed papers). Because the article includes structural readings, those are marked as Commentary and kept separate from sourced fact. Comparisons of absorbent and equipment degradation for hydrogen production, permitted CO2 stream compositions, the text of EU Directive 2009/31/EC, and records and costs of storage projects in Japan could not be confirmed in primary sources and are therefore not stated. The IPCC figures are a 2005 assessment. Rules are amended, so check the original text and the latest position before any actual decision; this article is not legal, investment or design advice. All figures are explanatory concept graphics. Figs. 1 to 3 are vector drawings; the hero image and Fig. 4 are AI-generated images, and none of them shows a real facility or well.