TECHNOLOGY EXPLAINER
PEM Water Electrolysis
— precious metals and titanium splitting water on a solid polymer membrane
PEM (proton exchange membrane) electrolysis splits water on either side of a solid polymer membrane that conducts protons. Because the membrane is thin, cells can run at high current densities of 1–3 A/cm². The price is an anode that works in an acidic, high-potential, oxygen-evolving environment, which today means iridium, titanium, and platinum or gold coatings. This article lays out that combination of materials and how to read the numbers attached to it.
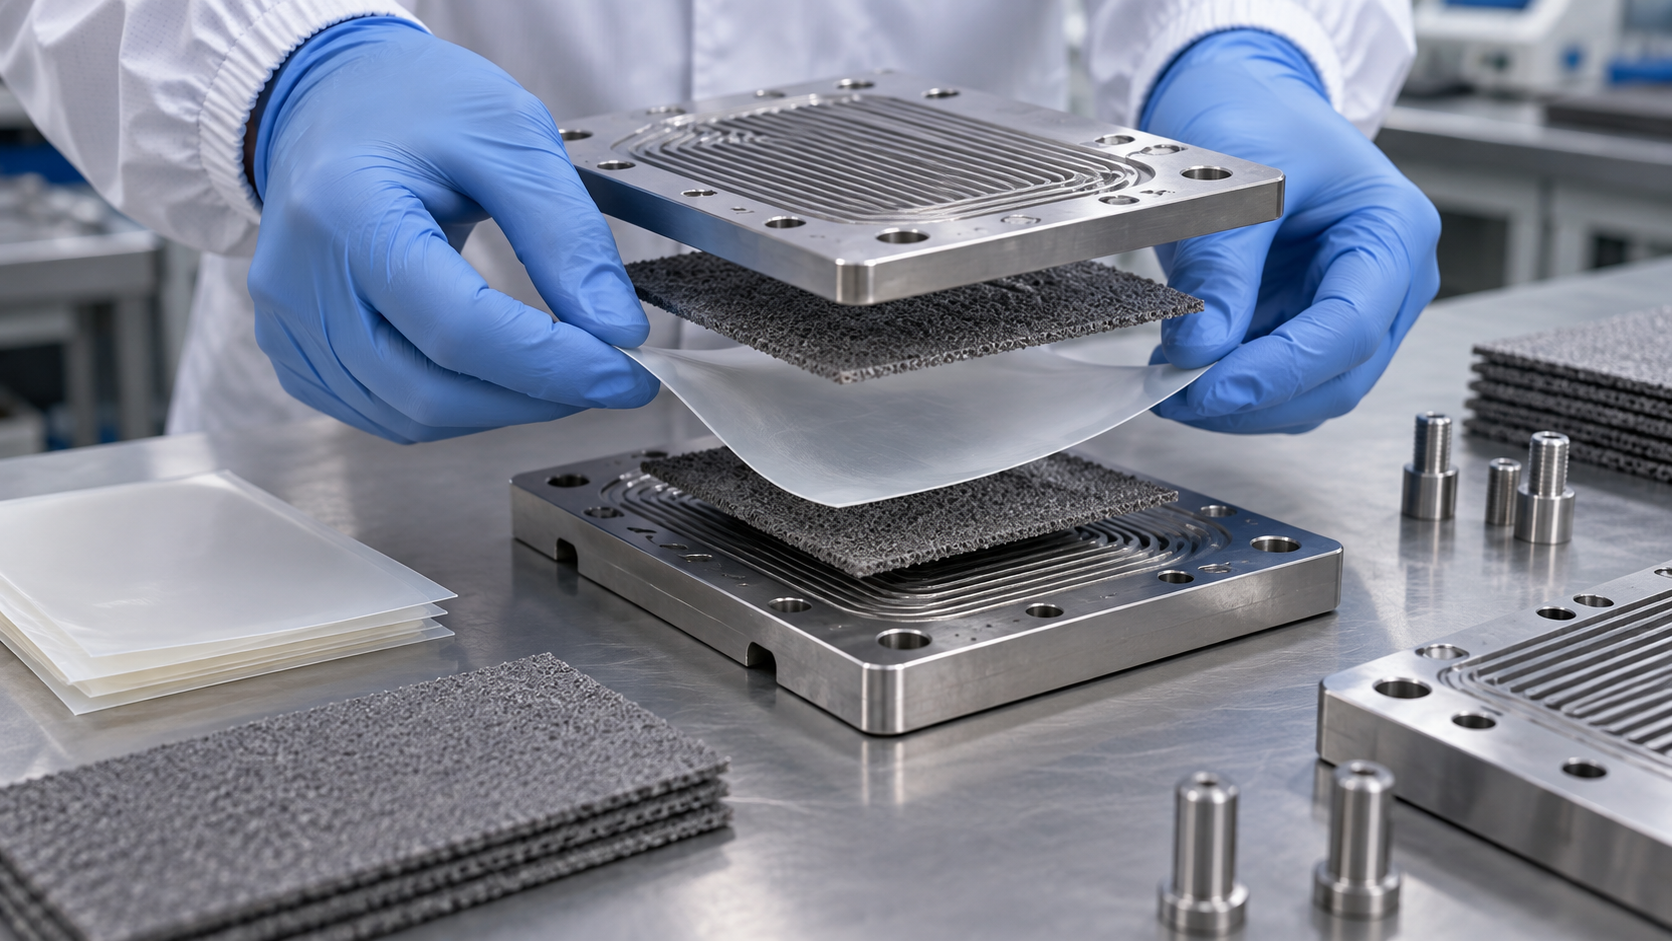
- What PEM electrolysis is (the short version)
- Reactions and cell structure — how water becomes hydrogen and oxygen
- Our calculation: cell voltage can be converted to kWh/kg
- A materials engineer’s view (1): the PFSA membrane — thinness versus hydrogen crossover, and the PFAS debate
- The catalyst: how many kilograms of iridium per gigawatt?
- A materials engineer’s view (2): less catalyst, higher current density, longer life — a three-way tug of war
- Titanium parts and precious-metal coatings
- Reading the numbers — do not mix targets, summaries and manufacturer values
- What degrades, and where
- Evaluation and standards — how to measure and compare
- Challenges and limits / Glossary / Primary sources / Claim-to-source audit
Sourced = a value or statement in published material (link given)
Our calculation = a figure this article derived, with the assumptions spelled out
Not yet confirmed = a plan, target or proposal with no confirmed result or adoption
Structural readings and materials-design interpretations are marked separately as Commentary.
Performance figures are given together with the level they apply to (single cell, stack or system; temperature, pressure, current density) and their status (laboratory, target or stated value).
Hydrogen is a flammable gas, and its handling is governed by laws and standards. This article explains materials, principles, evaluation and policy; it is not advice on handling or operating hydrogen equipment. It does not rank any product, company or country.
1. What PEM electrolysis is (the short version)
PEM stands for proton exchange membrane. It is a way of making hydrogen by electrolysing pure water with a solid polymer membrane as the electrolyte.
- A thin membrane: IRENA describes PEM electrolysers as using a thin (about 0.2 mm) PFSA membrane and electrodes designed for low resistanceSourced. The review by Babic et al. likewise says the thin polymer electrolyte allows 1–3 A/cm² and operation at a high differential pressureSourced
- Operating conditions: in IRENA’s 2020 summary, operating temperature is 50–80 °C and operating pressure is below 70 barSourced
- The materials problem: an acidic membrane, high potentials and oxygen evolution at the anode add up to a harsh oxidising environment. Titanium-based materials, noble-metal catalysts and protective coatings are needed, and IRENA says this makes PEM stacks more expensive than alkaline onesSourced
PEM electrolysis rests on an unusual set of materials: a fluorinated membrane, iridium, and titanium with platinum or gold coatings. Raising performance (higher current density), using less precious metal and keeping a long life pull against one another, so every number has to be read together with its conditions and its status (our commentary).
How PEM differs from alkaline, AEM and solid oxide electrolysis is covered in our explainers on alkaline water electrolysis, AEM water electrolysis and solid oxide electrolysis cells. The resource side of precious metals is in our explainer on platinum group metals and catalysts, the parts of the whole stack in our explainer on electrolyzer stacks and materials, and hydrogen cost in our explainer on the cost of hydrogen production.
2. Reactions and cell structure — how water becomes hydrogen and oxygen
At the anode, water splits into oxygen, protons (H⁺) and electrons. The protons cross the membrane to the cathode, where they combine with electrons to form hydrogen. The membrane must pass protons but block gases and electrons (the reactions and roles are textbook material, our commentary). Thermodynamically, the cell voltage needed when all the energy is supplied as electricity (the thermoneutral voltage) is 1.48 VSourced (the review by Babic et al. [Source 2]).
IRENA summarises the parts of the cell as followsSourced.
| Part | Example material (IRENA 2020) | Role | Materials difficulty |
|---|---|---|---|
| Electrolyte (membrane) | PFSA (perfluorosulfonic acid) membrane | Carries protons and separates the hydrogen and oxygen sides | Thinner means lower resistance but easier hydrogen crossover; chemical thinning |
| Anode catalyst (oxygen side) | Iridium oxide | Evolves oxygen | A scarce metal; it can dissolve; the amount must be cut |
| Cathode catalyst (hydrogen side) | Platinum nanoparticles on carbon | Evolves hydrogen | A platinum group metal; DOE states its targets as a total for anode and cathode |
| Porous transport layer (anode) | Platinum-coated sintered porous titanium | Delivers water, lets oxygen out, conducts electricity | An oxide film forms on the surface and raises contact resistance; a precious-metal coating is needed |
| Bipolar plate | Platinum-coated titanium on the anode side, gold-coated titanium on the cathode side | Connects neighbouring cells and forms flow channels | Titanium parts are a large share of the capital cost (Lettenmeier et al.) |
| Frames and seals | PTFE, PSU (polysulfone), ETFE | Keep liquid and gas from leaking | Fluoropolymers are used (see our explainer on fluoropolymers and PFAS) |
All Sourced (IRENA [Source 1] Table 1, Babic et al. [Source 2], Lettenmeier et al. [Source 6]). Materials vary widely by manufacturer and development stage; IRENA itself notes that conditions and components differ significantly between companies.
3. Our calculation: cell voltage can be converted to kWh/kg
“1.8 V” and “48 kWh/kg” carry the same information in different units. Once you have checked the conversion, figures quoted in different units can be read side by side.
One kilogram of hydrogen is 1000 ÷ 2.016 ≈ 496 mol. Making each molecule takes two electrons, so 992 mol of electrons. Multiplying by the Faraday constant, 96,485 C/mol, gives 9.57×10⁷ C; dividing by 3,600 C per Ah gives about 26,590 Ah. Assuming 100% current efficiency, electricity use = cell voltage × 26.59 kWh/kgOur calculation.
- 1.23 V (reversible voltage, commentary) → 32.7 kWh/kg
- 1.48 V (thermoneutral voltage) → 39.4 kWh/kg, which matches the higher heating value of hydrogen (about 39.4 kWh/kg)
- 1.8 V → 47.9 kWh/kg. Taking the lower heating value as about 33.3 kWh/kg, the voltage efficiency (LHV) is 33.3 ÷ 47.9 = about 69.6%, consistent with the DOE table entry “48 kWh/kg (69% LHV)”
- 1.9 V → 50.5 kWh/kg (65.9%) and 1.6 V → 42.5 kWh/kg (78.3%), consistent with DOE’s 51 (65%) and 43 (77%)
Assumptions and limits: 100% current efficiency (no hydrogen lost) and a lower heating value of 33.3 kWh/kg are assumptions set by this article. In reality some hydrogen crosses the membrane, so the same electricity yields slightly less hydrogen. The conversion also applies to the stack (cells stacked together), not to the whole system with rectifier, water purification and cooling.
Nel (Norway) literature for its MC series states a stack power consumption of 53.2 kWh/kg and a whole-system figure of 56.77 kWh/kg, both at 100% capacitySourced (manufacturer’s stated value; the footnotes to the sheet could not be retrieved). Applied to the conversion above, the stack averages about 2.0 V (assuming 100% current efficiency), which is a voltage efficiency of about 62.6% on an LHV basisOur calculation. The DOE table, for its part, gives 1.9 V (at 2.0 A/cm²) as the 2022 status and 1.8 V (at 3.0 A/cm²) as the 2026 targetSourced. These are numbers of different kinds, measured differently and at different levels, and they are not to be lined up as a ranking (Chapter 8 sorts this out).
4. A materials engineer’s view (1): the PFSA membrane — thinness versus hydrogen crossover, and the PFAS debate
The membrane in a PEM cell is a perfluorosulfonic acid (PFSA) polymer. IRENA footnotes PFSA as a sulfonated fluoropolymer copolymer based on polytetrafluoroethylene, and says the membrane is chemically and mechanically robust enough to tolerate a large differential pressureSourced. Babic et al. write that the membranes used in today’s state-of-the-art cells are relatively thick (5–7 mil, where 1 mil = 25.4 µm) PFSA membranes, with Nafion 115 and 117 as examplesSourced. In the experiments of Kim et al., Nafion N115 (127 µm, Chemours) and a Gore membrane, M275.80 (80 µm), were usedSourced.
Babic et al. state that thinner membranes allow a higher current density at a given cell voltage and so lower the investment in the stack, but bring challenges with gas crossoverSourced. They also say the lower bound of the usable current density is set by the limit of 2% hydrogen in oxygenSourced. At low current, oxygen production falls while the hydrogen leaking through the membrane barely changes, so the hydrogen share in the oxygen rises (this reasoning is our commentary). A thin membrane that wins efficiency therefore also narrows the range over which the plant can run when renewable output is low. IRENA lists one remedy, a catalyst that converts the permeated hydrogen back to waterSourced.
How this connects to the PFAS debate
PFSA is a fluorinated polymer. Because it contains –CF₂– units, applying the OECD definition makes it a PFAS (our reading; the definition is covered in our explainer on fluoropolymers and PFAS). In the EU PFAS restriction proposal, the background document updated by the five authorities in August 2025 lists “fuel cells and electrolysers” as a candidate for derogation, with a transition period of 13.5 years after entry into forceNot yet confirmed (overview by KemI, the Swedish Chemicals Agency [Source 8], updated 23 October 2025). The same document shows that the 2023 scope, “PEM fuel cells”, was broadened to all fuel cells and electrolysers.
This is the proposers’ draft, however. ECHA’s RAC adopted its final opinion in March 2026 and SEAC agreed its draft opinion the same month, but this article has not confirmed how the two committees treated electrolysers specifically. SEAC is expected to adopt its final opinion by the end of 2026, followed by a Commission proposal and a vote by Member States, so nothing has been adopted or entered into application (the stage confirmed on 2 October 2026 in our explainer on fluoropolymers and PFAS).
5. The catalyst: how many kilograms of iridium per gigawatt?
For the anode, the catalyst of choice in acid at high potential is currently iridium oxide. Babic et al. write that IrO₂ remains the material of choice because the dissolution and corrosion rate of ruthenium oxide is unacceptably highSourced. Iridium is scarce and is obtained as a by-product of platinum mining.
| Item | What is published | Source |
|---|---|---|
| Primary supply | World primary production in 2025 is about 7 tonnes; South Africa about 80%; open-loop recycling (recovering metal from used products for other uses) is “essentially none” | IPA factsheet (prepared by SFA Oxford) [Source 12] |
| Current loading | About 1–2 mg/cm² at the anode (per unit area) | Minke et al. (2021) [Source 3] |
| “Per GW” | “At 4 W/cm² and 2 mg/cm² Ir, state-of-the-art technology requires 500 kg Ir/GW” | Babic et al. (2017) [Source 2] |
| Preconditions | Meeting future demand requires (1) a dramatic reduction of iridium loading and (2) a recycling infrastructure with end-of-life recycling rates of at least 90% | Minke et al. (2021) [Source 3] |
| A company’s outlook | In December 2022 Johnson Matthey said that “as little as 1.5 tonnes of iridium per year” (around 20% of primary supply) could support more than 100 GW of green hydrogen capacity by 2030 | Johnson Matthey (2022) [Source 13] |
All Sourced. The Johnson Matthey figure is the company’s own view; the assumptions behind it cannot be seen in that statement.
Dividing loading (mg/cm²) by power density (W/cm²) gives g/kW. We use the three scenarios of Minke et al.Our calculation.
- 2 mg/cm² ÷ 3 W/cm² = 0.67 g/kW → 670 kg per GW (1 million kW), about 9.6% of 7 t
- 1 mg/cm² ÷ 3 W/cm² = 0.33 g/kW → 330 kg, about 4.7%
- 0.4 mg/cm² ÷ 8 W/cm² = 0.05 g/kW → 50 kg, about 0.7%
- Installing 10 GW a year would need 6.7 t, 3.3 t and 0.5 t respectively (96%, 47% and 7% of about 7 t)
Assumptions and limits: the three pairs (loading and power density) are scenarios set by Minke et al. and are not values of any real product. The 7 t is an estimate of primary supply for all uses, not an amount reserved for PEM electrolysis. Recycling, other precious metals (such as platinum) and replacement over equipment life are not considered.
DOE’s target table follows the same logic. DOE gives targets for the total of platinum group metals (anode plus cathode): 3.0 mg/cm² (0.8 g/kW) as the 2022 status, 0.5 mg/cm² (0.1 g/kW) as the 2026 target and 0.125 mg/cm² (0.03 g/kW) as the ultimate targetSourced. Dividing mg/cm² by current density times voltage gives g/kW (3.0 ÷ (2.0 × 1.9) ≈ 0.79; 0.5 ÷ (3.0 × 1.8) ≈ 0.093; 0.125 ÷ (3.0 × 1.6) ≈ 0.026), which matches DOE’s own g/kW columnOur calculation.
How can the amount be cut? Bernt et al. state that, to bring iridium down to a level commensurate with large-scale deployment, highly structured catalysts with a low packing density are required, with activity measured by rotating disk electrode and stability by accelerated stress tests at the membrane electrode assembly (MEA) levelSourced. As a laboratory example, Kim et al. coated iridium oxide with TiO₂ by atomic layer deposition. In a single cell at 80 °C, 3.0 A/cm² and Ir 0.4 mg/cm², a test that cycled operation and rest showed almost no voltage degradation over 2600 h, whereas uncoated iridium oxide kept losing voltage at 31.5 mV/kh over 1000 hSourced (2026; a laboratory single-cell result, not the lifetime of a commercial system).
6. A materials engineer’s view (2): less catalyst, higher current density, longer life — a three-way tug of war
As the Chapter 5 calculation shows, g/kW = loading ÷ power density. To lower it you can either reduce the numerator (loading) or raise the denominator (power density, i.e. current density times voltage).
- Raise the current density: more hydrogen from the same area, so g/kW falls, and so does the amount of membrane and titanium. But IRENA says that higher temperature, pressure and current density hurt lifetime, contrasting mild conditions (50–60 °C, 10 bar, 2 A/cm²) with demanding next-generation ones (80 °C, 70 bar, 5 A/cm²)Sourced
- Reduce the loading: the thinner and sparser the catalyst layer, the more dissolution and detachment matter. IRENA lists, as a design for harsh conditions, more than 5 mg/cm² (2.5 g/kW) of iridium and extra precious metal in protective layers as a way of protecting the cell by thicknessSourced
In short, adding precious metal to protect life, and removing it at the cost of life, is the tension at the centre of development in this field (our commentary). This is why catalyst papers should report, along with initial performance, the degradation rate (mV/kh), test duration, loading, current density and temperature.
7. Titanium parts and precious-metal coatings
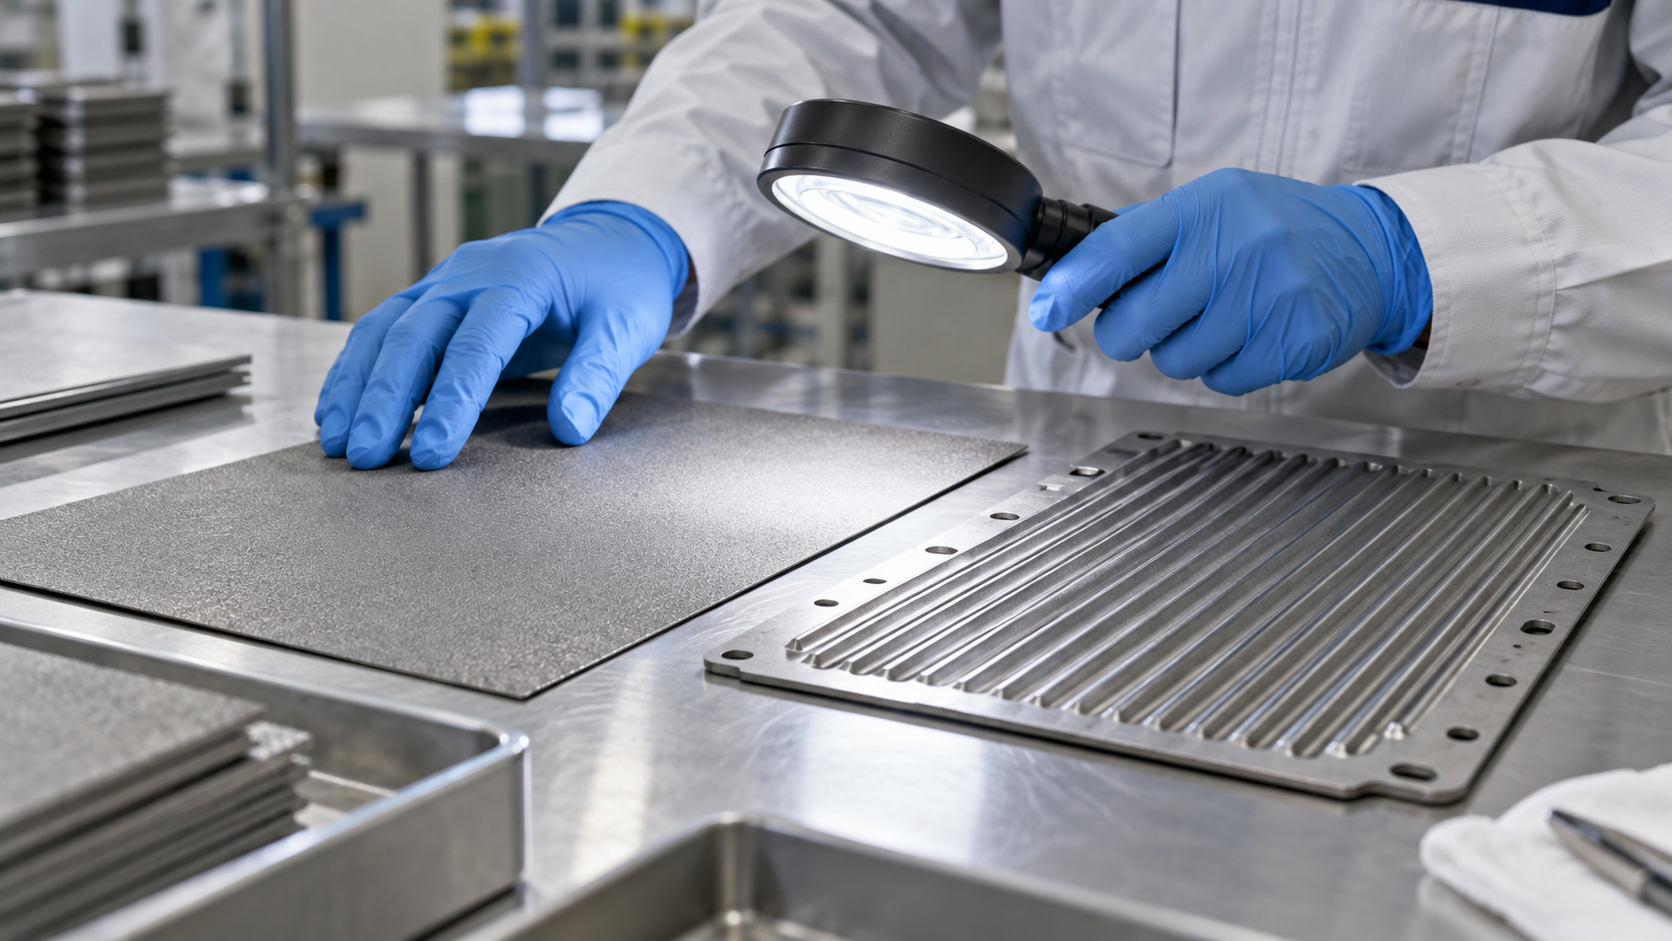
On the anode side, it is not only the catalyst: the surrounding metal parts are also designed to depend on precious metals. Babic et al. write that, because of the high electrochemical potential, the choice of anode materials is usually limited to titanium-based porous materials (sintered powder, fibre or mesh)Sourced.
- The fate of titanium: an oxide layer forms on the surface and, over time, electrical conductivity and cell performance fall, say Babic et al.Sourced
- Precious-metal coatings: IRENA describes an anode porous layer of titanium over 1 mm thick that supports the membrane (for differential-pressure operation), typically coated with more than 1 mg/cm² (0.5 g/kW) of platinum to limit titanium oxidationSourced. The bipolar plate on the cathode side is gold-coated titanium
- Where the cost sits: Lettenmeier et al. say that titanium-based components such as bipolar plates make the largest contribution to capital cost. As an alternative they coated stainless steel plates with Nb (sputtering) and Ti (plasma spraying, 50 µm). The Nb layer, 50 times thinner, cut contact resistance by almost an order of magnitude, and the plates withstood the anode environment for more than 1000 hSourced (a simplified laboratory evaluation)
- Hopes for cheaper metals: Babic et al. say that with suitable coatings such as TiN, Pt or Au, stainless steel might also become usable, but that the effectiveness in electrolysis operation is still being investigatedSourced
The precious metals in a PEM cell are not just iridium at the anode and platinum at the cathode. In IRENA’s summary, platinum is used on the anode porous layer and bipolar plate, and gold on the cathode-side bipolar plateSourced. Leave the parts out and “g/kW” is misjudged.
Replacing titanium with cheaper metals such as stainless steel means solving two problems at once: corrosion of the substrate itself and contact resistance at the surface. The Lettenmeier example is worth reading as materials design because it separates the roles: a protective layer (Ti) and a layer that carries current (Nb) (our commentary). For defects in such coatings (pinholes), thickness and adhesion, the thinking in our explainer on barrier properties and coatings applies directly.
8. Reading the numbers — do not mix targets, summaries and manufacturer values
The “performance” of PEM electrolysis means different things in different sources. The table below sets three kinds of source side by side, each at its own level.
| Item | DOE table (2022 status → 2026 target → ultimate target) | IRENA summary (December 2020) | Nel MC series (manufacturer’s stated values) |
|---|---|---|---|
| What the number is | A status and targets for the stack (cell). Performance, durability and capital-cost targets must be met simultaneously; electricity at or below 0.03 $/kWh and availability above 90% assumed | A summary of the state of the art in 2020 (IRENA analysis) | A product sheet for modular systems (MC1000 to MC4000, 5–20 MW class) |
| Current density and voltage | 2.0 A/cm² at 1.9 V → 3.0 A/cm² at 1.8 V → 3.0 A/cm² at 1.6 V | Nominal current density 1–2 A/cm², voltage range 1.4–2.5 V | Not stated (footnotes could not be retrieved) |
| Electricity use | Stack 51 → 48 → 43 kWh/kg; system 55 → 51 → 46 kWh/kg | Stack 47–66, system 50–83 kWh/kg | Stack 53.2, system 56.77 kWh/kg (at 100% capacity) |
| Platinum group metals (total) | 3.0 → 0.5 → 0.125 mg/cm² (0.8 → 0.1 → 0.03 g/kW) | Not stated (design example for harsh conditions: Ir above 5 mg/cm²) | Not stated |
| Degradation and life | Average degradation 4.8 → 2.3 → 2.0 mV/kh; lifetime 40,000 → 80,000 → 80,000 h (end of life = 10% voltage increase) | Stack lifetime 50,000–80,000 h (2020 range); reliability of MW-scale stacks “still to be validated” | Not stated |
| Operating conditions | Not stated (a targets table) | 50–80 °C; pressure below 30 bar (Table 6) or below 70 bar (Table 1); load range 5–120% | Delivery pressure 30 barg; turndown 20–100%; start-up under 8 min; hydrogen purity 99.95% (standard; conformity to ISO 14687:2019 Type I/II Grade D is stated) |
All Sourced (DOE [Source 4], IRENA [Source 1], Nel [Source 7]). DOE and IRENA figures are on different scales and the Nel figures come from a product sheet; no ranking can be drawn from this table. IRENA’s Tables 1 and 6 give different upper pressure limits (below 70 bar and below 30 bar).
- Which level? Single cell (laboratory), stack, or system (with rectifier, water purification and cooling). Nel’s gap between stack and system (53.2 → 56.77 kWh/kg) is one example (about 6.7% more, our calculation)
- Which status? Laboratory (the 2600 h of Kim et al.), target (DOE), summary (IRENA) or product statement (Nel)
- Which point in time? Beginning-of-life value or end-of-life? DOE defines end of life as a 10% voltage increase
- Which conditions? Temperature, pressure, current density, water quality, and constant or variable load
- Which heating-value basis? LHV or HHV? 1.48 V is on an HHV basis, and the same voltage looks about 15 percentage points lower on an LHV basis (84.6%, our calculation)
9. What degrades, and where
| Where | What happens | Source and conditions |
|---|---|---|
| Membrane | Chemical attack breaks polymer chains and removes functional groups (sulfonic acid groups); the membrane thins | Babic et al. (review). A large differential pressure lowers mechanical stability and raises gas permeation (IRENA) |
| Anode catalyst | Iridium oxide can dissolve, depending on temperature, voltage and electrode architecture | IRENA. One remedy is a larger amount of catalyst |
| Anode titanium | An oxide film grows, electrical conductivity falls and performance drops | Babic et al. A platinum coating limits oxidation (IRENA) |
| Feed water | Sensitive to iron, copper, chromium, sodium and the like. Poor water quality is one of the main reasons for stack failure; degradation shows at part load | IRENA (assumes ASTM type II water) |
| Load variation | Coupling to renewables makes voltage fluctuate, which in principle could promote corrosion, but IRENA says there is “little evidence” of this in electrolysers | IRENA (statement as of 2020) |
| An example of stabilisation | Coating iridium oxide with TiO₂ kept voltage degradation small even at Ir 0.4 mg/cm² and 3 A/cm² | Kim et al. (2026), laboratory single cell, 80 °C |
All Sourced (IRENA [Source 1], Babic et al. [Source 2], Kim et al. [Source 5]). Published degradation rates for long-term operation of real plants could not be confirmed from primary sources within the scope of this article, so none is given.
The speed of degradation depends on different conditions in different places. IRENA names differential pressure for the membrane, temperature, voltage and electrode architecture for the anode, and impurities for the feed water. A single figure such as “50,000 hours of life” therefore has no meaning unless it says which degradation dominates and under which conditions it was measured (our commentary).
10. Evaluation and standards — how to measure and compare
- The international safety standard: ISO 22734:2019, “Hydrogen generators using water electrolysis — Industrial, commercial, and residential applications”, has been withdrawn and replaced by ISO 22734-1:2025 (Part 1: Safety), published in July 2025Sourced (ISO, checked 5 October 2026). The scope of the old edition covered generators with ion-transport media of aqueous bases, aqueous acids, PEM and AEM. The text is paid, so we limit ourselves to the title and scope
- Testing for grid services: ISO/WD TS 22734-2, “Part 2: Testing guidance for performing electricity grid service”, is under development with a focus on alkaline and PEM electrolysers (working-draft stage)Not yet confirmed (ISO, checked 5 October 2026)
- Test methods for performance and durability: the European Commission’s Joint Research Centre (JRC) published a report (EUR 30752 EN, 2021) setting out harmonised operating conditions, testing protocols and procedures for low-temperature water electrolysis (PEM, AEM and alkaline)Sourced. It was written so that results from different laboratories and manufacturers can be compared
Catalyst papers are often measured on rotating disk electrodes or in small single cells, in pure water or sulfuric acid, which differs from plant operation. That is why Bernt et al. ask for the two to be used for different purposes: RDE for activity and MEA-level accelerated stress tests for stabilitySourced. Before reading a laboratory result as product life, check which test level and which conditions it comes from; the JRC harmonised protocols exist to put conditions on a common footing (our commentary).
11. Challenges and limits
(1) Published long-term degradation rates for real plants could not be confirmed
IRENA, which this article uses, says the reliability and lifetime of MW-scale PEM stacks still have to be validatedSourced. Long-term test papers exist, but within the scope of this article no primary source for the degradation rate of a commercial system could be confirmed, so no figure is given.
(2) Membrane manufacturer data sheets could not be confirmed
The manufacturer’s site for the membrane (Nafion) did not accept automated retrieval, so its data sheets could not be checked. Membrane thicknesses are limited to what is stated in peer-reviewed papers (Babic et al., Kim et al.).
(3) The treatment of electrolysers in the PFAS restriction is not settled
In the EU restriction proposal, the derogation for electrolysers (13.5 years) is the draft of the five authoritiesNot yet confirmed. How RAC and SEAC treated it individually, the Commission’s proposal and the Member States’ vote could not be confirmed at the time of writing.
(4) What is not covered
Comparisons with other technologies (cost, scale, installed base), membranes other than PEM (such as hydrocarbon types), research on substitutes for iridium such as ruthenium-based catalysts, the state of deployment in China and elsewhere, and the handling of hydrogen are not covered.
- PEM electrolysis uses a PFSA membrane about 0.2 mm thick and can run at 1–3 A/cm²Sourced
- Multiplying cell voltage by 26.59 gives kWh/kg (100% current efficiency); 1.8 V is about 47.9 kWh/kgOur calculation
- Iridium: 670 kg per GW in a scenario of 2 mg/cm² and 3 W/cm², about 9.6% of the roughly 7 t of world primary supplyOur calculation
- Precious metals are not only Ir and Pt. Platinum and gold coatings are used on the titanium parts at the anode side tooSourced
- Less loading, higher current density and long life pull against each other. Read numbers together with conditions, status and level
- The derogation (13.5 years) proposed for electrolysers in the PFAS restriction is at the proposal stageNot yet confirmed
12. Glossary
- PEM
- Proton exchange membrane: a solid polymer membrane that conducts protons.
- PFSA
- Perfluorosulfonic acid: a polymer with a fluorinated backbone and sulfonic acid groups. Nafion is the best-known example.
- MEA
- Membrane electrode assembly: a membrane with catalyst layers on both sides.
- PTL
- Porous transport layer: a porous plate that passes water and gas and carries current.
- Bipolar plate
- A plate that joins neighbouring cells and carries flow channels.
- OER / HER
- Oxygen evolution reaction / hydrogen evolution reaction.
- Thermoneutral voltage
- The voltage at which the reaction runs on electricity alone with no added heat: 1.48 V (higher heating value basis).
- LHV / HHV
- Lower / higher heating value: about 33.3 / 39.4 kWh per kg of hydrogen.
- Crossover
- Hydrogen or oxygen passing through the membrane to the other side.
- mV/kh
- Rise in cell voltage per 1000 hours: the unit of degradation rate.
- g/kW
- Amount of precious metal per kW of output: loading divided by power density.
- RDE
- Rotating disk electrode: a small-scale way of measuring catalyst activity.
13. Primary sources
- IRENA “Green hydrogen cost reduction: Scaling up electrolysers to meet the 1.5°C climate goal”, December 2020 (PDF) — irena.org
- Babic U et al. “Critical Review—Identifying Critical Gaps for Polymer Electrolyte Water Electrolysis Development”, J. Electrochem. Soc. 164(4), F387–F399 (2017, peer-reviewed) — doi.org/10.1149/2.1441704jes
- Minke C et al. “Is iridium demand a potential bottleneck in the realization of large-scale PEM water electrolysis?”, Int. J. Hydrogen Energy 46(46), 23581–23590 (2021, peer-reviewed) — doi.org/10.1016/j.ijhydene.2021.04.174
- U.S. Department of Energy (DOE) “Technical Targets for Proton Exchange Membrane Electrolysis” (Hydrogen and Fuel Cell Technologies Office; viewed 5 October 2026) — energy.gov
- Kim ET et al. “Dual-interface stabilization of low-iridium anodes for durable proton exchange membrane water electrolysis”, Nature Communications 17, 6818 (2026, peer-reviewed) — doi.org/10.1038/s41467-026-75113-6
- Lettenmeier P et al. “Low-Cost and Durable Bipolar Plates for Proton Exchange Membrane Electrolyzers”, Scientific Reports 7, 44035 (2017, peer-reviewed) — doi.org/10.1038/srep44035
- Nel Hydrogen “MC Series Modular Plants” product sheet PD 0600 0145 Rev A (October 2025, PDF) — nelhydrogen.com
- KemI (Swedish Chemicals Agency) and the other four authorities “What you need to know about the updated PFAS restriction dossier”, updated 23 October 2025 (PDF) — kemi.se
- ISO “ISO 22734-1:2025 Hydrogen generators using water electrolysis — Part 1: Safety” — iso.org
- ISO “ISO 22734:2019 Hydrogen generators using water electrolysis — Industrial, commercial, and residential applications” (withdrawn) — iso.org
- European Commission JRC Tsotridis G, Pilenga A, “EU harmonised protocols for testing of low temperature water electrolysers”, EUR 30752 EN (2021) — publications.jrc.ec.europa.eu
- IPA (International Platinum Group Metals Association) “PGM Fact Sheet: Iridium”, prepared by SFA (Oxford), May 2026 (PDF) — ipa-news.com
- Johnson Matthey “Johnson Matthey responds to new report on critical material supply for clean hydrogen”, 14 December 2022 — matthey.com
- Bernt M et al. “Current Challenges in Catalyst Development for PEM Water Electrolyzers”, Chem. Ing. Tech. 92(1–2), 31–39 (2020, peer-reviewed) — doi.org/10.1002/cite.201900101
14. Claim-to-source audit
| Claim in the text | Basis | Label |
|---|---|---|
| That PEM electrolysers use a PFSA membrane about 0.2 mm thick; that PFSA is footnoted as a sulfonated fluoropolymer copolymer based on polytetrafluoroethylene; that operating temperature is 50–80 °C and pressure below 70 bar; the component list (PFSA membrane, iridium oxide, platinum on carbon, platinum-coated sintered porous titanium, platinum-coated and gold-coated titanium bipolar plates, PTFE/PSU/ETFE frames and seals); that titanium-based materials, noble-metal catalysts and protective coatings are needed and make stacks dearer than alkaline ones; that anode iridium oxide can dissolve depending on temperature, voltage and electrode architecture, with remedies such as over 5 mg/cm² (2.5 g/kW) of catalyst, over 1 mm of porous titanium and over 1 mg/cm² (0.5 g/kW) of platinum coating; mild conditions (50–60 °C, 10 bar, 2 A/cm²) versus next-generation conditions (80 °C, 70 bar, 5 A/cm²); sensitivity to iron, copper, chromium and sodium in water, and water quality as a main reason for failure; that differential pressure lowers membrane mechanical stability and raises gas permeation, and a catalyst can recombine permeated hydrogen; that evidence of load-variation corrosion in electrolysers is slight; that the reliability and lifetime of MW-scale stacks need validating; the 2020 summary values (nominal current density 1–2 A/cm², voltage 1.4–2.5 V, stack 47–66 and system 50–83 kWh/kg, lifetime 50,000–80,000 h, load range 5–120%) | IRENA (December 2020)[Source 1] https://www.irena.org/-/media/Files/IRENA/Agency/Publication/2020/Dec/IRENA_Green_hydrogen_cost_2020.pdf | Sourced |
| That the thin polymer electrolyte allows 1–3 A/cm² and a high differential pressure; that the thermoneutral voltage is 1.48 V; that state-of-the-art cells use relatively thick (5–7 mil) PFSA membranes such as Nafion 115 and 117; that thinner membranes allow higher current density and lower stack investment but bring crossover challenges; that the lower bound of current density is set by 2% hydrogen in oxygen; that the anode choice is usually limited to titanium-based porous materials; that coatings such as TiN, Pt and Au might make stainless steel usable; that an oxide layer on titanium lowers conductivity; that IrO₂ is the material of choice and RuO₂ dissolves unacceptably fast; “at 4 W/cm² and 2 mg/cm² Ir, 500 kg Ir/GW” | Babic et al. (2017, peer-reviewed)[Source 2] https://doi.org/10.1149/2.1441704jes | Sourced |
| That current iridium loading is about 1–2 mg/cm²; the three scenarios of 0.67 g/kW (2 mg/cm² at 3 W/cm²), 0.33 g/kW (1 mg/cm² at 3 W/cm²) and 0.05 g/kW (0.4 mg/cm² at 8 W/cm²), labelled “2020 status”, “2020 target” and “2035 target”; that meeting future demand requires a large cut in loading and recycling with at least 90% end-of-life recovery | Minke et al. (2021, peer-reviewed)[Source 3] https://doi.org/10.1016/j.ijhydene.2021.04.174 | Sourced |
| Every item in the DOE table (total platinum group metals 3.0/0.5/0.125 mg/cm² and 0.8/0.1/0.03 g/kW; 2.0 A/cm² at 1.9 V, 3.0 A/cm² at 1.8 V, 3.0 A/cm² at 1.6 V; stack 51/48/43 kWh/kg (65/69/77% LHV); system 55/51/46 kWh/kg; degradation 4.8/2.3/2.0 mV/kh; lifetime 40,000/80,000/80,000 h) and the conditions that targets be met simultaneously, electricity at or below 0.03 $/kWh, availability above 90%, and end of life at a 10% voltage increase | U.S. DOE (viewed 5 October 2026)[Source 4] https://www.energy.gov/eere/fuelcells/technical-targets-proton-exchange-membrane-electrolysis | Sourced |
| That in a single cell at Ir 0.4 mg/cm², 3.0 A/cm² and 80 °C there was almost no degradation over 2600 h (a cyclic operation-and-rest protocol); that uncoated IrO₂ degraded at 31.5 mV/kh over 1000 h; that Nafion N115 (127 µm, Chemours) and Gore M275.80 (80 µm) were used for the MEAs | Kim et al. (2026, Nature Communications)[Source 5] https://doi.org/10.1038/s41467-026-75113-6 | Sourced |
| That titanium-based components such as bipolar plates make the largest contribution to capital cost; that a stainless steel plate coated with Nb (PVD) and Ti (vacuum plasma spraying, 50 µm) had an Nb layer 50 times thinner that cut contact resistance by almost an order of magnitude and endured the anode environment for over 1000 h | Lettenmeier et al. (2017, Scientific Reports)[Source 6] https://doi.org/10.1038/srep44035 | Sourced |
| That the Nel MC series stack uses 53.2 kWh/kg (4.7 kWh/Nm³) and the system 56.77 kWh/kg (5.04 kWh/Nm³) at 100% capacity; delivery pressure 30 barg; turndown 20–100%; start-up under 8 min; hydrogen purity 99.95% with conformity to ISO 14687:2019 Type I/II Grade D stated | Nel Hydrogen product sheet (manufacturer’s stated value, October 2025 edition)[Source 7] https://nelhydrogen.com/wp-content/uploads/2025/10/MC-Series-Modular-Plants-PD-0600-0145-Rev-A-1.pdf | Sourced |
| That the updated background document of the EU PFAS restriction proposal suggests a 13.5-year transition after entry into force for “fuel cells and electrolysers” (6.k), broadened from PEM fuel cells in the 2023 report | Overview by KemI and the other four authorities (updated 23 October 2025). This is the proposers’ draft and has not been adopted or applied[Source 8] https://www.kemi.se/download/18.64e3bd9619a0f45982cfff/1761213262828/What%20you%20need%20to%20know%20about%20the%20updated%20PFAS%20restriction%20dossier-Updated-2025-10-23.pdf | Not yet confirmed |
| That ISO 22734:2019 was withdrawn and replaced by ISO 22734-1:2025 (Part 1: Safety, July 2025); the scope of the old edition (aqueous bases, aqueous acids, PEM and AEM) | ISO pages (checked 5 October 2026)[Source 9] https://www.iso.org/standard/82766.html [Source 10] https://www.iso.org/standard/69212.html | Sourced |
| That ISO/WD TS 22734-2 (testing guidance for grid services) is under development | ISO search results (checked 5 October 2026, working-draft stage); whether it is published is not yet confirmed[Source 9] https://www.iso.org/standard/82766.html | Not yet confirmed |
| That the JRC published a report (EUR 30752 EN, 2021) on harmonised operating conditions, testing protocols and procedures for low-temperature water electrolysis (PEM, AEM, alkaline) | JRC Publications Repository[Source 11] https://publications.jrc.ec.europa.eu/repository/handle/JRC122565 | Sourced |
| That world primary iridium production in 2025 is about 7 tonnes, South Africa about 80%, and open-loop recycling essentially none | IPA factsheet (prepared by SFA Oxford, May 2026)[Source 12] https://ipa-news.com/assets/pdfs/factsheets/2026-05-ipa-iridium-factsheet.pdf | Sourced |
| That Johnson Matthey said 1.5 tonnes of iridium a year (around 20% of primary supply) could support more than 100 GW of capacity by 2030 | Johnson Matthey statement (14 December 2022). The company’s own view; its assumptions are not confirmed[Source 13] https://matthey.com/johnson-matthey-responds-to-new-report-on-critical-material-supply-for-clean-hydrogen | Not yet confirmed |
| That reducing iridium needs highly structured catalysts with a low packing density, with activity assessed by rotating disk electrode and stability by MEA-level accelerated stress tests | Bernt et al. (2020, abstract of the peer-reviewed paper)[Source 14] https://doi.org/10.1002/cite.201900101 | Sourced |
| The conversion voltage × 26.59 = kWh/kg (1 kg of hydrogen = 496 mol, two electrons, Faraday constant 96,485 C/mol, 100% current efficiency); 1.23 V → 32.7, 1.48 V → 39.4, 1.6 V → 42.5, 1.8 V → 47.9, 1.9 V → 50.5, 2.0 V → 53.2 kWh/kg; voltage efficiency on an LHV of 33.3 kWh/kg (69.6% at 1.8 V, for example); back-calculation from Nel’s stack 53.2 kWh/kg to an average of about 2.0 V and about 62.6% LHV; the stack-to-system gap (56.77 ÷ 53.2 = about 6.7% more); the 84.6% LHV efficiency at 1.48 V | Our calculation. 100% current efficiency and an LHV of 33.3 kWh/kg are assumptions set by this article; the values are for stacks, not systems. We confirmed that they are consistent with the DOE table | Our calculation |
| g/kW = loading ÷ power density; from 0.67, 0.33 and 0.05 g/kW, 670, 330 and 50 kg per GW and 9.6%, 4.7% and 0.7% of about 7 t; 6.7, 3.3 and 0.5 t (96%, 47%, 7%) for 10 GW a year; that DOE’s mg/cm² divided by current density times voltage (0.79, 0.093, 0.026 g/kW) matches DOE’s g/kW column | Our calculation. The three pairs are Minke et al.’s scenarios, not real product values; 7 t is total primary supply for all uses, not a PEM-only quota; recycling, other precious metals and equipment replacement are not considered | Our calculation |
| Long-term degradation rates of commercial systems; the Nafion manufacturer’s data sheet; how RAC and SEAC treated electrolysers in their opinions on the PFAS restriction | Could not be confirmed from primary sources within the scope of this article, so none is stated | Commentary |
| The reactions and the 1.23 V reversible voltage; the reasoning that membrane thickness affects the lower end of the operating range; the three-way tug of war (loading, current density, life); the reading that parts as well as Ir must be counted for precious metals; the five checks when reading a number | Our summary and commentary based on published content. Not views expressed by any of the institutions | Commentary |
| That Fig. 2, Fig. 3, Fig. 4 and Fig. 6 are explanatory drawings rather than real design or measurement diagrams, and that Fig. 1 and Fig. 5 are AI-generated images | Our note | Commentary |
Last updated 6 October 2026. Sources are limited to primary material (official documents of international bodies, governments, standards bodies and manufacturers, and peer-reviewed papers). Because the article includes structural readings and materials-design interpretations, those are marked as Commentary and kept separate from sourced fact. Long-term degradation rates of commercial systems, the membrane manufacturer’s data sheet and the committees’ treatment of electrolysers in the PFAS restriction could not be confirmed and are not stated. The table in Chapter 8 sets side by side numbers of different origin, status and level and is not a ranking. All figures are explanatory concept graphics. Fig. 2, Fig. 3, Fig. 4 and Fig. 6 are vector drawings and Fig. 1 and Fig. 5 are AI-generated images; none of them shows a real cross-section, equipment or product.