TECHNOLOGY EXPLAINER
Platinum Group Metals and Catalysts
— why metals used by the gram constrain how far hydrogen can scale
The electrodes of water electrolyzers and fuel cells use platinum group metals (PGMs), chiefly iridium, platinum and ruthenium. The amounts are on the order of grams per kilowatt, but iridium is a metal with a very small market: world mine output is reported at about 7 tonnes a year. This article sets out, from a materials engineer's viewpoint, where each metal is used and in what amount, how it degrades, how far the quantity can be cut, and what can replace it. It is not investment or procurement advice.
- Platinum group metals and hydrogen technology (the short version)
- Where each metal is used — electrolysis and fuel cells
- Reading the loading numbers — our calculation: linking mg/cm² and g/kW
- A materials engineer's view (1): iridium is chosen for resistance to dissolution, not for activity
- Catalyst supports and degradation — what happens inside the layer
- Resource constraints — our calculation: how many gigawatts of iridium exist?
- A materials engineer's view (2): a by-product metal does not grow when demand does
- Recycling — closed loops and open loops
- Where non-precious-metal catalysts stand
- Link to silicones and adhesives: platinum is used elsewhere too
- Challenges, and what we could not confirm
- Glossary / References / Claim-to-source audit
Sourced = stated in published material (link given)
Our calculation = a figure this article derived, with the assumptions spelled out
Not yet confirmed = a plan or target with no confirmed record of achievement
Structural readings and materials-design interpretations are marked separately as Commentary, and weakly supported ideas are labelled Inference.
Precious-metal prices and supply fluctuate. The prices and production figures here are values from public documents and industry-association material at the time of writing, not forecasts and not investment or procurement advice. Nor is this advice on handling hydrogen or oxygen.
1. Platinum group metals and hydrogen technology (the short version)
The platinum group metals (PGMs) are six elements: platinum (Pt), palladium, rhodium, ruthenium (Ru), iridium (Ir) and osmium. USGS reports them together under "platinum-group metals" in its statisticsSourced [Reference 13]. In hydrogen technology the leading roles go to three of them: iridium, platinum and ruthenium.
- PEM water electrolysis: the standard is iridium-oxide-based catalyst at the anode (where oxygen evolves) and carbon-supported platinum at the cathode (where hydrogen evolves). Ru is used in combination with Ir in some casesSourced [References 3, 5, 11, 21]
- Polymer electrolyte fuel cells (PEFC): platinum-based catalysts on both electrodes, with the oxygen-reducing cathode accounting for most of the amountSourced [References 2, 9]
- Alkaline, AEM and solid oxide electrolysis: the catalysts are mainly nickel and other non-precious metals; PGMs are not the main materialSourced [Reference 3]
The problem is less that PGMs are expensive than that annual iridium output is orders of magnitude small against a large build-out of electrolyzers. In IPA material, world primary iridium supply is about 7 tonnes a year, roughly constant from 2019 to 2025Sourced [Reference 10]. How far electrolyzers can scale is bounded by this number multiplied by the iridium used per kilowatt (g/kW).
2. Where each metal is used — electrolysis and fuel cells
The IRENA table (2020) lists the catalysts of the four electrolyzer types. PEM has iridium oxide on the oxygen side and carbon-supported platinum nanoparticles on the hydrogen side; alkaline has nickel-coated stainless steel; AEM has high-surface-area nickel or nickel-iron-cobalt alloys; and solid oxide has perovskite-type oxides (oxygen side) and Ni/YSZ (hydrogen side)Sourced [Reference 3]. The JRC report likewise gives IrOx and IrOx-RuOy as anode catalysts and Pt as cathode catalyst for PEM [Reference 21]. IPA's ruthenium material says Ru is increasingly used with Ir in PEM water electrolysis catalysts, explaining that "ruthenium confers higher activity while iridium confers higher durability" [Reference 11].
3. Reading the loading numbers — our calculation: linking mg/cm² and g/kW
Catalyst quantity is written in two units: the loading per electrode area (mg/cm²) and the amount per unit of equipment power (g/kW). They are linked by the power density per area. The DOE PEM electrolysis target table carries bothSourced [Reference 1].
| Item (PEM electrolysis, both electrodes combined) | 2022 status | 2026 target | Ultimate target |
|---|---|---|---|
| PGM loading (mg/cm²) | 3.0 | 0.5 | 0.125 |
| PGM amount (g/kW) | 0.8 | 0.1 | 0.03 |
| Cell performance | 2.0 A/cm² @ 1.9 V | 3.0 A/cm² @ 1.8 V | 3.0 A/cm² @ 1.6 V |
| Degradation rate (mV/kh) | 4.8 | 2.3 | 2.0 |
DOE technical target table for PEM electrolysis [Reference 1]. "PGM" is the sum of both electrodes; DOE's note says iridium accounts for much of the PGM content but platinum is also present in the cathode. The 2022 status rests on analysis in the H2NEW consortium.
We check that the numbers in the DOE tables are consistentOur calculation.
- Conversion: g/kW = loading (g/cm²) ÷ power density (kW/cm²). Power density = current density × cell voltage.
- PEM electrolysis (2022 status): 2.0 A/cm² × 1.9 V = 3.8 W/cm² = 0.0038 kW/cm². Dividing 3.0 mg/cm² = 0.0030 g/cm² gives 0.0030 ÷ 0.0038 = about 0.79 g/kW (the DOE table says 0.8).
- PEM electrolysis (2026 target): 3.0 A/cm² × 1.8 V = 5.4 W/cm². 0.5 mg/cm² ÷ 5.4 W/cm² = about 0.093 g/kW (the DOE table says 0.1).
- Fuel cell (DOE electrocatalyst table, 2015 status): PGM loading 0.13 mg/cm². Power density is 810 mW/cm² (150 kPa) from the MEA table [Reference 2]. 0.13 ÷ 0.81 = about 0.16 g/kW (the DOE table says 0.16).
- Electrolysis versus fuel cell: per area, 3.0 ÷ 0.13 = about 23 times; per power, 0.8 ÷ 0.16 = 5 times.
Assumptions and limits: the "kW" of an electrolyzer is electrical input and that of a fuel cell is output, so the same unit points in opposite directions. The DOE electrolysis status is from analysis in progress (the note at the time of writing says it would be published as a DOE Program Record), and the fuel cell value is a 2015 status (DOE notes it rests on a 3M MEA). This is not a product comparison. IRENA (2020) gives, for PEM electrolysis "today", Ir 5 mg/cm² (1.3 g/kW) and Pt 2 mg/cm² (0.5 g/kW), at 2 A/cm² and an electrode area of 1,200 cm² [Reference 3]. That these exceed DOE's 2022 value (0.8 g/kW for total PGM) reflects a different base year and method of analysis, not that either is right (Commentary).
Lower loading is not always better
Bernt et al. studied the effect of loading in a PEM electrolysis cell (Nafion 212 membrane, IrO2/TiO2 anode, Pt/C cathode). Cathode platinum could be cut from 0.30 to 0.025 mg/cm² with no loss of performance (the hydrogen evolution reaction is fast), whereas for anode iridium performance at 1 A/cm² and above peaked at 1–2 mg/cm², and below 0.5 mg/cm² the catalyst layer became inhomogeneous, utilization fell, and performance dropped sharplySourced [Reference 4]. At too high a loading, water transport through the catalyst layer is insufficient and performance falls at high current density. This is a laboratory single-cell result, not a specification of commercial stacks. The way to reduce g/kW is therefore not simply to coat thinner but to combine making a uniform layer at low loading, raising current density and using the catalyst more effectively (Commentary).
4. A materials engineer's view (1): iridium is chosen for resistance to dissolution, not for activity
The anode of a PEM electrolyzer is acidic and at high potential (see our explainer on electrolyzer stacks and materials). Very few metals survive these conditions while evolving oxygen.
- Cherevko et al. compared thin-film electrodes of Ru, RuO2, Ir and IrO2 under identical conditions and reported oxygen evolution activity of Ru > Ir ≈ RuO2 > IrO2 and dissolution that increases as IrO2 < RuO2 < Ir < Ru. They add that dissolution of the metals is 2–3 orders of magnitude greater than that of their oxidesSourced [Reference 6].
- The review by Babic et al. says that RuO2 gives lower overpotentials but its dissolution and corrosion rate is unacceptably high, which is why IrO2 remains the anode catalyst for PEM water electrolysis [Reference 5].
- IRENA (2020) likewise says ruthenium is more active than iridium but suffers from long-term stability, and that catalysts free of critical raw materials, even when efficient, tend to be more prone to dissolution and less robust [Reference 3].
So the choice of catalyst is narrowed first by "which metal does not dissolve at that potential" rather than by "which metal is most active". There is also a link between high activity and low stability for amorphous iridium oxide. Geiger et al. proposed the stability number, the ratio of evolved oxygen to dissolved iridium, and explain that leaching of non-precious elements from perovskite-type mixed oxides produces highly active amorphous iridium oxide whose instability favors dissolutionSourced [Reference 7]. They say further work should go into raising the utilization of highly durable crystalline iridium oxide and finding ways to stabilize amorphous iridium oxides [Reference 7].
What this suggests is that "using less" and "lasting longer" often pull in opposite directions: a thinner, more active catalyst is more exposed to dissolution (Commentary).
5. Catalyst supports and degradation — what happens inside the layer
(1) A catalyst is used as a layer, not as grains
A catalyst cannot be used as a loose powder. Metal particles a few nanometres across are placed on an electron-conducting support, mixed with an ionomer that carries protons (in PEM, a perfluorosulfonic acid polymer), and coated as a thin layer on the membrane.
- Cathode (platinum): the standard Pt/C studied by Meier et al. is platinum with a particle size of 3–4 nm on carbon black (Vulcan)Sourced [Reference 8].
- Anode (iridium): the potential is high and carbon is oxidized, so carbon cannot serve as the support [Reference 5]. In the laboratory cell of Bernt et al., IrO2/TiO2 is used [Reference 4]. Babic et al. describe titanium or tin oxide supports as candidates for lowering precious metal content, with an example of 0.1 mg/cm² of iridium on tungsten-doped titanium oxide showing good performance and stability, and an example of a 3M nanostructured thin-film catalyst at an iridium loading of 0.25 mg/cm² [Reference 5].
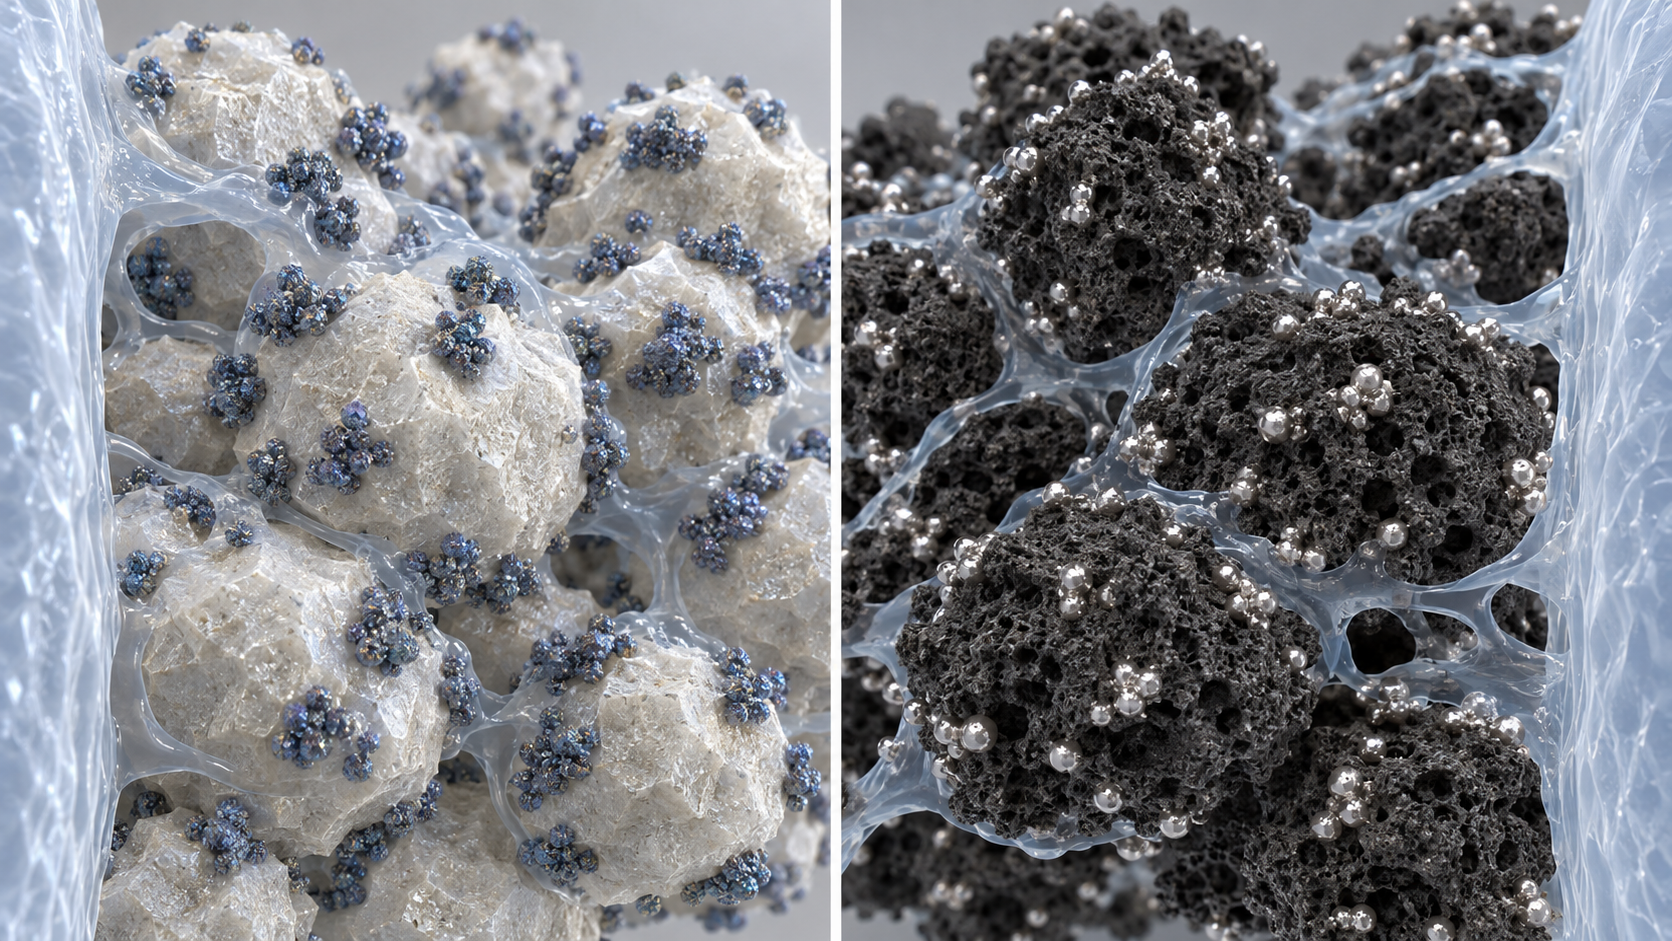
View the original SVG schematic with technical details
(2) Degradation of platinum (fuel cell, electrolysis cathode)
Meier et al. set out the degradation of Pt/C: platinum dissolution, which occurs especially for small particles (they have higher surface energy and dissolve at lower potentials, the Gibbs–Thomson effect); redeposition of dissolved platinum on larger particles so that particles grow (Ostwald ripening); migration and coalescence of particles; and carbon support corrosion that drives coalescenceSourced [Reference 8]. They also state that start-up and shut-down, or local fuel starvation, can briefly raise the cathode potential to as much as 1.5 V, a condition known to speed catalyst degradation [Reference 8]. The DOE PEFC target table likewise lists support stability (loss of mass activity) as a separate item: a 2015 status of 41% loss against a target of under 40%Sourced [Reference 2].
(3) Degradation of iridium (electrolysis anode)
As above, Cherevko et al. show that iridium oxide dissolves little, while Geiger et al. point out that the more active the amorphous iridium oxide, the more readily it dissolves [References 6, 7]. The JRC report also lists, as examples of degradation mechanisms, iridium dissolution and redeposition and carbon support corrosion with agglomeration of platinum nanoparticles [Reference 21]. Note that these studies use different scales (thin-film electrodes, single cells, stacks) and cannot be compared on one scale.
6. Resource constraints — our calculation: how many gigawatts of iridium exist?
(1) The scale of supply
| Metal | Supply and price figures | Source and cautions |
|---|---|---|
| Iridium (Ir) | World primary production in 2025 is about 7 tonnes, roughly constant over 2019–2025. South Africa about 80%. About 3 tonnes of primary supply goes to electrochemical uses (chlorine production, water treatment, copper-foil electroplating, water electrolysis and so on). Price about US$4,400 per troy ounce (2025 estimate, annual average) | IPA material (Johnson Matthey data) [10], USGS [13] |
| Ruthenium (Ru) | World primary production in 2025 is about 30–31 tonnes. Price about US$690 per troy ounce (2025 estimate) | IPA material [11], USGS [13] |
| Platinum (Pt) | World primary production in 2025 is about 178 tonnes (Johnson Matthey) or about 170 tonnes (USGS estimate). South Africa about 121 tonnes, 68%. Price about US$1,200 per troy ounce (2025 estimate) | IPA material [12], USGS [13]. The two sources differ |
The IPA material was written by the consultancy SFA (Oxford) for the International Platinum Group Metals Association, using Johnson Matthey data of January 2026. It is industry-association material. Prices are USGS estimates of annual averages and differ from actual transaction prices.
- A by-product: according to IPA, iridium is not mined on its own but obtained as a by-product of platinum- and palladium-led mines or of nickel-copper sulfide deposits. Iridium is about 2% of PGM output by mass and about 1% of demandSourced [Reference 10].
- Geographic concentration: in its 2023 assessment the European Commission places the platinum group metals on its list of critical raw materials, and states that "South Africa provides 71% of the EU's needs for platinum and an even higher share" of iridium, rhodium and rutheniumSourced [Reference 22].
- Relation to the pace of electrolyzer deployment: IRENA (2020) says that current production of iridium and platinum would support only 3–7.5 GW a year of PEM electrolyzer manufacture, against a requirement it estimates at around 100 GW a year by 2030 [Reference 3].
(2) Our calculation
How much iridium is needed if some number of gigawatts of electrolyzers are installed each year? We assume deployment rates to see the order of magnitudeOur calculation.
- Conversion: 1 GW = 1,000,000 kW. At x g/kW of Ir, 1 GW needs x tonnes (1 g/kW × 106 kW = 1 tonne).
- IRENA (2020) "today": Ir 1.3 g/kW → 1.3 tonnes per GW. At 10 GW a year that is 13 tonnes, about 1.9 times annual primary production (about 7 tonnes).
- IRENA "future" example: Ir 0.4 g/kW → 4 tonnes at 10 GW (57% of about 7 tonnes).
- DOE 2022 status: total PGM 0.8 g/kW. Treated as an upper bound for Ir (it includes Pt), 10 GW needs 8 tonnes (114%).
- DOE 2026 target: total PGM 0.1 g/kW → 1 tonne at 10 GW (14%). Ultimate target 0.03 g/kW → 0.3 tonnes (4%).
- An order of magnitude from actual installation: by IEA, global installed water electrolysis capacity was about 2 GW at the end of 2024, with about 600 MW added in 2024, alkaline making up 60% of additions [Reference 20]. If the remaining up to 40% (≈240 MW) were all PEM at Ir 1.3 g/kW, that is 240,000 kW × 1.3 g/kW = about 312 kg (about 0.3 tonnes), about 4% of primary production.
Assumptions and limits: "10 GW a year" is a hypothetical scenario, not a forecast. The roughly 7 tonnes is primary supply for all uses of iridium, and not all of it can be diverted to electrolyzers. The IEA "additions" are electrical input capacity, and we could not confirm the PEM share. Only anode loading is counted as Ir, and recycled material is not considered.
We convert the USGS 2025 estimated annual average prices (Ir 4,400 and Pt 1,200 dollars per troy ounce [Reference 13]) using 1 troy ounce = 31.1035 gOur calculation.
- Conversion: Ir ≈ US$141/g, Pt ≈ US$38.6/g
- IRENA "today" (Ir 1.3 g/kW, Pt 0.5 g/kW): Ir 1.3 × 141 = about US$184/kW; Pt 0.5 × 38.6 = about US$19/kW
- DOE 2022 status (PGM 0.8 g/kW): if all Ir, 0.8 × 141 = about US$113/kW (upper bound). The DOE stack capital cost status is US$450/kW [Reference 1].
Assumptions and limits: this is only the raw metal price, and excludes catalyst manufacturing and processing, leasing, inventory and insurance. The prices are estimated annual averages and fluctuate. Even so, the calculation puts the iridium metal alone at about a quarter to over 40% of the DOE stack capital cost status of US$450/kW (US$113–184/kW). It places side by side figures from two sources with different bases, and is not a breakdown of any one product.
7. A materials engineer's view (2): a by-product metal does not grow when demand does
IPA's material says iridium is a by-product of platinum- and palladium-led mines and that its output depends on the price and demand of the PGM basket as a wholeSourced [Reference 10]. It also says that, for PGM production facilities, restarts or shallow decline extensions using existing infrastructure take 8–18 months, mechanized shallow greenfield mines 3–4 years, and large deep vertical shafts 6–8 years [Reference 10].
What a materials engineer can read from this is as follows (Commentary).
- The demand signal travels poorly to supply: iridium contributes little to revenue, and mine investment is decided by the economics of platinum and palladium. A rise in the iridium price alone is unlikely to raise primary supply.
- It depends on the type of ore: IPA's material says the UG2 reef is rich in iridium (and in ruthenium and rhodium) and that more UG2 mining has widened potential iridium availability [Reference 10]. Supply is tied to the nature of the deposits.
- The demand outlook swings: on the 9% fall in the iridium price in 2025, USGS writes that it may have been affected by increased production and the waning of investor enthusiasm in the hydrogen power market [Reference 13]. If electrolyzer deployment slows, the iridium demand outlook falls too (one has to watch actual orders rather than plans).
So, besides cutting use on the premise that the resource is short (g/kW), it matters equally to watch the pace at which electrolyzers are actually installed and to recover and reuse the metal (recycling).
8. Recycling — closed loops and open loops
IPA's material separates PGM recycling into closed loops and open loops. In a closed loop the original owner recovers the used metal and uses it again, a volume that is hard for the market to see. In an open loop others recover the metal and return it to the market, of which automotive exhaust catalysts are the standard exampleSourced [References 10, 12].
| Metal | What the sources say about recycling | Source |
|---|---|---|
| Platinum | Closed loops account for nearly 90% of platinum recycling. From spent exhaust catalysts, current technology can recover about 95% of the PGM. Secondary supply is dominated by exhaust catalysts | IPA platinum material [12] |
| Iridium | Essentially no open-loop recycling globally. Recycled volumes are almost all closed loop. Content per product is extremely small (a few milligrams in a spark plug), so recovery is hard to justify economically | IPA iridium material [10] |
| Spent electrolyzer MEAs (laboratory) | Alexiou et al. (2026): catalyst layers separated from the membrane by mechanical delamination, then treated by chlorine-based hydrometallurgy. Leaching efficiencies exceeded 99% for Pt and 80% for Ir. Using recycled Pt lowers the global warming potential of MEA manufacture by up to 70%. Electricity demand and Nafion membrane waste are the environmental issues | [17] (abstract) |
The recovery of electrolyzer MEAs is a laboratory report. A leaching efficiency is not the recovery rate of the whole process.
The time lag before recovery supplements supply
Minke et al. name two preconditions for PEM water electrolysis to reach gigawatts a year: a dramatic reduction of iridium loading, and a recycling infrastructure with technical end-of-life recycling rates of at least 90% for used catalysts [Reference 14]. In a modelling study, Clapp et al. find that if iridium utilization improves by an order of magnitude by 2050 and closed-loop recycling is in place by 2035, installed capacity in 2050 could be about 2.7 times higher and global PEM electrolysis could reach 1.3 TW using about 20% of annual global primary supplySourced [Reference 15]. These are model scenarios and do not guarantee that this will happen. In a German case study, by contrast, Kiemel et al. conclude that secondary material from end-of-life electrolyzers will not significantly reduce dependence on primary resources over 2020–2050 [Reference 16].
We convert the DOE lifetime targets into years of continuous operationOur calculation.
- 40,000 hours ÷ 8,760 hours/year = about 4.6 years (2022 status); 80,000 hours ÷ 8,760 = about 9.1 years (2026 target) [Reference 1]
- At a 50% capacity factor, the same operating hours span about 9 and about 18 calendar years
Assumptions and limits: operating hours are DOE's lifetime targets, defined by a 10% rise from the initial voltage, and are not the actual service life of equipment. Even so, the catalyst in electrolyzers installed now returns for recovery only several to a dozen or so years later, and new primary supply is needed until then (Commentary).
9. Where non-precious-metal catalysts stand
The road to "no precious metals" looks entirely different depending on the type.
| Type | Status | Source and label |
|---|---|---|
| Alkaline, AEM, solid oxide | The main catalyst materials are nickel, iron, cobalt-based and so on. IRENA says leading alkaline manufacturers are already implementing solutions that avoid scarce materials, and that AEM does not need scarce materials in the first place. JRC, however, lists chemical and thermo-mechanical stability of the membrane as an AEM challenge, and low current density and pressure as an alkaline challenge | [3, 21] Sourced |
| PEM anode (acidic, high potential) | A laboratory report: Chong et al. report that a La- and Mn-co-doped cobalt spinel showed low degradation over 360 hours of oxygen evolution in acid and reached 2,000 mA/cm² at 2.47 V (Nafion 115) in a PEM electrolysis cell. An erratum was published in June 2025; we have not been able to check its content | [19] Sourced (abstract). Single cell, laboratory |
| PEM anode (company announcement) | IEA records that the U.S. start-up Calicat reported in February 2025 that its non-iridium catalyst sustained over 2 A/cm² (cell voltage 2 V) for 15,000 hours. This is the company's own report and has not been independently verified by the IEA | [20] Sourced (as a company claim). At the Not yet confirmed stage |
| Fuel cell cathode (Fe-N-C etc.) | The mini-review by Helsel and Choudhury (2025) says that no platinum-group-metal-free catalyst has yet matched the performance and durability of commercial Pt/C in acidic media. In the DOE target table, PGM-free catalyst activity is 0.016 A/cm² (at 0.9 V, 2015 status) against a 2020 target above 0.044 A/cm² | [18, 2] Sourced |
Non-precious catalysts are in practical use in types with a milder environment (alkaline and so on). Nickel-based materials are stable in strong alkali and so can do the job of the precious metals (Commentary). In the acidic, high-potential PEM anode, by contrast, what is demanded is not only activity but durability over tens of thousands of hours. As chapter 4 showed, very few metals survive there. Reports that "it worked without precious metals" in the laboratory are increasing, but many cover hundreds of hours. Set against DOE's lifetime targets of 40,000–80,000 hours [Reference 1], the orders of magnitude differ (Commentary).
The realistic course for now can therefore be summarized as running three things in parallel: (1) cutting the amount used (g/kW) in PGM-based types, (2) recovering and reusing the metal, and (3) using precious-metal-free types where they fit (Commentary).
10. Link to silicones and adhesives: platinum is used elsewhere too
Platinum is used as a catalyst outside hydrogen as well. IPA's platinum material lists, among platinum catalyst uses, nitric acid, silicones and some hydrogen-related processesSourced [Reference 12]. In the appendix on trade codes, the same material gives, as homogeneous platinum catalysts for hydrosilylation, the examples of Karstedt's catalyst and Speier's catalyst [Reference 12].
- Addition-cure silicone cures by hydrosilylation using a platinum catalyst. The "poisoning of addition cure" covered in our explainer on silicones is the story of this platinum catalyst losing its action to components such as sulfur, nitrogen and tin (Commentary).
- In electrolyzer and fuel cell stacks, silicone and rubber are used for seals and encapsulation (see our explainer on electrolyzer stacks and materials). The same element, platinum, therefore enters as a catalyst in the electrode on one side and as a cure catalyst in the seal on the other (Commentary).
- From the viewpoint of the electrode's platinum and iridium, components released from seal materials contaminating the catalyst is a concern from the materials side. We could not find a report that measured that effect in electrolyzers (Inference).
- Another point of contact is the ionomer in the catalyst layer. JRC says that fluoropolymers are used in PEM electrolyte membranes and ionomers and that a future PFAS restriction could be a challenge [Reference 21]. If the binder of the catalyst layer changes, the discussion of catalyst loading and durability may change too (Commentary). See our explainer on fluoropolymers and PFAS.
11. Challenges, and what we could not confirm
- The trade-off between amount and lifetime: the more activity is raised to cut the amount used, the more exposed the catalyst is to dissolution [References 3, 7]
- The structure of supply: iridium is a by-product, primary supply stays at about 7 tonnes a year, and the demand signal travels poorly [Reference 10]
- The recovery system: open-loop recycling of iridium is essentially absent worldwide, so a closed-loop design is needed [References 10, 14]
- Durability of substitutes: non-precious PEM anode catalysts remain at the stage of laboratory reports [References 19, 20]
(1) Actual iridium and platinum loadings of commercial products could not be confirmed
The g/kW and mg/cm² figures in this article are DOE (targets and status values), IRENA (2020 analysis) and laboratory-cell values from papers. Actual loadings in manufacturers' commercial stacks could not be confirmed in primary sources, so they are not stated.
(2) Future iridium supply and electrolyzer deployment are not forecast
The "10 GW a year" in chapter 6 is a hypothetical scenario. We make no forecast of future deployment, iridium output or prices. Deployment outlooks other than the IEA's installed-capacity record (about 2 GW at the end of 2024) are not covered.
(3) Recycling economics and recovered volumes from electrolyzers could not be confirmed
MEA recovery is a laboratory report (leaching efficiency), and we could not confirm industrial-scale recovery rates or costs.
(4) Other PGMs (palladium, rhodium) and non-catalyst uses
Palladium, rhodium, and PGM uses in hydrogen purification and storage are not covered here. IPA's platinum material says only that platinum is also used in the midstream of hydrogen (transport and storage), and we have not confirmed the details [Reference 12].
(5) Developments and policy in Japan are not covered
We could not confirm primary sources on the efforts of Japanese companies and research institutes or on domestic stockpiling and recycling schemes, so they are not stated.
- In PEM electrolysis iridium is at the anode and platinum at the cathode; in fuel cells platinum is on both. Alkaline and similar types rely mainly on non-precious metalsSourced
- The DOE PEM electrolysis PGM loading is 3.0 mg/cm² (0.8 g/kW) as the 2022 status, about 23 times (per area) and 5 times (per power) the fuel cell's 0.13 mg/cm² (0.16 g/kW; 2015 status)Our calculation
- Iridium is chosen for resistance to dissolution rather than for activitySourced
- World primary iridium production is about 7 tonnes a year. At 1.3 g/kW, 10 GW a year would need 13 tonnes, about 1.9 times supplyOur calculation
- Iridium is a by-product and essentially has no open-loop recycling, so cutting use and designing closed loops are both neededSourced
- Non-precious PEM anode catalysts are at the stage of laboratory or company reports, and we could not confirm public verification of durability over tens of thousands of hoursNot yet confirmed
12. Glossary
- PGM (platinum group metals)
- Six elements: platinum, palladium, rhodium, ruthenium, iridium and osmium.
- OER / HER / ORR
- Oxygen evolution reaction / hydrogen evolution reaction / oxygen reduction reaction.
- Loading (mg/cm²)
- Mass of catalyst metal placed per unit electrode area.
- g/kW
- Amount of catalyst metal per unit of equipment power (or electrical input). Loading ÷ power density.
- Support
- The base on which metal catalyst particles sit; it carries electrons. Carbon, titanium oxide and so on.
- Ionomer
- The polymer that carries protons inside the catalyst layer. In PEM, a perfluorosulfonic acid type.
- Ostwald ripening
- Small particles dissolve and redeposit on larger ones, so particles grow.
- Stability number
- The ratio of evolved oxygen to dissolved iridium; an index of how resistant a catalyst is to dissolution (Geiger et al.).
- By-product metal
- A metal obtained incidentally in mining and refining a main metal, such as iridium.
- Closed loop / open loop
- Recycling in which the metal's owner recovers and returns it / recycling in which others recover it and return it to the market.
- Hydrometallurgy
- Dissolving metals in aqueous solutions such as acids, then separating and refining them.
- PGM-free catalyst
- A catalyst that uses no precious metal, such as Fe-N-C.
- Hydrosilylation
- Addition of an Si-H bond across a C=C double bond. Platinum catalysts are used in addition-cure silicones.
- Critical raw materials (CRM)
- The list of raw materials the EU selects by supply risk and economic importance.
13. References
- U.S. Department of Energy (DOE) "Technical Targets for Proton Exchange Membrane Electrolysis" (accessed 5 October 2026; no publication date shown) — energy.gov
- U.S. Department of Energy (DOE) "DOE Technical Targets for Polymer Electrolyte Membrane Fuel Cell Components" (tables give 2015 status and 2020 targets; accessed 5 October 2026) — energy.gov
- IRENA "Green Hydrogen Cost Reduction: Scaling up Electrolysers to Meet the 1.5°C Climate Goal" (December 2020, PDF report) — irena.org
- Bernt, Siebel, Gasteiger "Analysis of Voltage Losses in PEM Water Electrolyzers with Low Platinum Group Metal Loadings", Journal of The Electrochemical Society 165, F305–F314 (2018) — doi.org/10.1149/2.0641805jes
- Babic, Suermann, Büchi, Gubler, Schmidt "Critical Review—Identifying Critical Gaps for Polymer Electrolyte Water Electrolysis Development", Journal of The Electrochemical Society 164(4), F387–F399 (2017) — doi.org/10.1149/2.1441704jes
- Cherevko et al. "Oxygen and hydrogen evolution reactions on Ru, RuO2, Ir, and IrO2 thin film electrodes in acidic and alkaline electrolytes: A comparative study on activity and stability", Catalysis Today 262, 170–180 (2016) (abstract checked) — doi.org/10.1016/j.cattod.2015.08.014
- Geiger et al. "The stability number as a metric for electrocatalyst stability benchmarking", Nature Catalysis 1, 508–515 (2018) — doi.org/10.1038/s41929-018-0085-6
- Meier et al. "Design criteria for stable Pt/C fuel cell catalysts", Beilstein Journal of Nanotechnology 5, 44–67 (2014) — doi.org/10.3762/bjnano.5.5
- Kongkanand, Mathias "The Priority and Challenge of High-Power Performance of Low-Platinum Proton-Exchange Membrane Fuel Cells", The Journal of Physical Chemistry Letters 7, 1127–1137 (2016) (abstract checked) — doi.org/10.1021/acs.jpclett.6b00216
- International Platinum Group Metals Association (IPA) "PGM Fact Sheet: Iridium" (written by SFA (Oxford), data from Johnson Matthey, May 2026, PDF) — ipa-news.com
- International Platinum Group Metals Association (IPA) "PGM Fact Sheet: Ruthenium" (same, May 2026, PDF) — ipa-news.com
- International Platinum Group Metals Association (IPA) "PGM Fact Sheet: Platinum" (same, May 2026, PDF) — ipa-news.com
- U.S. Geological Survey (USGS) "Mineral Commodity Summaries 2026" (February 2026, platinum-group metals chapter) — pubs.usgs.gov
- Minke, Suermann, Bensmann et al. "Is iridium demand a potential bottleneck in the realization of large-scale PEM water electrolysis?", International Journal of Hydrogen Energy 46, 23581–23590 (2021) (abstract checked) — doi.org/10.1016/j.ijhydene.2021.04.174
- Clapp, Zalitis, Ryan "Perspectives on current and future iridium demand and iridium oxide catalysts for PEM water electrolysis", Catalysis Today 420, 114140 (2023) (abstract checked) — doi.org/10.1016/j.cattod.2023.114140
- Kiemel, Smolinka, Lehner et al. "Critical materials for water electrolysers at the example of the energy transition in Germany", International Journal of Energy Research 45, 9914–9935 (2021) (abstract checked) — doi.org/10.1002/er.6487
- Alexiou, Zagoraiou, Moschovi et al. "Life Cycle Assessment of Closed-Loop Hydrometallurgical Recovery of Platinum Group Metals from PEM Fuel Cells and Electrolyzers", Purification 2(3), 12 (2026) (abstract checked) — doi.org/10.3390/purification2030012
- Helsel, Choudhury "Non-Platinum Group Metal Oxygen Reduction Catalysts for a Hydrogen Fuel Cell Cathode: A Mini-Review", Catalysts 15(6), 588 (2025) (abstract checked) — doi.org/10.3390/catal15060588
- Chong et al. "La- and Mn-doped cobalt spinel oxygen evolution catalyst for proton exchange membrane electrolysis", Science 380, 609–616 (2023) (abstract checked; an erratum appeared in 2025) — doi.org/10.1126/science.ade1499
- International Energy Agency (IEA) "Global Hydrogen Review 2025" (2025; revised version October) — iea.org
- European Commission Joint Research Centre (JRC) Malkow, T., Pilenga, A. "EU harmonised accelerated stress testing protocols for low-temperature water electrolyser", EUR 31748 EN, 2024, DOI 10.2760/988717 — clean-hydrogen.europa.eu
- European Commission "Critical raw materials" (explanatory page on the 2023 list) — single-market-economy.ec.europa.eu
14. Claim-to-source audit
| Claim in the text | Basis | Label |
|---|---|---|
| DOE PEM electrolysis target table: PGM loading (both electrodes combined) of 3.0 mg/cm² (0.8 g/kW) as 2022 status, 0.5 mg/cm² (0.1 g/kW) as 2026 target and 0.125 mg/cm² (0.03 g/kW) as ultimate target. Cell performance of 2.0 A/cm² @ 1.9 V, 3.0 A/cm² @ 1.8 V and 3.0 A/cm² @ 1.6 V. Degradation rates 4.8 / 2.3 / 2.0 mV/kh. Lifetime 40,000 / 80,000 / 80,000 hours. Stack capital cost US$450/kW (2022 status). The note that iridium accounts for much of the PGM content. The note that the status values rest on H2NEW analysis | DOE technical target table (PEM electrolysis)[Reference 1] https://www.energy.gov/eere/fuelcells/technical-targets-proton-exchange-membrane-electrolysis | Sourced |
| DOE PEFC electrocatalyst table (2015 status / 2020 target): total PGM content 0.16 g/kW (150 kPa abs, MEA gross power) and 0.13 mg/cm², target 0.125. Mass activity above 0.5 A/mg (target 0.44). Support stability (mass activity loss 41%, target under 40%). PGM-free catalyst activity 0.016 A/cm² @ 0.9 V (2015), target above 0.044 A/cm². The 810 mW/cm² (150 kPa) in the MEA table. The note that status values rest on results such as those of 3M | DOE technical target table (PEFC components)[Reference 2] https://www.energy.gov/eere/fuelcells/doe-technical-targets-polymer-electrolyte-membrane-fuel-cell-components | Sourced |
| IRENA Table 1 (PEM: iridium oxide anode, carbon-supported platinum nanoparticle cathode. Alkaline: Ni-coated stainless steel. AEM: high-surface-area Ni or NiFeCo alloys. Solid oxide: perovskite and Ni/YSZ). Table 7 (Ir 5 mg/cm² and 1.3 g/kW, Pt 2 mg/cm² and 0.5 g/kW, at 2 A/cm² and 1,200 cm²; future Ir 0.2 mg/cm² and 0.4 g/kW, Pt 0.05 mg/cm² and 0.1 g/kW, at 5 A/cm² and 5,000 cm²). That current Ir and Pt production supports only 3–7.5 GW a year of manufacture, against an assumed requirement of about 100 GW a year by 2030. Ruthenium more active but with long-term stability problems. Catalysts free of critical raw materials tend to dissolve. Leading alkaline manufacturers already avoid scarce materials; AEM needs none | IRENA (2020)[Reference 3] https://www.irena.org/Publications/2020/Dec/Green-hydrogen-cost-reduction | Sourced |
| A single cell with Nafion 212 membrane, IrO2/TiO2 anode and Pt/C cathode. Cathode Pt can be cut from 0.30 to 0.025 mg/cm² without effect on performance. Anode Ir studied at 0.20–5.41 mg/cm², with an optimum of 1–2 mg/cm² at 1 A/cm² and above. At high loading water transport is insufficient; below 0.5 mg/cm² the catalyst layer is inhomogeneous | Bernt et al. (2018)[Reference 4] https://doi.org/10.1149/2.0641805jes | Sourced |
| That RuO2 gives low overpotential but unacceptable dissolution and corrosion, so IrO2 is chosen. That carbon is oxidized at the anode potential and cannot serve as support. Titanium and tin oxide supports as candidates, Ir at 0.1 mg/cm² on W-doped titanium oxide, and 3M NSTF at Ir 0.25 mg/cm² | Babic et al. (2017)[Reference 5] https://doi.org/10.1149/2.1441704jes | Sourced |
| Comparison of Ru, RuO2, Ir and IrO2 thin-film electrodes (activity Ru > Ir ≈ RuO2 > IrO2; dissolution IrO2 < RuO2 < Ir < Ru; metals dissolve 2–3 orders of magnitude more than oxides) | Abstract of Cherevko et al. (2016)[Reference 6] https://doi.org/10.1016/j.cattod.2015.08.014 | Sourced |
| The stability number (ratio of evolved oxygen to dissolved iridium). That leaching of non-precious elements from perovskite-type mixed oxides produces highly active amorphous iridium oxide whose instability causes dissolution. That raising the utilization of durable crystalline iridium oxide is a challenge | Abstract of Geiger et al. (2018)[Reference 7] https://doi.org/10.1038/s41929-018-0085-6 | Sourced |
| Standard Pt/C particle size of 3–4 nm (Pt/Vulcan). Platinum dissolution, the Gibbs–Thomson effect, Ostwald ripening, particle coalescence and carbon support corrosion. That start-up and shut-down can briefly bring cathode potential to 1.5 V | Meier et al. (2014)[Reference 8] https://doi.org/10.3762/bjnano.5.5 | Sourced |
| That cathode Pt loadings fell from 0.4–0.8 to about 0.1 mgPt/cm², and that performance loss at high current density appears at low loading | Abstract of Kongkanand and Mathias (2016)[Reference 9] https://doi.org/10.1021/acs.jpclett.6b00216 | Sourced |
| World primary iridium production of about 7 tonnes (roughly constant over 2019–2025), South Africa about 80%, about 3 tonnes to electrochemical uses, about 1% of demand and about 2% of output, being a by-product, the UG2 reef, essentially no open-loop recycling worldwide, the definition of closed loop, and the lead times for starting mines (8–18 months, 3–4 years, 6–8 years) | IPA iridium material[Reference 10] https://ipa-news.com/assets/pdfs/factsheets/2026-05-ipa-iridium-factsheet.pdf | Sourced |
| World primary ruthenium production of about 30–31 tonnes (2025). That Ru is increasingly used with Ir in PEM water electrolysis, with the explanation of higher activity from Ru and higher durability from Ir | IPA ruthenium material[Reference 11] https://ipa-news.com/assets/pdfs/factsheets/2026-05-ipa-ruthenium-factsheet.pdf | Sourced |
| World platinum primary production of 178 tonnes in 2025, South Africa 121 tonnes (68%). Closed loops are nearly 90% of recovered platinum, and about 95% can be recovered from exhaust catalysts. Platinum catalyst uses include nitric acid, silicones and some hydrogen-related processes. The examples of homogeneous platinum hydrosilylation catalysts (Karstedt, Speier) in the trade-code appendix | IPA platinum material[Reference 12] https://ipa-news.com/assets/pdfs/factsheets/2026-05-ipa-platinum-factsheet.pdf | Sourced |
| USGS: world platinum mine production 170,000 kg (2025 estimate). Estimated 2025 annual average prices (Ir 4,400, Pt 1,200, Ru 690 dollars per troy ounce). The 9% fall in the iridium price and the statement that increased production and waning investor enthusiasm in the hydrogen power market may have contributed | USGS Mineral Commodity Summaries 2026[Reference 13] https://pubs.usgs.gov/periodicals/mcs2026/mcs2026.pdf | Sourced |
| Preconditions for PEM water electrolysis iridium demand: a dramatic reduction of loading, and a recycling infrastructure with technical recycling rates of at least 90% | Abstract of Minke et al. (2021)[Reference 14] https://doi.org/10.1016/j.ijhydene.2021.04.174 | Sourced |
| An order-of-magnitude improvement in iridium utilization needed by 2050; closed-loop recycling by 2035 raising 2050 installed capacity by about 2.7 times; 1.3 TW using about 20% of annual global primary supply (a model) | Abstract of Clapp et al. (2023)[Reference 15] https://doi.org/10.1016/j.cattod.2023.114140 | Sourced |
| A German case study: supply-risk assessment of platinum, iridium, scandium, yttrium and other materials; that secondary material from end-of-life electrolyzers will not significantly reduce dependence on primary resources over 2020–2050; that materials in alkaline electrolysis are not exposed to significant supply risk | Abstract of Kiemel et al. (2021)[Reference 16] https://doi.org/10.1002/er.6487 | Sourced |
| Life cycle assessment of closed-loop hydrometallurgical recovery from spent MEAs (leaching efficiencies above 99% for Pt and 80% for Ir; recycled Pt lowering global warming potential of MEA manufacture by up to 70%; electricity demand and Nafion waste as issues) | Abstract of Alexiou et al. (2026)[Reference 17] https://doi.org/10.3390/purification2030012 | Sourced |
| That no PGM-free catalyst has yet matched commercial Pt/C in acidic media | Abstract of Helsel and Choudhury (2025)[Reference 18] https://doi.org/10.3390/catal15060588 | Sourced |
| La- and Mn-doped cobalt spinel: overpotential of 353 mV at 10 mA/cm², low degradation over 360 hours of oxygen evolution in acid, 2,000 mA/cm² at 2.47 V (Nafion 115) and 4,000 mA/cm² at 3.00 V (Nafion 212) in a PEM electrolysis cell. The existence of a 2025 erratum (content not checked) | Abstract of Chong et al. (2023)[Reference 19] https://doi.org/10.1126/science.ade1499 | Sourced |
| Global water electrolysis installed capacity of about 2 GW at the end of 2024, about 600 MW added in 2024 (700 MW in 2023), alkaline making up 60% of additions and installed capacity. The report that Calicat's non-iridium catalyst sustained over 2 A/cm² (at 2 V) for 15,000 hours (recorded by the IEA as a company report) | IEA Global Hydrogen Review 2025[Reference 20] https://www.iea.org/reports/global-hydrogen-review-2025 | Sourced |
| IrOx and IrOx-RuOy as PEM anode catalysts and Pt as cathode. Ni and Pt at AEM cathodes. Examples of degradation mechanisms (iridium dissolution and redeposition, carbon support corrosion with platinum agglomeration). Fluoropolymers in electrolyte membranes and ionomers and the PFAS restriction challenge. Low current density and pressure for alkaline, and membrane stability for AEM | JRC AST proposal report (2024)[Reference 21] https://www.clean-hydrogen.europa.eu/system/files/2024-02/ast.pdf | Sourced |
| That the platinum group metals are on the 2023 list of critical raw materials. The statement that South Africa provides 71% of the EU's platinum needs and a higher share of iridium, rhodium and ruthenium | European Commission page on critical raw materials[Reference 22] https://single-market-economy.ec.europa.eu/sectors/raw-materials/areas-specific-interest/critical-raw-materials_en | Sourced |
| The g/kW conversions (3.0 mg/cm² ÷ 3.8 W/cm² = about 0.79 g/kW; 0.5 ÷ 5.4 = about 0.093; 0.13 ÷ 0.81 = about 0.16). The electrolysis-to-fuel-cell ratios (about 23 times and 5 times). The iridium needed at 10 GW a year (13, 4, 8, 1 and 0.3 tonnes) against 7 tonnes. 240 MW × 1.3 g/kW = about 312 kg. The price conversions (Ir about US$141/g, Pt about US$38.6/g; US$184, US$19 and US$113 per kW). 40,000 hours ÷ 8,760 = about 4.6 years and 80,000 ÷ 8,760 = about 9.1 years | Our calculation. The kW of electrolysis is electrical input and of the fuel cell is output. The DOE electrolysis value is total PGM (including Pt), treated as an upper bound for Ir. 10 GW a year is a hypothetical scenario. About 7 tonnes is primary supply for all uses. Prices are estimated annual averages and only the raw metal price. Values with different base years and methods are placed side by side and rank nothing | Our calculation |
| Commercialization of non-precious PEM anode catalysts, and independent verification of Calicat's claim | At the stage of plans and reports, with no public confirmation that we could find. A laboratory or company self-report, and an outlook | Not yet confirmed |
| Actual loadings in commercial stacks, future iridium supply and deployment pace, industrial-scale recycling rates and costs, uses of palladium and rhodium, developments in Japan, and the effect of leaching from seal materials on catalysts | Could not be confirmed in primary sources within the scope of our survey, so not stated. The effect of leaching is an inference, and we found no measurement report | Commentary |
| The framing that iridium is selected for resistance to dissolution rather than activity. The reading that reduced loading and durability pull in opposite directions. The framing of the supply structure of by-product metals. The framing of the time lag in recovery. The framing that "precious-metal-free" advances through division of use. The connection between platinum catalysts in addition-cure silicone and seal materials / catalyst contamination | Our organization and commentary based on published content. Not views stated by any company or institution | Commentary |
| That Figs. 1, 2, 3, 4 and 6 are explanatory drawings rather than real cross-sections or design drawings, and that the hero image and Fig. 5 are AI-generated images | Our note | Commentary |
Last updated: 6 October 2026. Sources are limited to primary material (official documents of government agencies and international organizations, peer-reviewed papers, and industry-association material). The IPA material is an industry-association document, and prices are USGS estimates of annual averages. Because the article includes structural readings and materials-design interpretations, those are marked as Commentary and kept separate from sourced fact. Actual loadings in commercial stacks, forecasts of future supply and deployment, industrial-scale recycling results and developments in Japan could not be confirmed in primary sources and are therefore not stated. DOE figures are targets or status values and are not guarantees of achievement. Nothing here is investment or procurement advice, or advice on handling hydrogen or oxygen. All figures are explanatory concept graphics. Figs. 1, 2, 3, 4 and 6 are vector drawings; the hero image and Fig. 5 are AI-generated images, and none of them shows a real micrograph of a catalyst layer or a physical product.