TECHNOLOGY EXPLAINER
The Photoelectrochemical Cell
— hydrogen from a light-struck semiconductor electrode, still at the research stage
A photoelectrochemical (PEC) cell immerses a semiconductor electrode in water and uses the energy of sunlight to split the water directly into hydrogen and oxygen. On a small area in the laboratory a solar-to-hydrogen (STH) efficiency of 19.3% has been reported, but devices of tens to a hundred or so cm² have reported a few percent to just under 10%, and the durability of a semiconductor that sits in water under light has been reported only in the range of tens to a thousand hours. The U.S. Department of Energy (DOE) classes PEC as a long-term technology pathway.
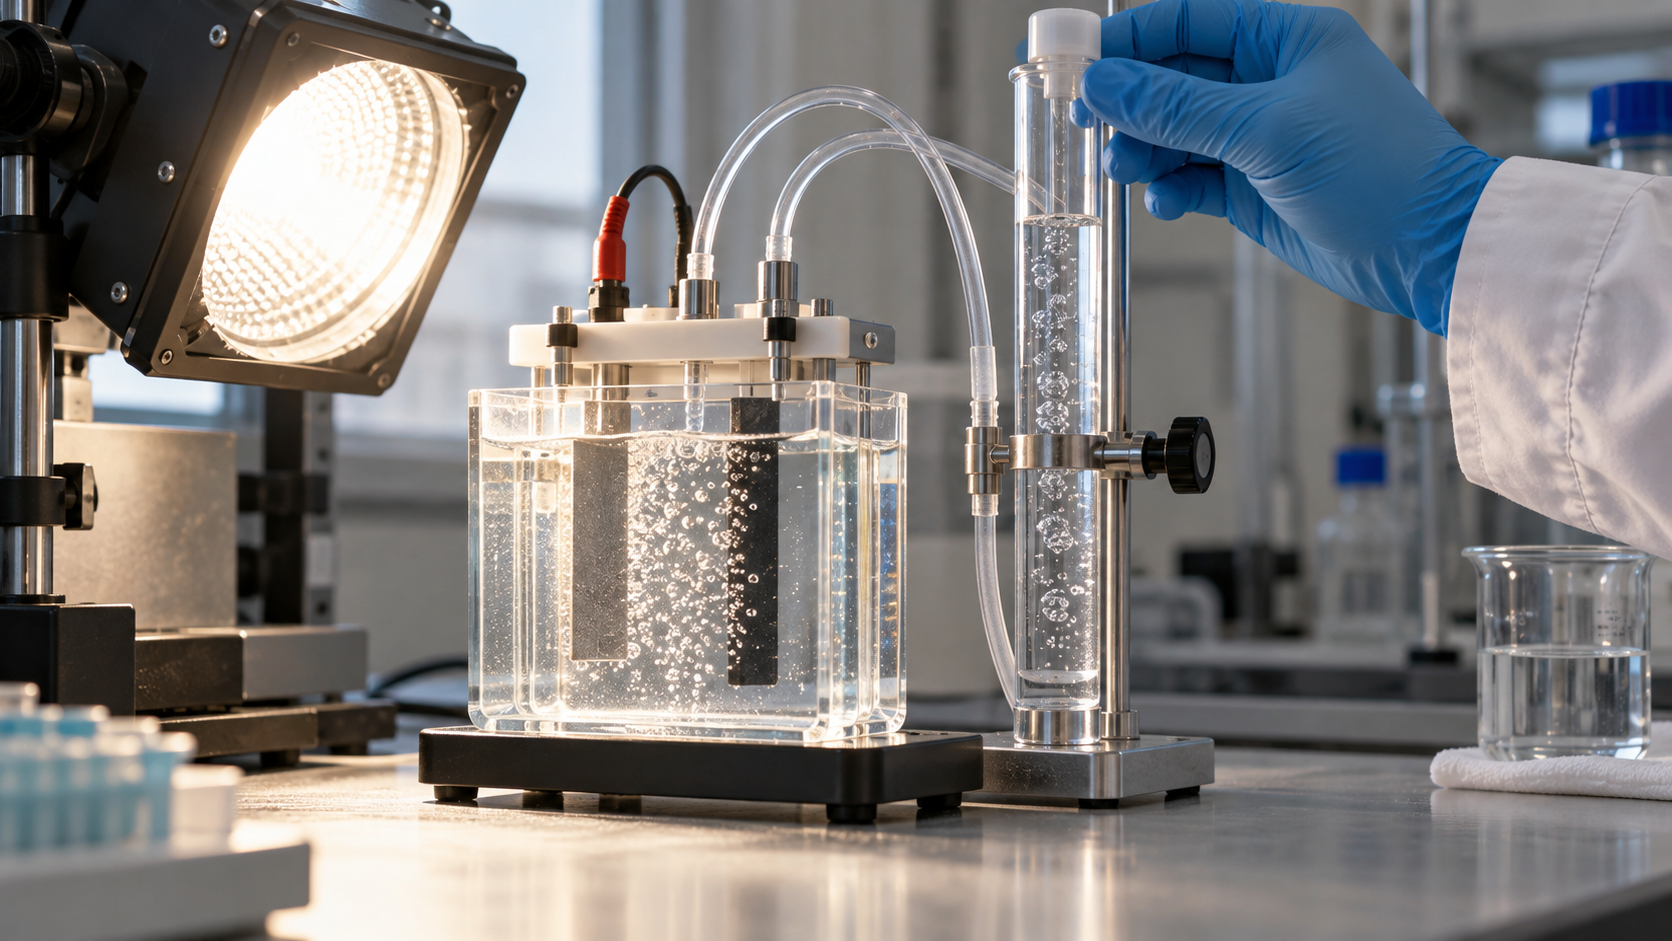
- What a PEC cell is (the short version)
- Principle — splitting water with light on a semiconductor
- Four ways to split water with light
- Defining efficiency (STH), and our calculation
- Semiconductor photoelectrode materials
- A materials engineer's view (1): a semiconductor in water is fragile — protection layers
- The durability problem — reported times versus target times
- Scale and demonstrations — how far has it come?
- Cost and positioning
- A materials engineer's view (2): putting yardsticks on the same basis
- Limits, and what we could not confirm
- Glossary / References / Claim-to-source audit
Sourced = a value stated in published material (link given)
Our calculation = a figure this article derived from stated assumptions
Not yet confirmed = a plan, target or outlook with no confirmed outcome
Readings from a materials point of view are marked separately as Commentary.
This article explains the principle, materials and evaluation of PEC cells. It is not advice on handling or operating equipment. Hydrogen is a flammable gas and its handling is governed by laws and standards. Read values from research papers together with their conditions (area, duration, light source, whether the potential was controlled).
1. What a PEC cell is (the short version)
- What it does: DOE describes photoelectrochemical (PEC) water splitting as a way to make hydrogen from water, sunlight and specialized semiconductors: a semiconductor immersed in a water-based electrolyte uses light energy to dissociate water molecules directly into hydrogen and oxygen. DOE calls it a long-term technology pathway and says improvements in efficiency, durability and cost are still needed Sourced [Reference 1]
- How far it has come: For a small-area device, an STH efficiency of 19.3% (simulated sunlight) has been reported Sourced [Reference 8]. At 64-123 cm², reports are 3.9% to 8.5% Sourced [References 6, 9]. For comparison, a different approach that pairs a solar cell with an electrolyzer (not PEC) has been reported at 30% Sourced [Reference 5].
- What is missing: Many semiconductors that absorb light well corrode in water, and durability is the bottleneck. Reported operating times, in the range we collected, are on the order of 1 to 1,000 hours (Fig. 7). DOE's target table gives an electrode lifetime of 2 years (2020 target) and 10 years (ultimate), orders of magnitude away Sourced [Reference 2].
2. Principle — splitting water with light on a semiconductor
When light with energy above the band gap strikes a semiconductor, electrons are excited from the valence band to the conduction band, creating electron-hole pairs. When the electrons and holes separate and reach the surface, holes at one electrode oxidize water to oxygen and electrons at the other reduce protons to hydrogen. The water-splitting process is organized into three steps: light absorption, charge separation and transport, and surface reaction Sourced [Reference 17].
The starting point of the idea is the 1972 report in Nature by Akira Fujishima and Kenichi Honda, "Electrochemical Photolysis of Water at a Semiconductor Electrode" Sourced [Reference 3]. It is widely known that a titanium dioxide (TiO2) electrode was used, but what we confirmed is the title and the opening statement of the paper; we did not confirm its conditions or numerical values.
The thermodynamic voltage needed to split water is 1.23 V (at 300 K). In actual electrolysis, losses such as slow reaction kinetics are added, and the practical operating voltage is said to lie in the range of 1.5-1.9 V Sourced [Reference 5]. Turan et al. state that even with state-of-the-art catalysts about 1.7-1.8 V is needed to pass 10 mA/cm² at the electrodes, and that a single-junction solar cell can supply that voltage only if its band gap is about 2.2 eV or more, or if junctions are stacked in series Sourced [Reference 6]. They add that the optimum band gap for a single-junction solar cell under AM1.5G sunlight is 1.34 eV, and that a high-band-gap cell loses efficiency to optical transmission losses [Reference 6].
1.23 V is the minimum energy for splitting water, but a light-absorbing semiconductor must have a band gap larger than that, and once losses are allowed for, a single absorber is forced to take a wide band gap (poor light absorption). This is why tandem structures that stack absorbers to add up voltage are used in high-efficiency devices (next chapter). This is a conceptual summary; values for individual materials are given with sources in Chapter 5.
3. Four ways to split water with light
Approaches to making hydrogen with light divide mainly by how the semiconductor, the electrolyte and the path of electrons are combined. DOE separates PEC reactors into electrode systems (a configuration like a photovoltaic panel) and particle systems (slurries of semiconductor particles), and says electrode systems have been the more widely studied so far Sourced [Reference 1]. Adding the approach of connecting a solar cell to an electrolyzer gives four groups.
Approach 3 is strictly not PEC, but from the standpoint of practical use it is "the benchmark." Jia et al. report a 48-hour average STH of 30% for a system in which a InGaP/GaAs/GaInNAsSb triple-junction solar cell drives two PEM electrolyzers in series (under concentrated light) Sourced [Reference 5]. The same paper says the highest efficiency then demonstrated by a PEC system with at least one semiconductor-liquid junction was 12.4% (as of 2016), and that theoretical studies using various assumptions predict a maximum of 23-32% for a tandem PEC device [Reference 5]. It also writes that none of the photochemical, PEC and PV-electrolysis approaches is currently economically viable against today's technologies [Reference 5].
4. Defining efficiency (STH), and our calculation
The most important efficiency metric for PEC is STH (solar-to-hydrogen efficiency). Chen et al. set out the kinds of PEC efficiency and standard ways to measure them, and stress the importance of STH Sourced [Reference 4]. STH is the chemical energy of the hydrogen produced divided by the energy of the sunlight that fell on the device. It is meaningful when the reaction is driven by light alone, with no external electrical bias.
• From current: STH = [ current density J × 1.23 V × Faradaic efficiency ] ÷ incident light power density (AM1.5G, 100 mW/cm²). Jia et al. state that they calculated STH by multiplying the thermodynamic potential, the electrolysis current and the Faradaic efficiency for hydrogen evolution, then dividing by the input light power [Reference 5]. With a Faradaic efficiency of 1, STH (%) = 1.23 × J (mA/cm²).
• From the amount of hydrogen: DOE's target table gives STH = hydrogen production rate (kg/s per m²) × 1.23×10⁸ J/kg ÷ 1,000 W/m² (1 sun, ideal conditions) [Reference 2].
• STH in DOE's target table is defined as the energy of the net hydrogen produced (LHV) divided by the full-spectrum solar energy consumed [Reference 2].
Using these relations we calculated, for each STH value, the operating current, the hydrogen production rate, and the collector area needed to make 1 kg of hydrogen a day. We assume 5 kWh/m² of sunlight a day (our assumption).
| STH | Operating current needed (mA/cm²) | H2 production rate (g/h per m², 1 sun) | H2 per day (g/m²) | Area for 1 kg/day (m²) | Matching report or target |
|---|---|---|---|---|---|
| 0.76% | 0.6 | 0.22 | 1.1 | 899 | Maximum for the 100 m²-scale photocatalyst panel [Reference 10]. A particle system, not PEC |
| 3.9% | 3.2 | 1.14 | 5.7 | 175 | Integrated Si thin-film device (64 cm²) [Reference 6] |
| 9.8% | 8.0 | 2.87 | 14.3 | 70 | Perovskite photoanode + solar cell (small area) [Reference 9] |
| 12.4% | 10.1 | 3.63 | 18.1 | 55 | Integrated GaInP2/GaAs (1998, from short-circuit current and LHV) [Reference 15] |
| 19.3% | 15.7 | 5.65 | 28.2 | 35 | III-V tandem (small area, simulated sunlight) [Reference 8] |
| 20% | 16.3 | 5.85 | 29.3 | 34 | DOE 2020 target [Reference 2] |
| 25% | 20.3 | 7.32 | 36.6 | 27 | DOE ultimate target [Reference 2] |
| 30% | 24.4 | 8.78 | 43.9 | 23 | Solar cell + electrolyzer (not PEC; concentrated) [Reference 5] |
Table 1 STH versus hydrogen output and area (Our calculation). Assumes Faradaic efficiency of 1, AM1.5G (100 mW/cm²), hydrogen energy from DOE's 1.23×10⁸ J/kg, 5 kWh/m² per day, and no losses. Conditions of the reported values (area, duration, type) differ. For the photocatalyst row (no electrodes) the current is the equivalent value for the same STH.
What Table 1 shows Our calculation:
- Even at 10% STH, 1 kg/day needs about 68 m². For a 50,000 kg/day plant, the size assumed in DOE's cost analysis, 10% STH with no losses means a collector area of about 3.4 km² (DOE's target table includes the idea of using solar concentration to reduce collector area [Reference 2]).
- A tenfold difference in STH means a tenfold difference in the area needed for the same amount of hydrogen (the log chart in Fig. 4). The photocatalyst panel at 0.76% needs about 13.2 times the area of a 10% system.
- The operating current at 10% STH is about 8 mA/cm². Do not confuse it with the "photocurrent at 1.23 VRHE" quoted in the materials table of the next chapter (see Chapter 10).
5. Semiconductor photoelectrode materials
Photoelectrodes have been built from metal oxides, III-V compounds, silicon, perovskites and more. The table gathers band gaps and the characteristics reported.
| Material (role) | Reported characteristics and values (conditions) | Issues | Source |
|---|---|---|---|
| TiO2 (photoanode) | Band gap about 3.2 eV for anatase. Stable and non-toxic. Reported in 1972 as an electrode for photolysis of water | Responds mainly to ultraviolet light. Charge recombination | [References 17, 3] |
| WO3 (photoanode) | Band gap about 2.6-2.8 eV. Chemically stable in acidic solution | Absorbs only a limited part of the spectrum | [Reference 17] |
| α-Fe2O3 (photoanode) | Band gap about 2.1 eV. Abundant and inexpensive | Low charge-carrier mobility. Slow water-oxidation kinetics | [Reference 17] |
| BiVO4 (photoanode) | Band gap about 2.4 eV. The leading metal-oxide photoanode. Said to have come near its theoretical photocurrent limit of 7.5 mA/cm² by 2018. Particulate Mo-doped BiVO4 gave stable oxygen evolution for over 1,000 h at a low bias of 0.4 VRHE | Fast charge recombination. Stability issues (review) | [References 17, 12] |
| Cu2O (photocathode) | Protected with Al-doped ZnO and TiO2 nanolayers and decorated with Pt particles: up to −7.6 mA/cm² at 0 VRHE (mild pH). Still active after 1 h; Faradaic efficiency estimated at close to 100% | Needs protection layers. Short test (1 h) | [Reference 13] |
| Si (photoanode with protective TiO2) | ALD TiO2 (4-143 nm) plus Ni oxide catalyst: continuous oxygen evolution for over 100 h at over 30 mA/cm² in 1.0 M KOH, Faradaic efficiency about 100% | Half-cell test (potential controlled) | [Reference 11] |
| III-V (GaInP/GaInAs and others) | Inverted metamorphic structure with a transparent graded buffer: over 16% STH (a buried p-n junction cuts the voltage loss at the electrolyte interface by 0.55 V). In another device, with a crystalline titania protection layer and Rh catalyst, 19.3% (acidic) and 18.5% (neutral) under simulated sunlight | The abstracts do not state operating time or stability, so we could not confirm them. Complex multilayer structures (Commentary) | [References 7, 8] |
| Perovskite (FAPbI3 photoanode) | Encapsulated with Ni foil/NiFeOOH. 22.8 mA/cm² at 1.23 VRHE, stable for 3 days under simulated 1 sun. STH of 9.8% when paired in parallel with a same-size solar cell; 8.5% for mini-modules up to 123 cm² | Reliability of the encapsulation. We could not confirm long-term outdoor data | [Reference 9] |
Table 2 Semiconductor photoelectrode materials (all Sourced; band gaps are those stated in the review and vary with crystal phase and film state. Values are for each report's conditions and do not rank the materials).
6. A materials engineer's view (1): a semiconductor in water is fragile — protection layers
Semiconductors with band gaps well suited to sunlight, such as Si, GaAs and GaP, are unstable in aqueous media. Hu et al. showed that TiO2 coatings (4 to 143 nm) grown by atomic layer deposition (ALD) prevent corrosion, have electronic defects that promote hole conduction, and are transparent enough Sourced [Reference 11]. Si photoanodes combined with a Ni oxide catalyst gave continuous oxygen evolution for more than 100 hours at over 30 mA/cm² in 1.0 M KOH. For GaAs and GaP the photovoltages were 0.81 V and 0.59 V and the light-limited photocurrent densities 14.3 and 3.4 mA/cm² [Reference 11].
This is no accident. Chen and Wang calculated the thermodynamic stability against oxidation and reduction of about thirty photocatalytic semiconductors and showed the following trends Sourced [Reference 14]. (i) Some metal oxides can resist oxidation by photogenerated holes when used as n-type photoanodes. (ii) All non-oxide semiconductors are susceptible to oxidation but resist reduction by photogenerated electrons, so they can be used as p-type photocathodes if protected from oxidation. (iii) Doping or alloying an oxide with less electronegative anions lowers the band gap (better light absorption) but also degrades stability against oxidation.
In other words, absorbing light broadly and not breaking down in water collide in the choice of material (Commentary). That is why a protection layer that separates the absorber from the water is needed. Four things are asked of it: (1) dense enough to keep water out, (2) transparent, (3) able to pass charge (holes at an anode), and (4) a band alignment compatible with the absorber. In the 19.3% device of Cheng et al., a crystalline titania layer served three purposes at once: corrosion protection, conduction-band alignment and a foundation for the Rh catalyst particles [Reference 8].
Paracchino et al. used the same idea for a Cu2O photocathode. Nanolayers of Al-doped ZnO and TiO2 protected the photocathode against decomposition and Pt particles activated hydrogen evolution, giving up to −7.6 mA/cm² at 0 VRHE. The test, however, lasted 1 hour [Reference 13]. A protection layer is a means of extending life, but the durability of the protection layer itself (pinholes, delamination, dissolution) becomes the next issue (Commentary; among the sources we reviewed, none compared long-term degradation mechanisms of protection layers directly).
7. The durability problem — reported times versus target times
Durability reports are not on a common footing. Reports on "half-cells," in which a single electrode is tested under potential control, are mixed with reports on whole devices. Fig. 7 lines up the durations we confirmed.
- Even the longest report is far from DOE's targets. A half-cell report exceeds 1,000 hours (Mo-doped BiVO4 at 0.4 VRHE) [Reference 12], yet that is only about 0.11 years (1,000 h ÷ 8,760 h) Our calculation. In DOE's target table the electrode lifetime (immersed in electrolyte, until efficiency drops to 80% of the original) is 0.5 years for 2015, 2 years for 2020 and 10 years ultimately, with 10 years equal to about 5 years of actual hydrogen production Sourced [Reference 2].
- Light shines for only a few hours a day. If we assume the equivalent of 5 hours of sun a day, 1,000 hours is about 0.5 years of daylight Our calculation. Outdoors, day-night, weather and temperature cycling are added.
- DOE's 2011 status: DOE records that thin-film systems had shown STH above 4% for hundreds of hours and crystalline systems above 12% for tens of hours Sourced [Reference 2]. In this 2011 example the more efficient crystalline systems have a shorter confirmed operating time (a comparison of DOE's statements; it does not settle which material is better).
8. Scale and demonstrations — how far has it come?
We organize reports of demonstrations by scale, type and reported value. What we could confirm from official material is DOE's target tables, the summary of an EU research project (CORDIS), and abstracts of peer-reviewed papers.
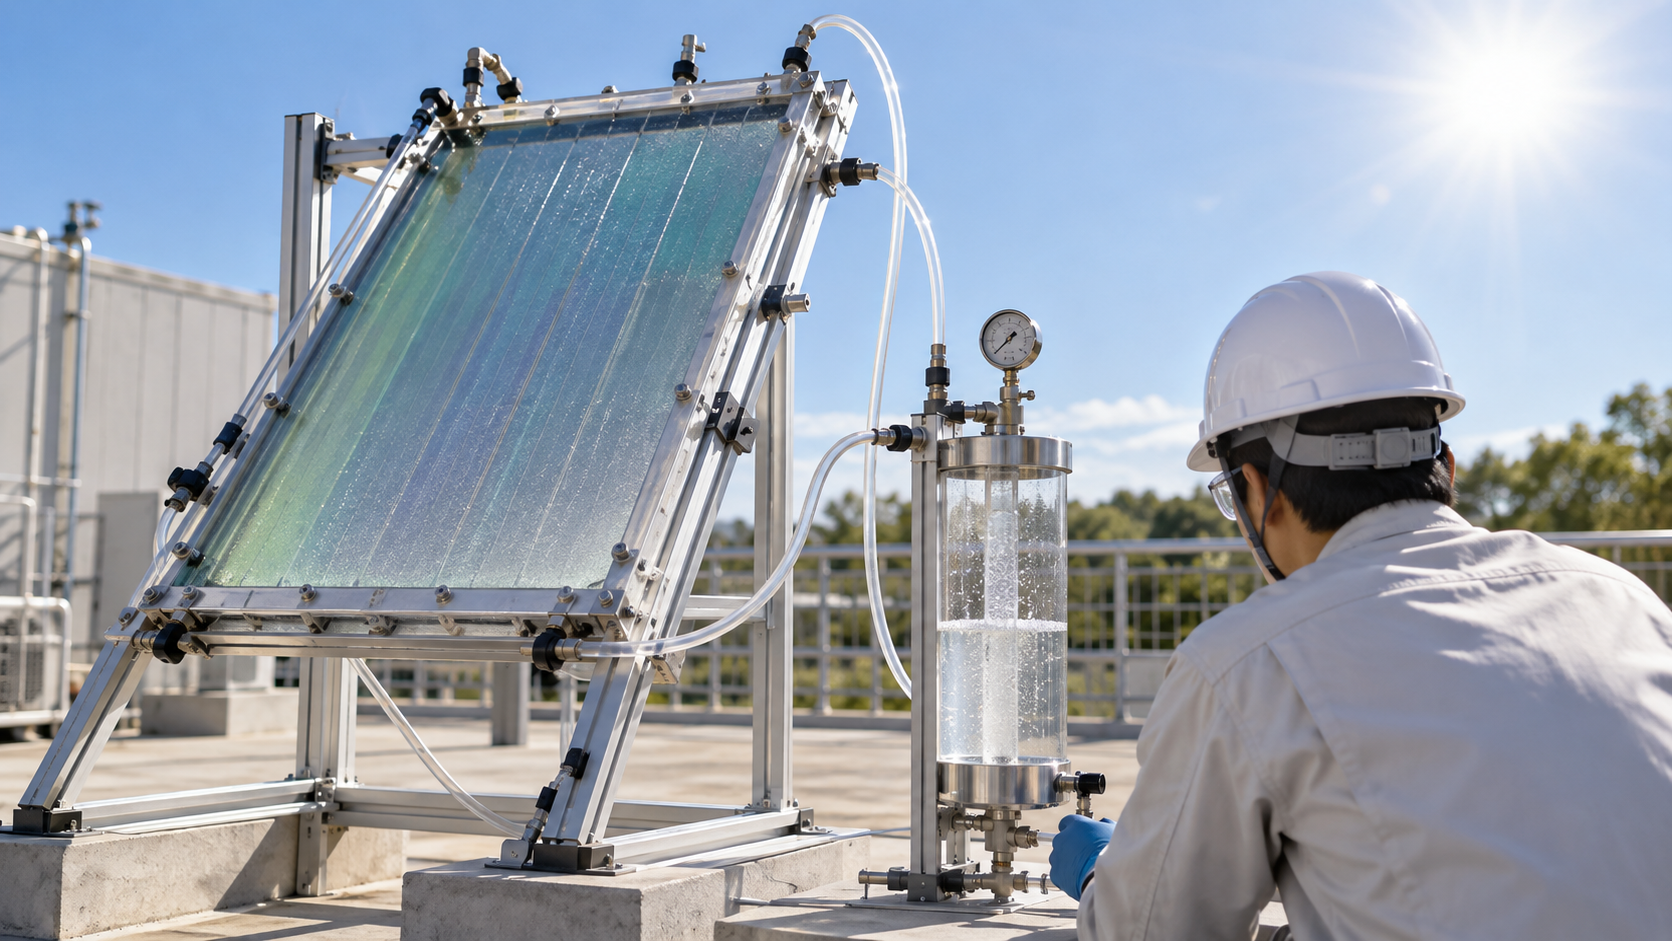
| Effort | Scale and type | Reported value (conditions) | Standing |
|---|---|---|---|
| Turan et al. (Jülich, 2016) | A wireless device integrating a silicon thin-film solar cell and electrolysis electrodes. 64 cm², 13 base units | STH 3.9%. Another, smaller device ran bias-free and stable for 40 hours | Laboratory. An integrated PV-electrolysis device, not PEC [Reference 6] |
| Hansora et al. (2024) | A perovskite (FAPbI3) photoanode encapsulated with Ni foil/NiFeOOH. A small-area system and mini-modules up to 123 cm² | STH 9.8% for the small-area system and 8.5% for the mini-modules. The photoanode was stable for 3 days under simulated 1 sun | Laboratory [Reference 9] |
| Nishiyama et al. (2021) | Panel reactors using an Al-doped SrTiO3 particulate photocatalyst. A 100 m²-scale array operated for several months. A commercial polyimide membrane recovers the hydrogen | Maximum STH 0.76%. Undamaged by deliberate ignition. The paper itself says hydrogen production is inefficient and energy negative overall | A demonstration scale, but a photocatalyst system (not a PEC cell) [Reference 10] |
| Jia et al. (2016) | A triple-junction solar cell with two PEM electrolyzers (concentrated light) | 48-hour average STH 30%. Current fell 10% over 48 hours (177 to 160 mA) | Laboratory. A benchmark, not PEC [Reference 5] |
| EU PECDEMO (2014-2017, FP7) | A hybrid with a metal-oxide photoelectrode placed in front of a smaller-band-gap thin-film solar cell. A plan to field-test a module of four devices (50 cm² or more each) | Planned goals: STH 10% on a small area (under 10% loss over 1,000 hours) and 8% for the module | Only the statement of goals was confirmed on CORDIS. We could not confirm numerical results. Not yet confirmed [Reference 18] |
Table 3 Scale and demonstrations of PEC and related approaches (all values as of their reports; Sourced. The PECDEMO row gives planned goals).
From this table we read the following (Commentary):
- PEC devices, in the range we confirmed, are a few cm² to a hundred or so cm². Demonstrations at m² scale are limited to the particulate photocatalyst system (0.76%).
- Scale and efficiency have not been achieved together. The high-efficiency reports (16-19%) are for small areas, while the larger reports (64-123 cm² and 100 m²) are 3.9% to 8.5% and 0.76%.
- The photocatalyst-panel paper states itself that hydrogen production is inefficient and energy negative overall, and its standing is to show that hydrogen can be recovered safely [Reference 10].
9. Cost and positioning
DOE sets its targets for photoelectrode PEC from a cost analysis (a 2009 report, in 2007 dollars) that assumes solar concentration of 10-15 times. The ultimate hydrogen cost target is US$2.10/kg and the 2020 target US$5.70/kg, with STH of 20% in 2020 and 25% ultimately Not yet confirmed [Reference 2].
| Item (photoelectrode system with concentration) | 2011 status | 2015 target | 2020 target | Ultimate target |
|---|---|---|---|---|
| Hydrogen cost (US$/kg, 2007 dollars) | — | 17.30 | 5.70 | 2.10 |
| STH | 4-12% | 15% | 20% | 25% |
| Photoelectrode cost (US$/m², example value) | — | 300 | 200 | 100 |
| Electrode lifetime (years, example value) | — | 0.5 | 2 | 10 |
Table 4 DOE technical targets for PEC (photoelectrode system with concentration) [Reference 2]. Not yet confirmed. Cost is that of the complete system for purified, 300 psi compressed hydrogen (a 50,000 kg/day plant, 2007 dollars). The photoelectrode cost and electrode lifetime are example parameters that would meet the targets.
The same DOE table notes, for the capital cost of the concentrator and PEC receiver, that improvements are needed but that this area is not presently a research focus of the Fuel Cell Technologies Office Sourced [Reference 2]. The targets rest on a 2009 cost analysis, and we could not confirm whether updated figures have been issued since.
Pinaud et al. analyzed four hypothetical large plants (10 tonnes a day) with DOE's H2A model and obtained a range of US$1.60-10.40 per kg of hydrogen (lower for the particle-bed systems, higher for the panel systems). They also say that improving STH in the panel systems could greatly reduce cost, and that if material performance targets are met the result could be consistent with DOE's threshold for dispensed hydrogen (US$2-4/kg) Sourced [Reference 16]. This, however, is a 2013 analysis of hypothetical plants and not a measured value.
Nishiyama et al. state that the most efficient solar hydrogen production schemes couple solar cells to electrolysis systems (30% at laboratory scale) [Reference 10] (approach 3 in Fig. 3). DOE lists as attractions of PEC the potential for high conversion efficiency at low operating temperatures and the potential to use cost-effective thin-film or particle semiconductor materials [Reference 1]. Within the sources we reviewed, however, none showed that PEC is cheaper than solar cells plus electrolysis as an actual plant. For how to read cost, the formula (LCOH) in our explainer on the cost of hydrogen production applies. A plant powered by sunlight alone runs only during daylight, so, as that explainer shows, the capital cost per kg of hydrogen takes a large share.
10. A materials engineer's view (2): putting yardsticks on the same basis
A half-cell photocurrent is not STH. The perovskite photoanode of Hansora et al. gave 22.8 mA/cm² at 1.23 VRHE, yet the STH of the system in which the same kind of device was wired to a solar cell and run without bias was 9.8% Sourced [Reference 9]. Multiplying 22.8 mA/cm² by 1.23 V and dividing by 100 mW/cm² gives about 28%, but that is a half-cell value measured with an applied potential and cannot be read as STH Our calculation. The operating current for bias-free operation at an STH of 9.8% is about 8 mA/cm² (Table 1).
How the energy of hydrogen is taken changes the number by a few percent. DOE's target table defines STH on an LHV basis and uses 1.23×10⁸ J/kg in its conversion [Reference 2]. The 12.4% of Khaselev and Turner (1998) was obtained from short-circuit current and the lower heating value [Reference 15]. Jia et al. calculate with the thermodynamic potential (1.23 V, about 237 kJ/mol) [Reference 5]. Compared with 237 kJ/mol, the LHV (33.3 kWh/kg, about 242 kJ/mol) is about 2% higher and DOE's conversion (about 248 kJ/mol) about 5% higher Our calculation.
The light source's spectrum and intensity must be calibrated. Young et al. say that their spectrally corrected on-sun benchmarking was validated with incident photon-to-current efficiency (IPCE) [Reference 7]. Chen et al. set out standards for methods, definitions and reporting to speed up PEC materials development [Reference 4]. When reading a materials paper, check (1) whether bias was applied, (2) half-cell or device, (3) light source and spectral correction, (4) area and duration, and (5) whether hydrogen was actually measured or converted from current (Commentary).
11. Limits, and what we could not confirm
(1) It is a research-stage technology, and these are not commercial values
All values here are reported values from the laboratory or small-scale demonstrations. They do not show the performance or price of any commercial equipment. DOE too treats PEC as a long-term technology pathway [Reference 1].
(2) Items we could not confirm
- Final numerical results of the EU PECDEMO project (only the statement of goals was confirmed on CORDIS).
- The detailed conditions and values of the 1972 paper by Fujishima and Honda (we confirmed the title and opening statement).
- Operating time and stability of the 19.3% device of Cheng et al. and the over-16% device of Young et al. (not stated in the abstracts).
- The latest best-performance values for Fe2O3, WO3 and TiO2 (within the scope of the review's statements, we show only band gaps and qualitative features).
- Primary sources that directly compare the long-term degradation mechanisms of protection layers.
- Whether DOE's PEC targets have been updated under its current strategy.
- Official material on PEC demonstration projects in Japan (not covered here).
(3) How this differs from photocatalysis
Particulate photocatalysts have a simple configuration with no electrodes or wiring, but they require safe handling of a mixed hydrogen-oxygen gas and recovery of the hydrogen [Reference 10]. The issues differ from those of a PEC cell, so we introduced only the panel-scale demonstration.
- PEC immerses a semiconductor electrode in water and splits it with light; DOE calls it a "long-term technology pathway" Sourced
- The highest efficiency is 19.3% on a small area, and larger devices are at a few percent to just under 10%. From the relation between hydrogen output and STH, even 10% needs about 68 m² for 1 kg/day Our calculation
- The better a material absorbs light, the less stable it is in water, so a protection layer (transparent, dense, charge-passing) is needed Sourced
- Reported durability is tens to a thousand hours, orders of magnitude from DOE's targets in years Sourced
- A half-cell photocurrent and STH are different quantities. Check bias, light source and how hydrogen was measured Our calculation
12. Glossary
- PEC (photoelectrochemical)
- An approach that shines light on a semiconductor electrode and uses the reaction at the electrode-electrolyte interface. Here, water splitting.
- STH (solar-to-hydrogen efficiency)
- The chemical energy of the hydrogen produced divided by the energy of the incident sunlight. Meaningful for bias-free operation.
- Band gap (Eg)
- The energy needed to lift an electron from the valence band to the conduction band. It sets which wavelengths a semiconductor can absorb.
- Photoanode / photocathode
- An electrode where light drives oxidation (water to oxygen; n-type) / reduction (hydrogen evolution; p-type).
- VRHE
- Potential on the reversible hydrogen electrode scale, which allows comparison independent of pH.
- Half-cell (three-electrode) measurement
- Measuring a single electrode with its potential controlled externally. Different from bias-free operation of a whole device.
- Tandem (multi-junction)
- A structure that stacks absorbers of different band gaps to add up voltage and share the spectrum.
- Protection layer
- A thin layer that separates the absorber from water and prevents corrosion. It must be transparent, dense and able to pass charge.
- ALD (atomic layer deposition)
- A film-growth method that builds up one atomic layer at a time, giving uniform, dense thin films.
- Faradaic efficiency
- The share of the charge passed that went into the intended reaction (hydrogen evolution).
- AM1.5G
- The standard spectrum of sunlight at the ground (global, usually normalized to 100 mW/cm²).
- Photocatalyst (particle type)
- A system in which semiconductor particles are dispersed in water and react without electrodes or wiring.
- H2A
- DOE's analysis model for the cost of hydrogen production.
13. References (primary sources)
- U.S. Department of Energy (DOE) "Hydrogen Production: Photoelectrochemical Water Splitting" — energy.gov
- U.S. Department of Energy (DOE) "DOE Technical Targets for Hydrogen Production from Photoelectrochemical Water Splitting" — energy.gov
- Fujishima, A. and Honda, K. "Electrochemical Photolysis of Water at a Semiconductor Electrode", Nature 238, 37-38 (1972) — nature.com
- Chen, Z. et al. "Accelerating materials development for photoelectrochemical hydrogen production: Standards for methods, definitions, and reporting protocols", J. Mater. Res. 25, 3-16 (2010), DOI 10.1557/JMR.2010.0020 (abstract consulted) — doi.org
- Jia, J. et al. "Solar water splitting by photovoltaic-electrolysis with a solar-to-hydrogen efficiency over 30%", Nat. Commun. 7, 13237 (2016) — nature.com
- Turan, B. et al. "Upscaling of integrated photoelectrochemical water-splitting devices to large areas", Nat. Commun. 7, 12681 (2016) — nature.com
- Young, J. L. et al. "Direct solar-to-hydrogen conversion via inverted metamorphic multi-junction semiconductor architectures", Nat. Energy 2, 17028 (2017) — nature.com
- Cheng, W.-H. et al. "Monolithic Photoelectrochemical Device for Direct Water Splitting with 19% Efficiency", ACS Energy Lett. 3, 1795-1800 (2018), DOI 10.1021/acsenergylett.8b00920 (abstract checked via Crossref and OpenAlex) — doi.org
- Hansora, D. et al. "All-perovskite-based unassisted photoelectrochemical water splitting system for efficient, stable and scalable solar hydrogen production", Nat. Energy 9, 272-284 (2024) — nature.com
- Nishiyama, H. et al. "Photocatalytic solar hydrogen production from water on a 100-m2 scale", Nature 598, 304-307 (2021) — nature.com
- Hu, S. et al. "Amorphous TiO2 coatings stabilize Si, GaAs, and GaP photoanodes for efficient water oxidation", Science 344, 1005-1009 (2014), DOI 10.1126/science.1251428 (abstract checked via OpenAlex) — doi.org
- Kuang, Y. et al. "Ultrastable low-bias water splitting photoanodes via photocorrosion inhibition and in situ catalyst regeneration", Nat. Energy 2, 16191 (2017) — nature.com
- Paracchino, A. et al. "Highly active oxide photocathode for photoelectrochemical water reduction", Nat. Mater. 10, 456-461 (2011) — nature.com
- Chen, S. and Wang, L.-W. "Thermodynamic Oxidation and Reduction Potentials of Photocatalytic Semiconductors in Aqueous Solution", Chem. Mater. 24, 3659-3666 (2012), DOI 10.1021/cm302533s (abstract checked via OpenAlex) — doi.org
- Khaselev, O. and Turner, J. A. "A Monolithic Photovoltaic-Photoelectrochemical Device for Hydrogen Production via Water Splitting", Science 280, 425-427 (1998), DOI 10.1126/science.280.5362.425 (abstract consulted) — doi.org
- Pinaud, B. A. et al. "Technical and economic feasibility of centralized facilities for solar hydrogen production via photocatalysis and photoelectrochemistry", Energy Environ. Sci. 6, 1983 (2013), DOI 10.1039/C3EE40831K (abstract consulted) — doi.org
- Raub Aini, A. et al. "Advances of nanostructured metal oxide as photoanode in photoelectrochemical (PEC) water splitting application", Heliyon 10, e39079 (2024), peer-reviewed review — pmc.ncbi.nlm.nih.gov
- European Commission (CORDIS) "Photoelectrochemical Demonstrator Device for Solar Hydrogen Generation (PECDEMO)", FP7, April 2014 to March 2017 — cordis.europa.eu
14. Claim-to-source audit
| Claim in the text | Basis | Label |
|---|---|---|
| DOE: PEC splits water into hydrogen and oxygen using a semiconductor immersed in a water-based electrolyte; a long-term technology pathway; two reactor classes (electrode and particle); improvements in efficiency, durability and cost needed | DOE Hydrogen Production: PEC Water Splitting Reference 1 https://www.energy.gov/eere/fuelcells/hydrogen-production-photoelectrochemical-water-splitting | Sourced |
| DOE's PEC technical targets: photoelectrode system with concentration, hydrogen cost of US$17.30 (2015), 5.70 (2020) and 2.10/kg (ultimate; 2007 dollars), STH of 15, 20 and 25%, 2011 status of 4-12% (thin film above 4% for hundreds of hours, crystalline above 12% for tens of hours), electrode lifetime of 0.5, 2 and 10 years (until efficiency falls to 80%; 10 years equals about 5 years of actual production), photoelectrode cost of US$300, 200 and 100/m². STH defined as hydrogen LHV divided by full-spectrum sunlight; STH = production rate × 1.23×10⁸ J/kg ÷ 1,000 W/m². A note that the concentrator-cost area is not presently a research focus. Targets for particle (dual-bed) systems | DOE PEC technical targets Reference 2 https://www.energy.gov/eere/fuelcells/doe-technical-targets-hydrogen-production-photoelectrochemical-water-splitting | Sourced Not yet confirmed |
| That in 1972 Fujishima and Honda reported "Electrochemical Photolysis of Water at a Semiconductor Electrode" in Nature 238, 37-38 (title and opening statement) | Fujishima and Honda, Nature (1972) Reference 3 https://www.nature.com/articles/238037a0 | Sourced |
| Chen et al.: the definitions of PEC efficiencies are organized, STH is emphasized, and standard measurement procedures for planar photoelectrodes are given (abstract) | Chen et al., J. Mater. Res. (2010) Reference 4 https://doi.org/10.1557/JMR.2010.0020 | Sourced |
| Jia et al.: a 48-hour average STH of 30% with a triple-junction solar cell and two PEM electrolyzers (concentrated), current falling from 177 to 160 mA (10%); the way STH was calculated (thermodynamic potential × current × Faradaic efficiency ÷ input light power); a thermodynamic minimum voltage of 1.23 V and operating voltages of 1.5-1.9 V; the then-highest PEC efficiency of 12.4% and a theoretical maximum of 23-32% for tandem PEC; none of photochemical, PEC and PV-electrolysis currently economically viable | Jia et al., Nat. Commun. (2016) Reference 5 https://www.nature.com/articles/ncomms13237 | Sourced |
| Turan et al.: a scalable integrated device, STH of 3.9% at 64 cm² (13 base units), bias-free stable operation for 40 hours for a wireless device; about 1.7-1.8 V for 10 mA/cm² with state-of-the-art catalysts, a band gap of about 2.2 eV or more for a single-junction cell, and 1.34 eV as the optimum single junction under AM1.5G | Turan et al., Nat. Commun. (2016) Reference 6 https://www.nature.com/articles/ncomms12681 | Sourced |
| Young et al.: over 16% STH from an inverted metamorphic GaInP/GaInAs tandem, a buried p-n junction cutting the voltage loss at the electrolyte interface by 0.55 V, spectrally corrected measurement validated with IPCE | Young et al., Nat. Energy (2017) Reference 7 https://www.nature.com/articles/nenergy201728 | Sourced |
| Cheng et al.: a monolithic photocathode with reduced reflectivity, a crystalline titania layer for protection, band alignment and Rh catalyst adhesion, 19.3% (acidic) and 18.5% (neutral) under simulated AM1.5G, 0.85 of the theoretical limit | Cheng et al., ACS Energy Lett. (2018) Reference 8 https://doi.org/10.1021/acsenergylett.8b00920 | Sourced |
| Hansora et al.: a FAPbI3 photoanode encapsulated with Ni foil/NiFeOOH, 22.8 mA/cm² at 1.23 VRHE, stable for 3 days under simulated 1 sun, STH of 9.8% with a same-size solar cell, 8.5% for mini-modules up to 123 cm² | Hansora et al., Nat. Energy (2024) Reference 9 https://www.nature.com/articles/s41560-023-01438-x | Sourced |
| Nishiyama et al.: a 100 m² array of panel reactors with an Al-doped SrTiO3 photocatalyst, operated for several months, hydrogen recovered with a commercial polyimide membrane, maximum STH of 0.76%, undamaged after ignition, hydrogen production inefficient and energy negative overall | Nishiyama et al., Nature (2021) Reference 10 https://www.nature.com/articles/s41586-021-03907-3 | Sourced |
| Hu et al.: Si, GaAs and GaP photoanodes are unstable in aqueous media; ALD TiO2 (4-143 nm) prevents corrosion, promotes hole conduction and is transparent; Si photoanodes ran over 100 hours at over 30 mA/cm² in 1.0 M KOH with Faradaic efficiency near 100%; photovoltages and photocurrents for GaAs and GaP | Hu et al., Science (2014) Reference 11 https://doi.org/10.1126/science.1251428 | Sourced |
| Kuang et al.: Mo-doped particulate BiVO4 photoanodes, stable oxygen evolution for over 1,000 hours at 0.4 VRHE, photocorrosion inhibition and catalyst regeneration | Kuang et al., Nat. Energy (2017) Reference 12 https://www.nature.com/articles/nenergy2016191 | Sourced |
| Paracchino et al.: a Cu2O photocathode protected with Al-doped ZnO and TiO2 nanolayers and decorated with Pt, up to −7.6 mA/cm² at 0 VRHE, active after 1 hour, Faradaic efficiency estimated near 100% | Paracchino et al., Nat. Mater. (2011) Reference 13 https://www.nature.com/articles/nmat3017 | Sourced |
| Chen and Wang: trends (i)-(iii) in the thermodynamic stability against oxidation and reduction of about thirty photocatalytic semiconductors | Chen and Wang, Chem. Mater. (2012) Reference 14 https://doi.org/10.1021/cm302533s | Sourced |
| Khaselev and Turner: a monolithic PV-PEC device with a hydrogen production efficiency of 12.4% from short-circuit current and the lower heating value (1998) | Khaselev and Turner, Science (1998) Reference 15 https://doi.org/10.1126/science.280.5362.425 | Sourced |
| Pinaud et al.: H2A-based hydrogen cost of US$1.60-10.40/kg for four hypothetical large plants (10 tonnes a day), lower for particle systems and higher for panel systems, sensitivity to STH, and possible consistency with DOE's US$2-4/kg threshold | Pinaud et al., Energy Environ. Sci. (2013) Reference 16 https://doi.org/10.1039/C3EE40831K | Sourced |
| Raub Aini et al. review: TiO2 anatase about 3.2 eV, ZnO about 3.3 eV, Fe2O3 about 2.1 eV, WO3 about 2.6-2.8 eV, BiVO4 about 2.4 eV, BiVO4 near its theoretical photocurrent limit of 7.5 mA/cm² by 2018, strengths and issues of each material, the three steps of water splitting | Raub Aini et al., Heliyon (2024) Reference 17 https://pmc.ncbi.nlm.nih.gov/articles/PMC11620101/ | Sourced |
| EU PECDEMO (FP7, April 2014 to March 2017) goals: a hybrid of a metal-oxide photoelectrode and a thin-film solar cell, STH of 10% on a small area with under 10% loss over 1,000 hours, and 8% in a field test of a module (four devices of 50 cm² or more) | CORDIS PECDEMO Reference 18 https://cordis.europa.eu/project/id/621252 | Sourced Not yet confirmed |
| The relation between STH, current and amount of hydrogen (STH (%) = 1.23 × J (mA/cm²); conversion of production rate), the values in Table 1 (operating current, g/h per m², g/day per m², area for 1 kg/day, about 3.4 km² for 50,000 kg/day), Fig. 4, 1,000 hours = about 0.11 years and about 0.5 years at 5 sun-hours a day, 22.8 mA/cm² × 1.23 V ÷ 100 mW/cm² = about 28%, 7.5 mA/cm² giving about 9.2%, and the differences among LHV, ΔG and DOE's 1.23×10⁸ J/kg (about 2% and 5%) | Our calculation. A Faradaic efficiency of 1, AM1.5G (100 mW/cm²), hydrogen energy from DOE's 1.23×10⁸ J/kg, 5 kWh/m² per day and no losses are our assumptions | Our calculation |
| That the better a material absorbs light the less stable it tends to be in water, and the four requirements of a protection layer; the grouping into four approaches (Fig. 3); the explanation of the band condition; the option of "cheaper but faster-degrading" materials; the distinction between a half-cell photocurrent and STH; the five checks for reading a report; the positioning of PEC | Our own arrangement and commentary based on the published material; not the views of any of the bodies or authors | Commentary |
| Numerical results of EU PECDEMO; the conditions of the Fujishima and Honda paper; the operating times of the devices of Cheng et al. and Young et al.; the latest best performance of each oxide; long-term degradation mechanisms of protection layers; whether DOE's targets have been updated; PEC demonstrations in Japan | Could not be confirmed in published primary sources within the scope of this article (or not covered), so not stated | Commentary |
| That Figs. 2 to 7 are explanatory drawings and not structures or measured data of real devices, and that Figs. 1 and 8 are AI-generated images | A note by this article | Commentary |
Last updated October 2026. Sources are limited to primary material (published material from DOE, the EU's CORDIS, abstracts and text of peer-reviewed papers, and a peer-reviewed review). Estimates from market research firms are not used. Readings from a materials point of view are marked as Commentary and kept separate from sourced fact. Numerical results of EU PECDEMO, details of the 1972 Fujishima and Honda paper, operating times of the devices of Cheng et al. and Young et al., long-term degradation mechanisms of protection layers, and whether DOE's targets have been updated are not stated here because no published primary source could be confirmed. The calculations in this article are derived from formulas and stated assumptions; they are not the performance of any particular device or plant. All figures are explanatory concept graphics or charts of our calculations. Figs. 2 to 7 are vector drawings; Figs. 1 and 8 are AI-generated images, and none of them shows a real device, structure or measured data.