TECHNOLOGY EXPLAINER
Graphene
— which sample was that number measured on?
The strength, thermal conductivity and mobility quoted for graphene were measured on small single-crystal pieces that were exfoliated or suspended in air. In powders, inks and films on copper foil, layer count, defects, impurities and transfer residue decide whether those numbers survive. This article sorts out what each production route actually delivers, how to read Raman data, how far each application has progressed, and why transfer and scale-up are hard, using papers and standards.
- What graphene is (the short version)
- Structure and properties — the sample state behind each number
- Five production routes and what each delivers
- Our calculation: what is left after oxidation and reduction
- Reading quality by Raman — layer count and defect indicators
- A materials engineer's view (1): what to check on a "graphene" specification
- Applications — batteries, composites, inks and thermal management by stage
- Transfer and scale-up — making it versus putting it where it is used
- A materials engineer's view (2): reading numbers by sample state
- What could not be confirmed / how this fits with other articles in the series
- Glossary / Primary sources / Claim-to-source audit
Sourced = a statement in a paper, standard or product page (link given)
Our calculation = a figure this article derived, with the assumptions spelled out
Not yet confirmed = a plan or outlook with no confirmed record
Materials-design interpretations are marked separately as Commentary.
Sensors (electrodes, FETs, functionalisation) were covered in our biosensor explainer on graphene and carbon nanotubes. This article stays with the material itself: production, quality, applications and scale-up.
1. What graphene is (the short version)
Graphene is a one-atom-thick sheet of carbon atoms arranged in a hexagonal (honeycomb) lattice. In 2004 Novoselov and co-workers reported films a few atomic layers thick, peeled from graphite, with a room-temperature mobility of about 10,000 cm²/V·s and electric-field-induced electrons and holes Sourced [Ref. 1].
- The numbers are high: the strength of a free-standing monolayer, the thermal conductivity of a suspended monolayer and the mobility of a suspended device have all been reported far above those of most materials Sourced (Chapter 2, with measurement method and sample for each).
- The route changes the material: peeling graphite, growing on copper, oxidising then reducing, or building directly from a carbon source all give different layer counts, defects, oxygen, impurities and flake sizes (Chapters 3 to 5).
- Market labels are not uniform: a 2018 survey of samples from 60 producers reported that overall quality was rather poor and that many were graphite microplatelets Sourced [Ref. 2] (Chapter 6).
The high numbers attach not to the name of the substance but to the sample they were measured on. The strength or thermal conductivity of a free-standing single-crystal piece cannot be read as the performance of a powder additive or a printed ink. On a specification, look past the word "graphene" to the distributions of layer count and flake size, the defects and the oxygen content (Commentary).
2. Structure and properties — the sample state behind each number
Below, representative graphene properties are listed together with what was measured. All come from small, low-defect monolayer pieces, and none translates directly into the performance of a powder or a film.
| Property | Reported value | Sample, method, conditions | Source |
|---|---|---|---|
| Strength and elastic modulus | Second-order elastic stiffness 340 N/m, breaking strength 42 N/m. Converted to bulk graphite: E = 1.0 TPa, intrinsic strength 130 GPa | Free-standing monolayer membrane; nanoindentation by atomic force microscopy (AFM). Described in the abstract as the intrinsic strength of a defect-free sheet | Lee et al. 2008 (Science) [Ref. 3] |
| Thermal conductivity | About 4.84 × 10³ to 5.30 × 10³ W/m·K at room temperature | Suspended monolayer graphene; extracted from the shift of the Raman G-peak frequency with laser power (optothermal method) | Balandin et al. 2008 (Nano Letters) [Ref. 4] |
| Mobility (suspended) | Above 200,000 cm²/V·s at an electron density of about 2 × 10¹¹ cm-2 | Monolayer suspended about 150 nm above a Si/SiO₂ gate electrode, cleaned in situ by current heating. The abstract does not state the temperature | Bolotin et al. 2008 (Solid State Communications) [Ref. 5] |
| Mobility (on a substrate) | Mobility and carrier homogeneity "almost an order of magnitude" better than on SiO₂ | Exfoliated mono- and bilayer graphene on single-crystal hexagonal boron nitride (h-BN), assembled by a mechanical transfer process | Dean et al. 2010 (Nature Nanotechnology) [Ref. 6] |
| Mobility (first report) | About 10,000 cm²/V·s at room temperature, with carrier concentrations up to 10¹³ cm-2 | Films a few atomic layers thick peeled from graphite; electrons and holes induced by gate voltage | Novoselov et al. 2004 (Science) [Ref. 1] |
| Mobility (CVD film) | Up to 4050 cm²/V·s at room temperature | CVD film grown on copper foil, transferred to Si/SiO₂, dual-gated field-effect transistor | Li et al. 2009 (Science) [Ref. 7] |
| Mobility and sheet resistance (large-area CVD film) | Up to about 23,000 cm²/V·s at 4 K; room-temperature sheet resistance about 230 Ω/sq | A (5 × 50) cm² film grown on single-crystal Cu(111) foil, with more than 99% highly oriented grains | Xu et al. 2017 (Science Bulletin) [Ref. 8] |
All Sourced (as stated in each paper's abstract). Conditions differ, so this table does not rank the rows.
Converting strength to three dimensions depends on an assumption
Lee et al. obtained their values first as in-plane force per unit width (N/m), and converted them to bulk graphite afterwards Sourced [Ref. 3]. A monolayer has no well-defined thickness, so a figure in GPa depends on the thickness assigned to a layer. Here is a check Our calculation.
- Assumption: graphite interlayer spacing of 0.335 nm (our assumption)
- Modulus: 340 N/m ÷ 0.335 × 10⁻⁹ m = about 1.01 × 10¹² Pa = about 1.0 TPa (matches the paper's 1.0 TPa)
- Strength: 42 N/m ÷ 0.335 × 10⁻⁹ m = about 1.25 × 10¹¹ Pa = about 125 GPa (close to the paper's 130 GPa)
Assumptions and limits: we have not checked the paper's conversion details, so we cannot say why 125 and 130 differ. The point here is that a figure in GPa rests on a convention about layer thickness. In composite design, do not multiply the monolayer strength by a volume fraction; look at how load is transferred at the interface (Chapter 7).
3. Five production routes and what each delivers
Graphene production divides broadly into thinning down graphite (top-down) and building up from carbon (bottom-up). A 2020 review (Backes et al.) sets out production and processing methods and the characterisation procedures in practical, reproducible detail Sourced [Ref. 9]. Below, the differences that matter for material quality are lined up with reported values.
| Route | Reported values and statements (with conditions) | Issues on the materials side (source or commentary) |
|---|---|---|
| 1 Mechanical exfoliation | Micromechanical cleavage of graphite produced two-dimensional crystals, including single layers of boron nitride, graphite, dichalcogenides and complex oxides, stable in air, of high crystal quality and continuous on a macroscopic scale Sourced [Ref. 10] | A laboratory method yielding small flakes, not an industrial-scale process (Commentary; also noted in the biosensor article) |
| 2 Liquid-phase exfoliation | In organic solvents such as NMP, concentrations up to about 0.01 mg/mL; monolayer yield about 1 wt% (possibly 7 to 12 wt% with further processing). The authors say X-ray photoelectron, infrared and Raman spectroscopy showed no defects or oxides Sourced [Ref. 11] | The dispersion is heterogeneous in flake size and thickness, which is described as "a critical bottleneck for applications"; centrifugation is used to sort by size and thickness Sourced [Ref. 9] |
| 3 Oxidation, then reduction | Hydrazine-reduced graphene oxide aggregated: BET specific surface area 466 m²/g, C/O atomic ratio 10.3 (2.7 for the starting graphene oxide), compressed-powder conductivity about 2 × 10² S/m at 30% relative humidity Sourced [Ref. 12]. The classic oxidation method is that of Hummers and Offeman (1958) Sourced [Ref. 13] | Oxygen remains after reduction (C/O = 10.3), and restacking pulls specific surface area well below the theoretical value (Chapter 4). Luong et al. also note the defective, perforated structure this route leaves Sourced [Ref. 14] |
| 4 CVD | Centimetre-scale films from methane on copper foil, predominantly single-layer with fewer than 5% few-layer area; the low solubility of carbon in copper appears to make growth self-limiting. Mobility up to 4050 cm²/V·s Sourced [Ref. 7]. On Ni the result is a graphitised polycrystalline film, and single layers are hard to obtain over large areas Sourced [Ref. 9] | Transfer is essential (Chapter 8). Grain boundaries, wrinkles and few-layer patches in the grown film carry over into devices built on the transferred film (Commentary) |
| 5 Direct synthesis | Flash Joule heating of carbon sources such as coal, petroleum coke, biochar, carbon black and waste plastic gave gram-scale graphene (flash graphene) in under one second, with turbostratic stacking between layers. From carbon black, anthracitic coal or calcined coke, yields of 80 to 90% and carbon purity above 99% with no purification; the authors report a low-intensity or absent Raman D band Sourced [Ref. 14]. HydroGraph states on its own website that it makes graphene from hydrocarbon gases by "detonation synthesis" Sourced (company description; the page gives no performance values) [Ref. 15] | Turbostratic stacking means the layers exfoliate readily during composite formation, according to the authors Sourced [Ref. 14]. On the other hand, single-layer indicators such as the Raman 2D band cannot be read the same way as for AB-stacked layers (Commentary). Yield and purity depend on the feedstock |
Values are as stated in each paper's abstract. Conditions (solvent, substrate, feedstock, method) differ, so the table does not rank the routes.
4. Our calculation: what is left after oxidation and reduction
Reducing graphene oxide is the route that most easily gives dispersions or powders in bulk from graphite. Using Stankovich et al.'s numbers, let us count how far "reduced graphene" sits from an ideal sheet Our calculation.
- Theoretical specific surface area (from geometry): take a carbon–carbon bond length of 0.142 nm (our assumption). Area of the hexagonal unit cell = (3√3/2) × 0.142² = about 0.0524 nm² (two atoms), so about 0.0262 nm² per atom. Mass of one carbon atom = 12.011 ÷ 6.022 × 10²³ = about 1.994 × 10⁻²³ g. That gives about 1,314 m²/g for one side and about 2,630 m²/g for both sides, in close agreement with the theoretical value of 2,620 m²/g the paper cites.
- Ratio to the measured value: 466 ÷ 2,620 = about 18%. The paper explains that reduction made the graphene oxide sheets aggregate, and overlapping sheets lowered the specific surface area Sourced [Ref. 12].
- Oxygen fraction: at C/O = 2.7, O/(C + O) = 1 ÷ 3.7 = about 27%; at C/O = 10.3, 1 ÷ 11.3 = about 8.8%. Reduction lowers it, but not to zero.
Assumptions and limits: the 0.142 nm bond length is our assumption, and the 2,620 figure is a cross-check against the value the paper cites. The 466 m²/g is a nitrogen-adsorption BET result for one sample under one condition. The conductivity of about 2 × 10² S/m is for compressed powder, and the paper itself says the extrapolated intrinsic value is probably over-estimated Sourced [Ref. 12].
5. Reading quality by Raman — layer count and defect indicators
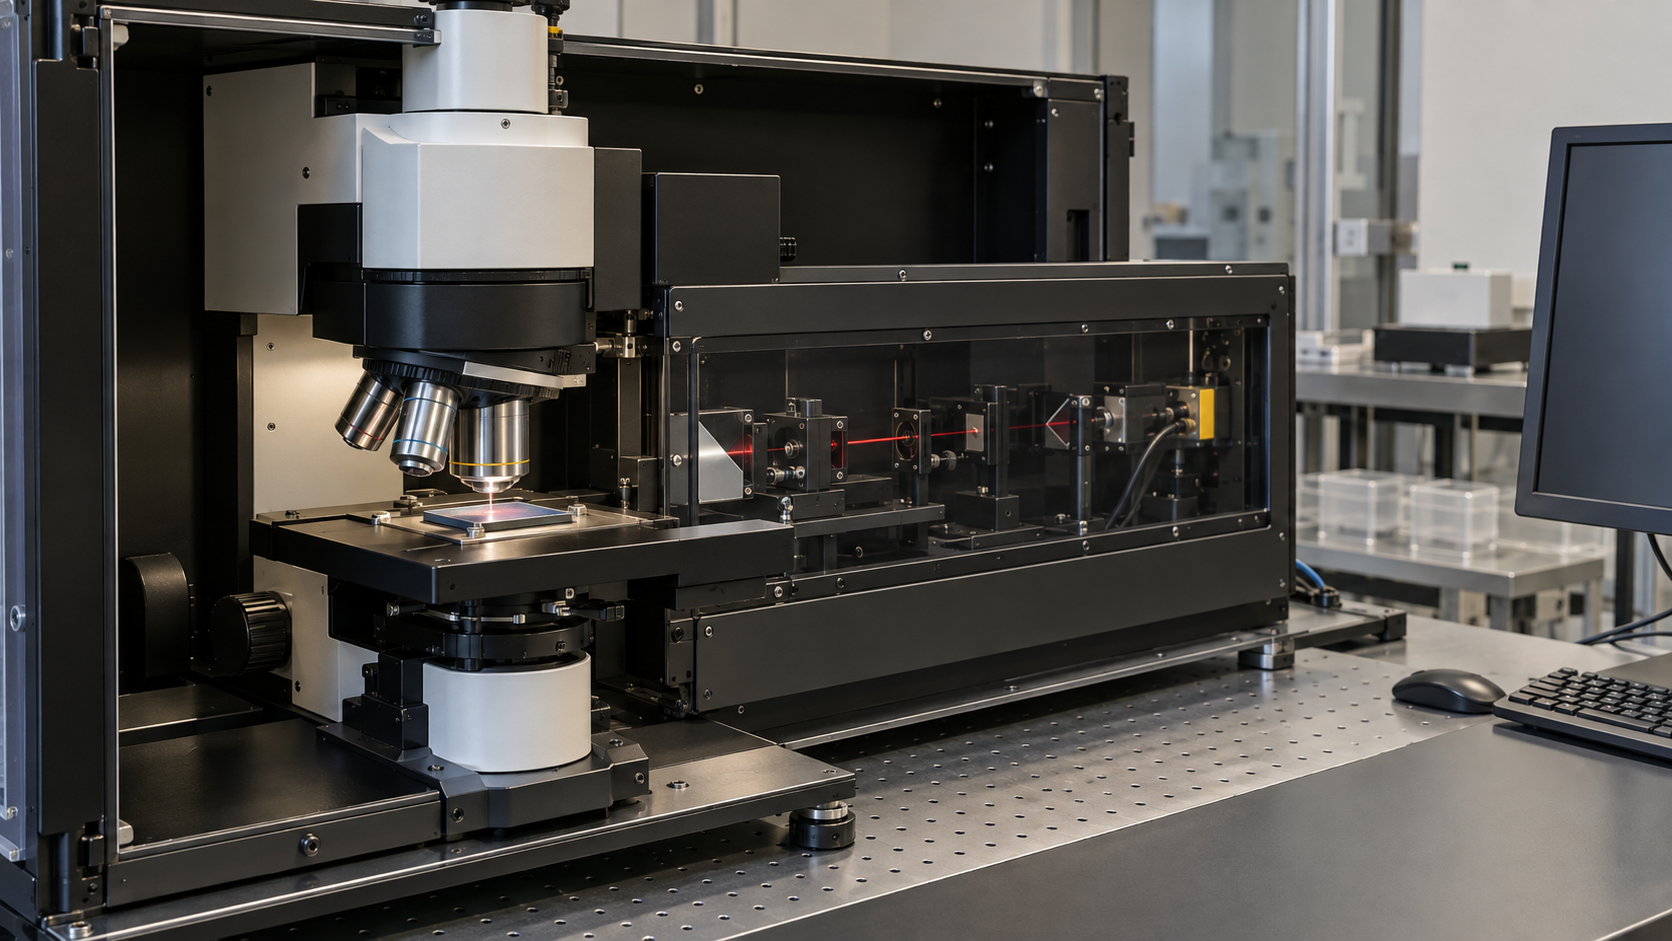
The most common quality check on graphene is Raman spectroscopy, in which laser light probes the vibrations of the carbon lattice. A 2013 review by Ferrari and Basko says Raman can determine the number and orientation of layers, the quality and types of edge, and the effects of electric and magnetic fields, strain, doping, disorder and functional groups Sourced [Ref. 16].
- Layer count: Ferrari et al. (2006) reported that the shape, width and position of the 2D band (second order of the D band) change with the number of layers, and the G band shifts slightly down, allowing non-destructive, high-throughput identification of layers Sourced [Ref. 17].
- Amount of defects: Cançado et al. (2011), working on Ar+-bombarded graphene, showed that for a given defect density the ratio of D to G peak intensities (ID/IG) depends strongly on laser excitation energy. ID/IG peaks at an inter-defect distance of about 3 nm, so one ratio can correspond to two different defect densities; the width of the G peak resolves the ambiguity Sourced [Ref. 18].
- Type of defect: Eckmann et al. (2012) reported that the D to D′ intensity ratio is largest for sp³ defects (about 13), about 7 for vacancy-like defects and smallest (about 3.5) for boundaries in graphite Sourced [Ref. 19].
Specifications for powders and inks sometimes give ID/IG as a single number. From the three reports above, the following can be said (Commentary).
- Excitation wavelength: the same sample gives a different ID/IG at a different laser wavelength. Compare only at the same wavelength.
- Flake edges: a D band also appears at graphite boundaries (ID/ID′ about 3.5). Small flakes have many edges, so a D band can appear without structural defects. For liquid-exfoliated flakes the D band is not necessarily the amount of structural defects.
- The heavily damaged side: the ratio peaks at an inter-defect spacing of about 3 nm, so a low ratio does not guarantee a clean sample; a badly damaged one can also give a small value.
- Stacking: a turbostratically stacked sample such as flash graphene shows a 2D band that looks different from AB-stacked multilayers, so single-layer indicators are hard to apply directly (Luong et al. report that turbostratic stacking can be distinguished from graphite Sourced [Ref. 14]).
So do not settle quality from one Raman point. Ask for the excitation wavelength, the number of measurement points, the flake-size distribution and the shape of the 2D band together. Layer count, flake size and oxygen content are backed up by other measurements (AFM, TEM, elemental analysis, XPS); the Kauling survey also combined several methods Sourced [Ref. 2].
6. A materials engineer's view (1): what to check on a "graphene" specification
To classify graphene-based materials, the European GRAPHENE Flagship defined three physical-chemical descriptors: number of layers, lateral dimension and the atomic carbon-to-oxygen ratio (C/O) Sourced [Ref. 20]. The terminology standard is ISO/TS 80004-13:2024 (vocabulary for graphene and other two-dimensional materials) Sourced [Ref. 21]. Kauling et al. (2018) examined samples from 60 producers by electron microscopy, AFM, Raman, elemental analysis and XPS. They concluded that the classification of flakes used in the market is wrong, that a classification by distribution functions of layer number and flake size is needed, and that many producers make graphite microplatelets Sourced [Ref. 2]. ISO/TS 21356-1:2021 specifies, for graphene from powders and dispersions, the characterisation of layer number and thickness, lateral flake size, degree of disorder, layer orientation and specific surface area, with the sequence of measurement methods, sample preparation and data analysis Sourced [Ref. 22] (the standard's text is paywalled; we confirmed only what its catalogue page says).
Read as incoming-inspection items, these three sources give the following (Commentary).
| Item to confirm | Why it matters | Main methods (as the sources describe them) |
|---|---|---|
| The distribution of layer number | An average of "a few layers" can come from a mix of monolayers and a dozen layers. Properties change with layer number | AFM, Raman (2D band), TEM Sourced [Ref. 2, 9] |
| Distribution of lateral flake size | Affects conductive networks, barrier performance and dispersion viscosity. More edges also mean more Raman D band | Electron microscopy, AFM Sourced [Ref. 2] |
| C/O ratio (amount of oxygen) | Samples from oxidation and reduction retain oxygen (Chapter 4), which changes conductivity and dispersibility | Elemental analysis, XPS Sourced [Ref. 2, 20] |
| Defects (ID/IG with excitation wavelength) | ID/IG changes with excitation wavelength and flake edges (Chapter 5) | Raman, with excitation wavelength and number of points stated Sourced [Ref. 18] |
| Impurities and form | Residual graphite, catalyst metals, and residues of solvent, dispersant or polymer. For dispersions: solvent, concentration and stabiliser | Elemental analysis, XPS (Commentary; the sources go only as far as listing the methods) |
| Batch-to-batch variation | Liquid-phase exfoliation has been shown to be statistical in nature Sourced [Ref. 2]. The same name can hide a distribution that moves from lot to lot | Ask for the distributions lot by lot (Commentary) |
The methods follow the Kauling survey of 60 producers and the Backes review; arranging them into items is this article's own commentary.
7. Applications — batteries, composites, inks and thermal management by stage
For each application, what has been reported is separated from how far it has progressed. Commercial adoption is stated only where public or company-official material could confirm it; what could not be confirmed is listed in Chapter 10.
| Application | Report or statement (with conditions) | Stage |
|---|---|---|
| Conductive additive in batteries | Graphene used as a planar conductive additive in a LiFePO₄ cathode. With a much lower fraction than commercial carbon-based additives, it showed better charge/discharge performance than the commercial cases, and better than carbon nanotubes at similar fractions Sourced [Ref. 23]. A graphene–silica assembly ("graphene ball") was coated at 1 wt% on a Ni-rich layered cathode; cycle life and fast charging improved, the full cell's volumetric energy density was 27.6% higher than the control, and 78.6% capacity was retained after 500 cycles at 5C and 60 °C Sourced [Ref. 24] | Laboratory to prototype cells. Adoption in commercial cells not confirmed |
| Composites | Carbon nanotube and graphene composites have been studied for about two decades, yet questions remain about their practical impact. The causes are given as poor load transfer, interfacial engineering, dispersion and viscosity-related processing difficulty Sourced [Ref. 25]. The properties of graphene-based polymer nanocomposites depend on both graphene's intrinsic properties and its state of dispersion in the matrix Sourced [Ref. 26] | Research and development. Guaranteed values in production goods not confirmed |
| Inks (printing) | Ink made by liquid-phase exfoliation in NMP was inkjet-printed into thin-film transistors (mobility up to about 95 cm²/V·s) and transparent conductive patterns (about 80% transmittance, about 30 kΩ/sq) Sourced [Ref. 27]. An ethanol and ethyl cellulose ink reached a resistivity of 4 mΩ·cm after annealing at 250 °C for 30 min Sourced [Ref. 28] | Laboratory. Needs a heat-resistant substrate and annealing |
| Thermal management | Graphene films and paper above 1,000 W/m·K have been reported (table below). As a product, Panasonic sells a "pyrolytic graphite sheet" (PGS) | Films: research. Graphite sheet: a product (under a different name from graphene) |
(1) Conductive additive in batteries — bridging with a plane
A conductive additive links active-material particles and builds paths for electrons. Whereas particulate additives touch particles at points, Su et al. describe the graphene network as a "plane-to-point" contact mode, with a thin, flexible planar structure favouring electron transport Sourced [Ref. 23].
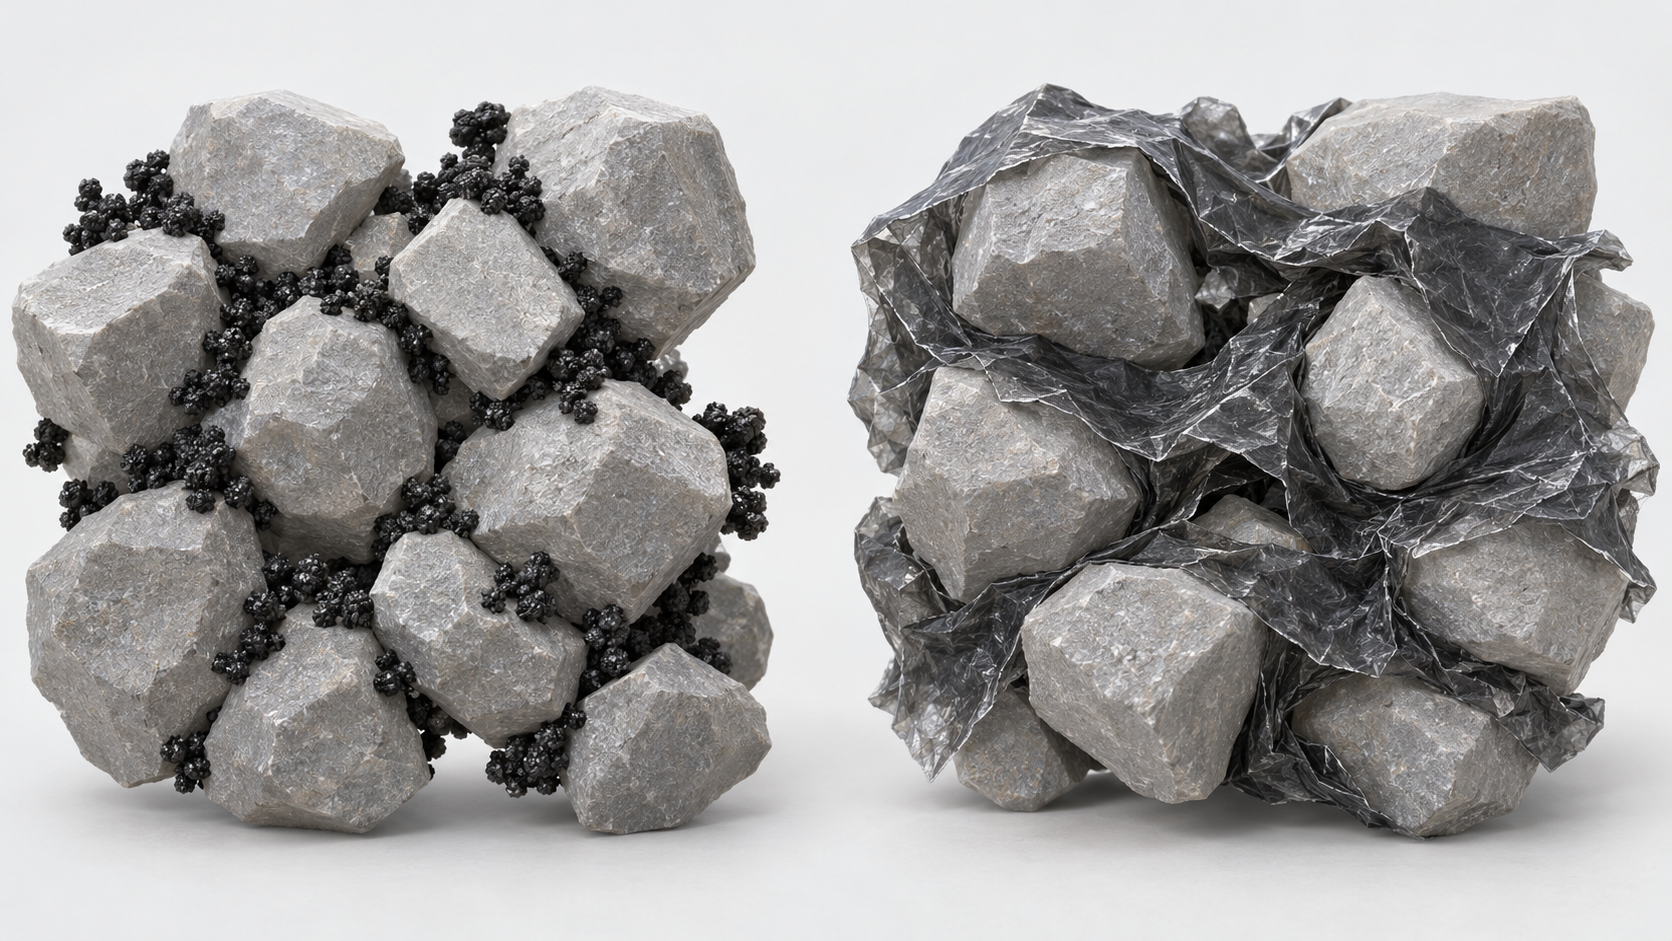
Shapes, colors and dimensions are illustrative. Consult the original schematic below for exact values and label correspondence.
View the original SVG schematic and exact annotations
Reading guide and original schematic labels: Contact modes of conductive additives (concept) / Left: particulate additive (point contact). Right: planar graphene additive (plane contacts particles) / Particulate additive (point to point) / Planar additive (plane-to-point) / Touch at small points / One sheet covers and links several particles / The contact-mode contrast is a concept described by Su et al. / * Particle size, number and layout are schematic; not an electrode cross-section, nor additive amounts or performance.
What practitioners should watch is how hard it is to disperse graphene through a whole electrode. Son et al.'s graphene ball is a three-dimensional assembly grown by CVD around silica particles, and they coat it onto cathode particles by "Nobilta" milling (a dry powder-processing method) Sourced [Ref. 24]. The paper presents this as showing the possibility of reaching 800 Wh/L in a commercial cell; it is not a record of commercialisation Not yet confirmed.
(2) Composites — the interface matters more than the number
The monolayer strength in Chapter 2 only counts once the graphene is dispersed in a matrix and load passes from the matrix into it. For composites with carbon nanotubes or graphene, Kinloch et al. name poor load transfer, interface design, dispersion and viscosity-related processing difficulty as the issues, and say there has been little effort to identify selection rules for particular applications Sourced [Ref. 25]. Powder made by oxidation and reduction can restack so that specific surface area falls to about 18% of the theoretical value in one example (Chapter 4), so re-exfoliation during dispersion becomes a design item on the materials side (Commentary).
(3) Inks — the pairing of annealing and substrate
Printing inks are an application of the liquid-phase dispersions in Chapter 3 (route 2). Torrisi et al.'s printed film had about 80% transmittance and about 30 kΩ/sq, and Secor et al.'s film reached 4 mΩ·cm after 250 °C annealing Sourced [Ref. 27, 28]. The same "graphene ink" can differ by an order of magnitude or more depending on solvent, stabiliser and heat treatment; this connects to the biosensor article's section on transfer residue and ink annealing temperature.
(4) Thermal management — read "graphene" and "graphite sheet" separately
In-plane heat spreading is a representative proposed application of graphene. But values obtained under different conditions are mixed together.
| Object | Thermal conductivity (W/m·K) | Sample, conditions, source |
|---|---|---|
| Suspended monolayer graphene | About 4.84 × 10³ to 5.30 × 10³ | Room temperature, optothermal method using the Raman G peak Sourced [Ref. 4] |
| Graphene film (microfolded structure) | 1940 ± 113 | Film made by folding "debris-free giant graphene sheets" into microfolds; fracture elongation 16%, withstands more than 6000 folding cycles Sourced [Ref. 29] |
| Graphene paper | 1238.3 to 1434 | Large-area free-standing paper made by electrospray deposition with a roll-to-roll process, then compaction and thermal annealing Sourced [Ref. 30] |
| Pyrolytic graphite sheet (PGS, Panasonic) | 700 (100 µm) to 1950 (10 µm) | Manufacturer's stated value (table on the product page). The name says graphite. The page does not state the direction or method of measurement Sourced [Ref. 31] |
Values from different samples, methods and directions are set side by side; this is not a ranking. The single-layer value and the values for macroscopic films and sheets are different quantities.
Using the table on the Panasonic page, let us calculate what happens when thickness changes within one product family Our calculation.
- Assumptions: the conductivities in the table are taken as in-plane (the page does not state a direction; this is our assumption). Thickness is the nominal graphite layer; the PET (30 µm) and adhesive (18 µm) of the insulated types are listed as separate layers on the page and are not counted.
- 10 µm × 1950 = 0.0195 W/K / 17 µm × 1850 = 0.0315 / 25 µm × 1600 = 0.040
- 40 µm × 1350 = 0.054 / 50 µm × 1300 = 0.065 / 70 µm × 1000 = 0.070 / 100 µm × 700 = 0.070
Reading: a thicker sheet carries more heat per unit width, but 70 µm and 100 µm give the same value (0.070 W/K), so the extra thickness is cancelled by the lower conductivity. To carry more heat, look not only at the conductivity figure but at thickness, stacking and contacts (interfaces) (Commentary).
8. Transfer and scale-up — making it versus putting it where it is used
CVD graphene on copper foil has to be moved to where it will be used (a silicon wafer, glass, a film). The Backes review says that single-layer graphene from CVD on metals or from molecular bottom-up routes must be transferred to the final substrate, and that advances in large-area, high-quality growth must be matched by advances in transfer Sourced [Ref. 9]. Etch-based transfer of the metal is reliable but time- and resource-consuming, and damages the graphene and leaves metal and etchant residues; electrochemical delamination and dry transfer are named as alternatives (dry transfer being less detrimental to quality and allowing deterministic placement) Sourced [Ref. 9].
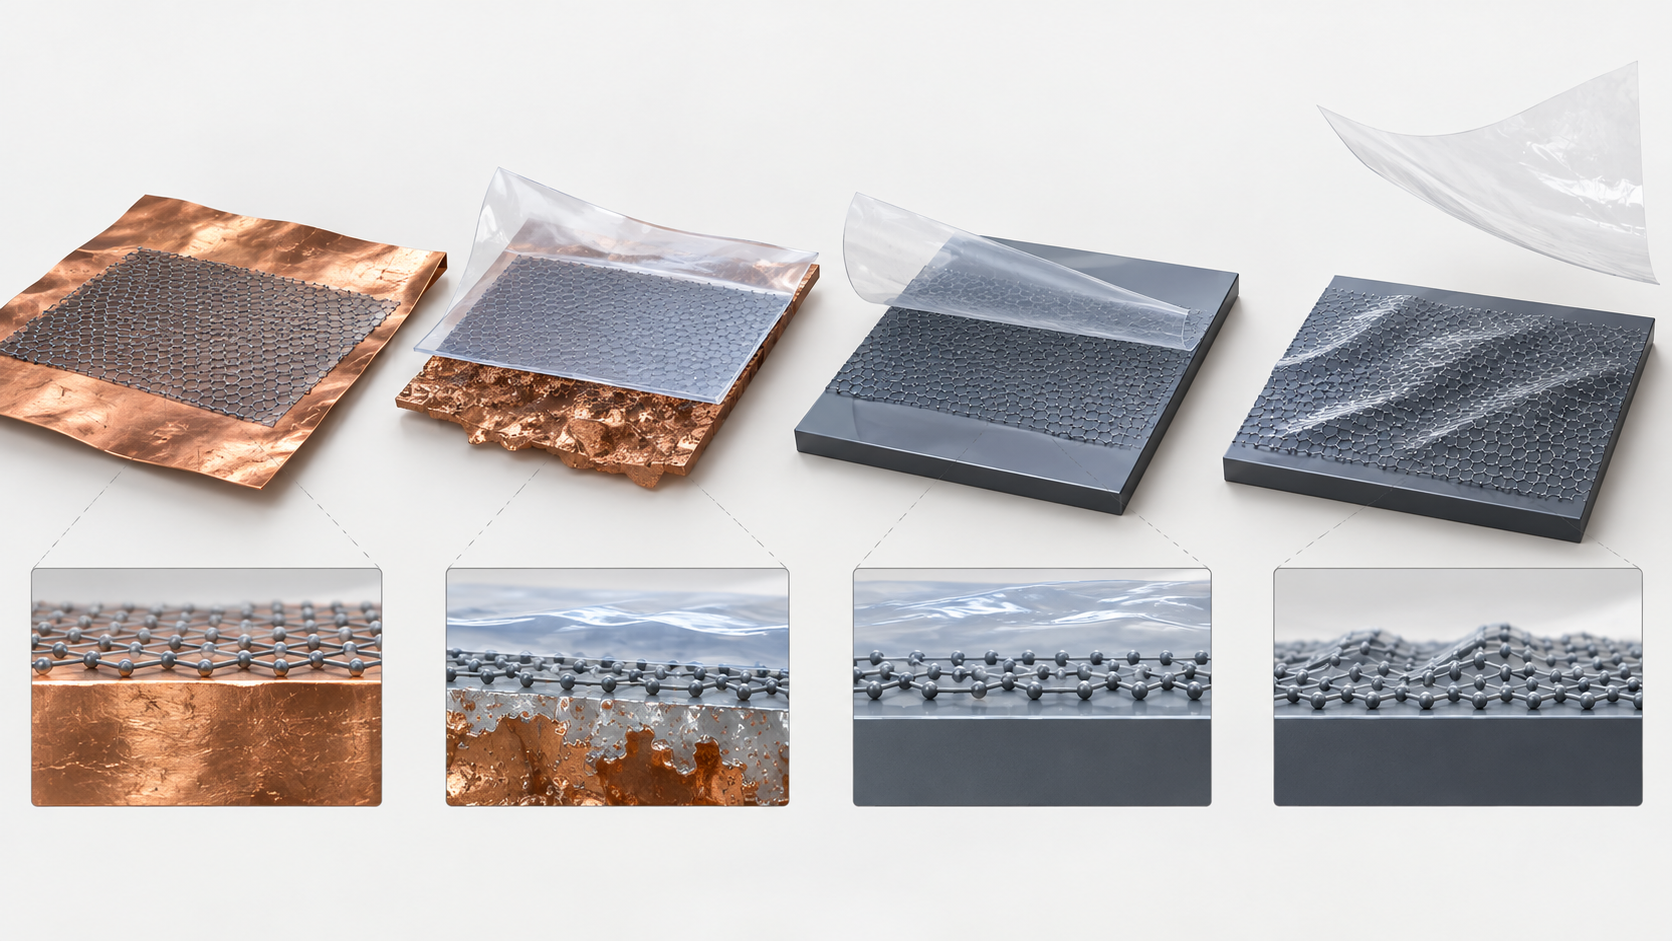
Shapes, colors and dimensions are illustrative. Consult the original schematic below for exact values and label correspondence.
View the original SVG schematic and exact annotations
Reading guide and original schematic labels: Wet transfer of CVD graphene and where quality is lost (concept) / A typical flow using a PMMA support film (Suk et al.). Step names are simplified / 1 Growth / 2 Support film / 3 Remove copper / 4 Place / 5 Remove film / Graphene film on / copper foil / Spin-coat PMMA / Dissolve the copper / in etchant / Scoop it onto the / target substrate / Remove the polymer / with solvent / Where quality suffers (grouped from the papers and the review) / Polymer layer / PMMA is the / typical example / Damage, metal residue / Etch transfer can / tear the film and / leave residue / Cracks, wrinkles / Suk et al. report / fewer cracks and / tears on flat substrates / Chemical residue / Residue after transfer / alters physical and / electrical properties / * Flow after Suk et al. [Ref. 32]; damage and residue: Backes et al. [Ref. 9]; residue effect: Pirkle et al. [Ref. 33]. / * Actual conditions, chemicals and order differ by method. Electrochemical delamination and dry transfer are alternatives.
Suk et al. presented dry and wet transfer with a PMMA support film as reproducible methods, reporting 98% of 2.7 µm holes in a perforated substrate covered by a continuous film, fewer cracks and tears on flat substrates, and, for a monolayer film on glass, a sheet resistance of about 980 Ω/sq with 97.6% transmittance Sourced [Ref. 32]. That chemical residue remaining after transfer affects physical and electrical properties is the subject of the paper by Pirkle et al. (by its title) Sourced [Ref. 33].
On scale-up, Bae et al. made 30-inch films roll to roll and reported a sheet resistance of about 125 Ω/sq with 97.4% transmittance Sourced [Ref. 34]. On integration into semiconductor lines, Neumaier et al. state that integrating an unconventional material such as graphene into an established fabrication line is a critical step towards commercialisation Sourced [Ref. 35] (we confirmed only the summary). For large single-crystal films, Xu et al. report growing a (5 × 50) cm² film in 20 minutes Sourced [Ref. 8].
Our calculation
- Area = 5 cm × 50 cm = 250 cm². In a 20-minute growth that is 12.5 cm²/min (750 cm²/h).
- A 300 mm wafer has an area of π × 15² = about 707 cm². So 250 ÷ 707 = about 0.35 wafer.
Assumptions and limits: the area and growth time are from the paper; the 300 mm wafer diameter is a comparison we chose. The growth time excludes heating, cooling and transfer. The mobility (about 23,000 cm²/V·s) is for 4 K, not room temperature.
9. A materials engineer's view (2): reading numbers by sample state
- Thermal conductivity: the suspended monolayer's roughly 5,000 W/m·K and the 1,000 to 2,000 W/m·K range of macroscopic films and sheets are different quantities, probably because grain boundaries, stacking, folding and contacts enter (Commentary). Design with a value measured in the form you will use (thickness, stacking, direction).
- Strength: 130 GPa is the intrinsic value for a defect-free monolayer. In composites, load transfer, interface and dispersion decide the outcome (Kinloch et al.).
- Mobility: 200,000 cm²/V·s is for a suspended device. It falls on a substrate and improves on a smooth one such as h-BN (Dean et al.). A device's mobility is the sum of the material and the substrate below, the encapsulation above and any residue.
- Specific surface area: against a theoretical value of about 2,630 m²/g, the reduced powder gave 466 m²/g. Agglomerated faces cannot serve as active sites (Chapter 4).
- Directly synthesised powder: turbostratic stacking cuts both ways: easy exfoliation (an advantage for compounding, as the authors state) but single-layer indicators are hard to use. Decide which items you need for your application first; that is the shortcut.
10. What could not be confirmed / how this fits with other articles in the series
(1) What we could not confirm within the scope of this article
- Public or company-official material showing that graphene is used as a standard conductive additive in commercial battery cells could not be confirmed. The battery values in Chapter 7 are laboratory or prototype-cell reports Not yet confirmed.
- Primary sources for guaranteed property values in production composites and for the market price or production cost of graphene powder could not be confirmed.
- The Panasonic product page gave no direction or method of measurement for thermal conductivity that we could confirm. The calculation in Chapter 7 assumes in-plane.
- We did not confirm the production scale or quality control of flash graphene and other direct-synthesis routes beyond the papers. HydroGraph's page gives no figures such as carbon purity, so none appears here.
- The text of standards such as ISO/TS 21356-1 is paywalled, so we limited ourselves to what the catalogue pages say.
(2) Safety, and the sensor side
The safety of graphene-based materials is not settled by the name of the material. The review by Fadeel et al. says that not all graphene-based materials are alike and that it is essential to disentangle the structure-activity relationships Sourced [Ref. 36]. Handling safety of powders has to be checked for each shape, size, surface and oxygen content, and this article gives no individual advice. For sensors (electrodes, FETs, anchoring of recognition elements, the Debye length) and for the assessments of carbon nanotubes by international bodies, see our biosensor explainer on graphene and carbon nanotubes. The material side of carbon nanotubes (production, chirality, separation, applications) is covered in our explainer on carbon nanotubes.
- Graphene's high numbers were measured on exfoliated or suspended single-crystal pieces. Strength 130 GPa, thermal conductivity about 5,000 W/m·K, mobility above 200,000 cm²/V·s Sourced
- Each route delivers a different form. Oxidation and reduction gave C/O = 10.3 and 466 m²/g (about 18% of the theoretical value) Sourced Our calculation
- Raman ID/IG changes with excitation wavelength and flake edges. Do not settle quality from one number Sourced
- On a specification, check the distributions of layer number and lateral size, and C/O. A survey of 60 producers reported that many made graphite microplatelets Sourced
- Applications are at different stages. Batteries, composites and inks are at laboratory to prototype level; the thermal-management product is a graphite sheet Sourced
- Transfer is the practical bottleneck for CVD films. Residue, damage and cracks Sourced
11. Glossary
- Graphene
- A one-atom-thick sheet of carbon atoms in a hexagonal lattice. The name is shared, but layer count, defects and oxygen content differ by sample.
- Few-layer graphene
- Two to a few layers stacked. Layer count changes the electronic structure and the Raman line shape.
- Turbostratic stacking
- Layers stacked with random relative orientation. The electronic coupling between layers differs from AB-stacked graphite.
- CVD
- Chemical vapour deposition. A film is grown from a carbon-containing gas on a substrate such as copper foil.
- Liquid-phase exfoliation
- Peeling graphite apart in a solvent to give a dispersion of flakes. Thickness and size are mixed.
- Graphene oxide / reduced graphene oxide
- Oxidised graphite with widened layer spacing, and the product of reducing it. Oxygen remains and the sheets tend to restack.
- C/O ratio
- The atomic ratio of carbon to oxygen. It expresses how far oxidation or reduction has gone.
- Raman spectroscopy
- A measurement that probes lattice vibrations with a laser. The D, G and 2D bands are read for defects and layer count.
- ID/IG
- The intensity ratio of the D band to the G band. A guide to defects, but it changes with excitation wavelength and flake edges.
- BET specific surface area
- Specific surface area from nitrogen adsorption. For agglomerated powders it falls well below the theoretical value.
- Mobility
- How readily charge moves under an electric field, in cm²/V·s. It varies greatly with substrate and temperature.
- Nanoindentation
- Pressing on a film with an AFM tip or similar and deriving modulus and breaking strength from force and displacement.
- Transfer
- Moving the graphene film from its growth substrate (copper foil) to the substrate where it will be used.
- PMMA
- Poly(methyl methacrylate). A polymer used as the support film in transfer; it can remain as residue.
- Pyrolytic graphite sheet (PGS)
- An artificial graphite sheet made by pyrolysing a polymer or similar. It is graphite, not graphene.
12. Primary sources
- Novoselov KS et al. "Electric Field Effect in Atomically Thin Carbon Films", Science 2004;306:666–669 — doi.org/10.1126/science.1102896
- Kauling AP et al. "The Worldwide Graphene Flake Production", Adv Mater 2018;30:1803784 — doi.org/10.1002/adma.201803784
- Lee C, Wei X, Kysar JW, Hone J "Measurement of the Elastic Properties and Intrinsic Strength of Monolayer Graphene", Science 2008;321:385–388 — doi.org/10.1126/science.1157996
- Balandin AA et al. "Superior Thermal Conductivity of Single-Layer Graphene", Nano Lett 2008;8:902–907 — doi.org/10.1021/nl0731872
- Bolotin KI et al. "Ultrahigh electron mobility in suspended graphene", Solid State Commun 2008;146:351–355 — doi.org/10.1016/j.ssc.2008.02.024
- Dean CR et al. "Boron nitride substrates for high-quality graphene electronics", Nat Nanotechnol 2010;5:722–726 — doi.org/10.1038/nnano.2010.172
- Li X et al. "Large-Area Synthesis of High-Quality and Uniform Graphene Films on Copper Foils", Science 2009;324:1312–1314 — doi.org/10.1126/science.1171245
- Xu X et al. "Ultrafast epitaxial growth of metre-sized single-crystal graphene on industrial Cu foil", Sci Bull 2017;62:1074–1080 — doi.org/10.1016/j.scib.2017.07.005
- Backes C et al. "Production and processing of graphene and related materials", 2D Mater 2020;7:022001 — doi.org/10.1088/2053-1583/ab1e0a
- Novoselov KS et al. "Two-dimensional atomic crystals", Proc Natl Acad Sci USA 2005;102:10451–10453 — doi.org/10.1073/pnas.0502848102
- Hernandez Y et al. "High-yield production of graphene by liquid-phase exfoliation of graphite", Nat Nanotechnol 2008;3:563–568 — doi.org/10.1038/nnano.2008.215
- Stankovich S et al. "Synthesis of graphene-based nanosheets via chemical reduction of exfoliated graphite oxide", Carbon 2007;45:1558–1565 — doi.org/10.1016/j.carbon.2007.02.034
- Hummers WS Jr, Offeman RE "Preparation of Graphitic Oxide", J Am Chem Soc 1958;80:1339 (title only cited) — doi.org/10.1021/ja01539a017
- Luong DX et al. "Gram-scale bottom-up flash graphene synthesis", Nature 2020;577:647–651 — doi.org/10.1038/s41586-020-1938-0
- HydroGraph Clean Power Company website (technology and certification pages); only the production-method description is cited — hydrograph.com
- Ferrari AC, Basko DM "Raman spectroscopy as a versatile tool for studying the properties of graphene", Nat Nanotechnol 2013;8:235–246 — doi.org/10.1038/nnano.2013.46
- Ferrari AC et al. "Raman Spectrum of Graphene and Graphene Layers", Phys Rev Lett 2006;97:187401 — doi.org/10.1103/PhysRevLett.97.187401
- Cançado LG et al. "Quantifying Defects in Graphene via Raman Spectroscopy at Different Excitation Energies", Nano Lett 2011;11:3190–3196 — doi.org/10.1021/nl201432g
- Eckmann A et al. "Probing the Nature of Defects in Graphene by Raman Spectroscopy", Nano Lett 2012;12:3925–3930 — doi.org/10.1021/nl300901a
- Wick P et al. "Classification Framework for Graphene-Based Materials", Angew Chem Int Ed 2014;53:7714–7718 — doi.org/10.1002/anie.201403335
- ISO ISO/TS 80004-13:2024 "Nanotechnologies — Vocabulary — Part 13: Graphene and other two-dimensional (2D) materials" — iso.org
- ISO ISO/TS 21356-1:2021 "Nanotechnologies — Structural characterization of graphene — Part 1: Graphene from powders and dispersions" — iso.org
- Su F-Y et al. "Flexible and planar graphene conductive additives for lithium-ion batteries", J Mater Chem 2010;20:9644–9650 — doi.org/10.1039/c0jm01633k
- Son IH et al. "Graphene balls for lithium rechargeable batteries with fast charging and high volumetric energy densities", Nat Commun 2017;8:1561 — doi.org/10.1038/s41467-017-01823-7
- Kinloch IA et al. "Composites with carbon nanotubes and graphene: An outlook", Science 2018;362:547–553 — doi.org/10.1126/science.aat7439
- Potts JR et al. "Graphene-based polymer nanocomposites", Polymer 2011;52:5–25 — doi.org/10.1016/j.polymer.2010.11.042
- Torrisi F et al. "Inkjet-Printed Graphene Electronics", ACS Nano 2012;6:2992–3006 — doi.org/10.1021/nn2044609
- Secor EB et al. "Inkjet Printing of High Conductivity, Flexible Graphene Patterns", J Phys Chem Lett 2013;4:1347–1351 — doi.org/10.1021/jz400644c
- Peng L et al. "Ultrahigh Thermal Conductive yet Superflexible Graphene Films", Adv Mater 2017;29:1700589 — doi.org/10.1002/adma.201700589
- Xin G et al. "Large-Area Freestanding Graphene Paper for Superior Thermal Management", Adv Mater 2014;26:4521–4526 — doi.org/10.1002/adma.201400951
- Panasonic Industrial Devices "Pyrolytic Graphite Sheet (PGS)" product page (English); manufacturer's stated values — na.industrial.panasonic.com
- Suk JW et al. "Transfer of CVD-Grown Monolayer Graphene onto Arbitrary Substrates", ACS Nano 2011;5:6916–6924 — doi.org/10.1021/nn201207c
- Pirkle A et al. "The effect of chemical residues on the physical and electrical properties of chemical vapor deposited graphene transferred to SiO₂", Appl Phys Lett 2011;99:122108 (title only cited) — doi.org/10.1063/1.3643444
- Bae S et al. "Roll-to-roll production of 30-inch graphene films for transparent electrodes", Nat Nanotechnol 2010;5:574–578 — doi.org/10.1038/nnano.2010.132
- Neumaier D, Pindl S, Lemme MC "Integrating graphene into semiconductor fabrication lines", Nat Mater 2019;18:525–529 (summary only confirmed) — doi.org/10.1038/s41563-019-0359-7
- Fadeel B et al. "Safety Assessment of Graphene-Based Materials: Focus on Human Health and the Environment", ACS Nano 2018;12:10582–10620 — doi.org/10.1021/acsnano.8b04758
13. Claim-to-source audit
| Claim in the text | Basis | Label |
|---|---|---|
| First report (2004): films a few atomic layers thick, room-temperature mobility about 10,000 cm²/V·s, carrier concentrations up to 10¹³ cm-2 induced by field | Novoselov et al. 2004 (Science)[Ref. 1] https://doi.org/10.1126/science.1102896 | Sourced |
| Nanoindentation of a free-standing monolayer: second-order elastic stiffness 340 N/m, breaking strength 42 N/m, converted to bulk graphite E = 1.0 TPa and intrinsic strength 130 GPa | Lee et al. 2008 (Science)[Ref. 3] https://doi.org/10.1126/science.1157996 | Sourced |
| Room-temperature thermal conductivity of suspended monolayer graphene of about 4.84 × 10³ to 5.30 × 10³ W/m·K (optothermal method, Raman G peak) | Balandin et al. 2008 (Nano Lett)[Ref. 4] https://doi.org/10.1021/nl0731872 | Sourced |
| Mobility above 200,000 cm²/V·s at an electron density of about 2 × 10¹¹ cm-2 for a monolayer suspended about 150 nm above a Si/SiO₂ gate (current-heating cleaning) | Bolotin et al. 2008 (Solid State Commun)[Ref. 5] https://doi.org/10.1016/j.ssc.2008.02.024 | Sourced |
| Devices on h-BN substrates have mobility and carrier homogeneity "almost an order of magnitude" better than on SiO₂ | Dean et al. 2010 (Nat Nanotechnol)[Ref. 6] https://doi.org/10.1038/nnano.2010.172 | Sourced |
| CVD films on copper foil at centimetre scale, predominantly single-layer (few-layer under 5%), mobility up to 4050 cm²/V·s | Li et al. 2009 (Science)[Ref. 7] https://doi.org/10.1126/science.1171245 | Sourced |
| A (5 × 50) cm² film grown in 20 minutes, mobility about 23,000 cm²/V·s (4 K), room-temperature sheet resistance about 230 Ω/sq | Xu et al. 2017 (Sci Bull)[Ref. 8] https://doi.org/10.1016/j.scib.2017.07.005 | Sourced |
| Mechanical exfoliation produced two-dimensional crystals of boron nitride, graphite, dichalcogenides and complex oxides, stable in air | Novoselov et al. 2005 (PNAS)[Ref. 10] https://doi.org/10.1073/pnas.0502848102 | Sourced |
| Liquid-phase exfoliation: concentration up to about 0.01 mg/mL, monolayer yield about 1 wt% (possibly 7 to 12 wt%); heterogeneous dispersions are a critical bottleneck and centrifugation is used for sorting | Hernandez et al. 2008 (Nat Nanotechnol)[Ref. 11] https://doi.org/10.1038/nnano.2008.215; Backes et al. 2020 (2D Mater)[Ref. 9] https://doi.org/10.1088/2053-1583/ab1e0a | Sourced |
| Reduced graphene oxide: BET 466 m²/g, C/O 10.3 (2.7 before), compressed-powder conductivity about 2 × 10² S/m (30% relative humidity), theoretical surface area 2,620 m²/g, aggregation lowering the area | Stankovich et al. 2007 (Carbon)[Ref. 12] https://doi.org/10.1016/j.carbon.2007.02.034 | Sourced |
| Title of the classic graphite oxide preparation (Hummers method) | Hummers and Offeman 1958 (JACS)[Ref. 13] https://doi.org/10.1021/ja01539a017 | Sourced |
| Flash Joule heating: gram-scale graphene in under one second, turbostratic stacking, 80 to 90% yield and above 99% purity (carbon black etc.), weak or absent D band; remark on the defective structure left by oxidation and reduction | Luong et al. 2020 (Nature)[Ref. 14] https://doi.org/10.1038/s41586-020-1938-0 | Sourced |
| HydroGraph describes "detonation synthesis" of graphene on its own website; the page gives no carbon-purity figure | HydroGraph website[Ref. 15] https://hydrograph.com/ | Sourced |
| CVD on Ni gives graphitised polycrystalline films and single layers are hard to get over large areas; the need for transfer; damage and residue from etch transfer; electrochemical delamination and dry transfer as alternatives | Backes et al. 2020 (2D Mater)[Ref. 9] https://doi.org/10.1088/2053-1583/ab1e0a | Sourced |
| Raman can determine layer number and orientation, edge quality and type, and the effects of fields, strain, doping, disorder and functional groups | Ferrari and Basko 2013 (Nat Nanotechnol)[Ref. 16] https://doi.org/10.1038/nnano.2013.46 | Sourced |
| The 2D band changes in shape, width and position with layer number, and the G band shifts slightly down | Ferrari et al. 2006 (PRL)[Ref. 17] https://doi.org/10.1103/PhysRevLett.97.187401 | Sourced |
| ID/IG depends strongly on excitation energy and peaks at an inter-defect distance of about 3 nm; the G-peak width resolves the ambiguity | Cançado et al. 2011 (Nano Lett)[Ref. 18] https://doi.org/10.1021/nl201432g | Sourced |
| D to D′ ratio: about 13 for sp³ defects, about 7 for vacancy-like defects, about 3.5 for graphite boundaries | Eckmann et al. 2012 (Nano Lett)[Ref. 19] https://doi.org/10.1021/nl300901a | Sourced |
| GRAPHENE Flagship defined number of layers, lateral dimension and C/O ratio as the three descriptors for classification | Wick et al. 2014 (Angew Chem)[Ref. 20] https://doi.org/10.1002/anie.201403335 | Sourced |
| Survey of samples from 60 producers: overall quality rather poor, many were graphite microplatelets, classification by distributions of layer number and flake size needed, several methods combined | Kauling et al. 2018 (Adv Mater)[Ref. 2] https://doi.org/10.1002/adma.201803784 | Sourced |
| ISO/TS 80004-13:2024 specifies the vocabulary for graphene and other two-dimensional materials | ISO standard page (80004-13)[Ref. 21] https://www.iso.org/standard/82855.html | Sourced |
| ISO/TS 21356-1:2021 specifies layer number and thickness, lateral flake size, degree of disorder, layer orientation and specific surface area with methods, sample preparation and data analysis (standard text not seen) | ISO standard page (21356-1)[Ref. 22] https://www.iso.org/standard/70757.html | Sourced |
| Graphene conductive additive in LiFePO₄ cathodes (plane-to-point); better performance at a lower fraction than commercial carbon-based additives and than carbon nanotubes | Su et al. 2010 (J Mater Chem)[Ref. 23] https://doi.org/10.1039/c0jm01633k | Sourced |
| Graphene ball: 1 wt% coating on a Ni-rich cathode; volumetric energy density +27.6% against the control; 78.6% retention after 500 cycles at 5C and 60 °C; possibility of 800 Wh/L | Son et al. 2017 (Nat Commun)[Ref. 24] https://doi.org/10.1038/s41467-017-01823-7 | Sourced |
| Issues for carbon-nanotube and graphene composites (load transfer, interface, dispersion, viscosity) and the lack of selection rules | Kinloch et al. 2018 (Science)[Ref. 25] https://doi.org/10.1126/science.aat7439 | Sourced |
| Properties of graphene-based polymer nanocomposites depend on graphene's intrinsic properties and its dispersion state in the matrix | Potts et al. 2011 (Polymer)[Ref. 26] https://doi.org/10.1016/j.polymer.2010.11.042 | Sourced |
| Inkjet printing: transistor mobility up to about 95 cm²/V·s; about 80% transmittance and about 30 kΩ/sq | Torrisi et al. 2012 (ACS Nano)[Ref. 27] https://doi.org/10.1021/nn2044609 | Sourced |
| Ethanol and ethyl cellulose ink: 4 mΩ·cm after annealing at 250 °C for 30 min | Secor et al. 2013 (J Phys Chem Lett)[Ref. 28] https://doi.org/10.1021/jz400644c | Sourced |
| Microfolded graphene film: 1940 ± 113 W/m·K, 16% fracture elongation, more than 6000 folding cycles | Peng et al. 2017 (Adv Mater)[Ref. 29] https://doi.org/10.1002/adma.201700589 | Sourced |
| Graphene paper: 1238.3 to 1434 W/m·K (electrospray deposition, roll to roll, compaction and annealing) | Xin et al. 2014 (Adv Mater)[Ref. 30] https://doi.org/10.1002/adma.201400951 | Sourced |
| Panasonic PGS conductivities (10 µm: 1950; 17: 1850; 25: 1600; 40: 1350; 50: 1300; 70: 1000; 100: 700 W/m·K); insulated types carry 30 µm PET and 18 µm adhesive; heat resistance 150 °C / 400 °C (PGS only); no direction or method stated | Manufacturer's stated values. Panasonic PGS product page[Ref. 31] https://na.industrial.panasonic.com/products/thermal-management/thermal-management/lineup/thermal-management-products/series/70458 | Sourced |
| Dry and wet transfer with a PMMA support film; 98% coverage of perforated-substrate holes; about 980 Ω/sq and 97.6% on glass | Suk et al. 2011 (ACS Nano)[Ref. 32] https://doi.org/10.1021/nn201207c | Sourced |
| Chemical residue after transfer affects the physical and electrical properties of CVD graphene (by title) | Pirkle et al. 2011 (Appl Phys Lett)[Ref. 33] https://doi.org/10.1063/1.3643444 | Sourced |
| Roll-to-roll 30-inch films, about 125 Ω/sq and 97.4% transmittance | Bae et al. 2010 (Nat Nanotechnol)[Ref. 34] https://doi.org/10.1038/nnano.2010.132 | Sourced |
| Integrating graphene into established semiconductor fabrication lines is a critical step towards commercialisation (summary only) | Neumaier et al. 2019 (Nat Mater)[Ref. 35] https://doi.org/10.1038/s41563-019-0359-7 | Sourced |
| Not all graphene-based materials are alike; structure-activity relationships must be disentangled | Fadeel et al. 2018 (ACS Nano)[Ref. 36] https://doi.org/10.1021/acsnano.8b04758 | Sourced |
| Conversion from N/m to GPa (0.335 nm assumed), theoretical surface area from geometry (0.142 nm bond), 466/2,620 = about 18%, oxygen fractions of 27% and 8.8%, conductivity × thickness, Xu et al.'s (5 × 50) cm² = 250 cm² (12.5 cm²/min, about 0.35 of a 300 mm wafer) | Our calculation. The bond length, interlayer spacing, wafer diameter and in-plane direction are our assumptions. Growth time excludes heating, cooling and transfer. | Our calculation |
| Standard adoption of graphene as a conductive additive in commercial cells; guaranteed values in production composites; powder price; direct-synthesis production status; the measurement direction for PGS | No primary source could be confirmed within the scope of this article, so none is stated (Commentary). | Not yet confirmed |
| Arranging the checks into specification items, reading Raman indicators (edge contribution, turbostratic stacking), single layer versus macroscopic sheet conductivity, reading numbers by sample state, the five-way grouping of routes | This article's own organisation and commentary based on the published material; not views stated by the authors or institutions. | Commentary |
| Figs. 1, 2, 4, 6 and 8 are explanatory drawings; Figs. 3 and 7 are drawn with our calculation; the hero image and Fig. 5 are AI-generated | Our note. | Commentary |
Last updated 9 October 2026. Sources are limited to primary material (peer-reviewed papers, ISO standard pages and manufacturers' product pages). Because the article includes materials-design interpretations, those are marked as Commentary and kept separate from sourced fact. Standard adoption in battery cells, guaranteed values in production composites, powder prices, the production status of direct synthesis and the measurement direction for Panasonic PGS conductivity are not stated because no primary source could be confirmed. The values in the tables of Chapters 2 and 7 differ in sample, method and direction and are not a ranking. All figures are explanatory concept graphics. Figs. 1 to 4 and 6 to 8 are vector drawings (Figs. 3 and 7 include our calculation); the hero image and Fig. 5 are AI-generated images, and none of them shows a real micrograph, spectrum or physical product.