TECHNOLOGY EXPLAINER
Nanometrology
— “How Many Nanometres?” Has No Single Answer
Measure the same powder, and an electron microscope returns an equivalent circular diameter counted from an image, dynamic light scattering (DLS) returns the diameter of a sphere that moves with its solvent shell, and atomic force microscopy (AFM) returns a height above the substrate. OECD Test Guideline (TG) 125 states plainly that the quantity measured differs by method, and that sizes tend to come out larger in the order number basis < surface-area basis < volume basis. Because the EU definition of “nano” asks for “50% or more by number”, which quantity was measured, and by which method, decides the conclusion.
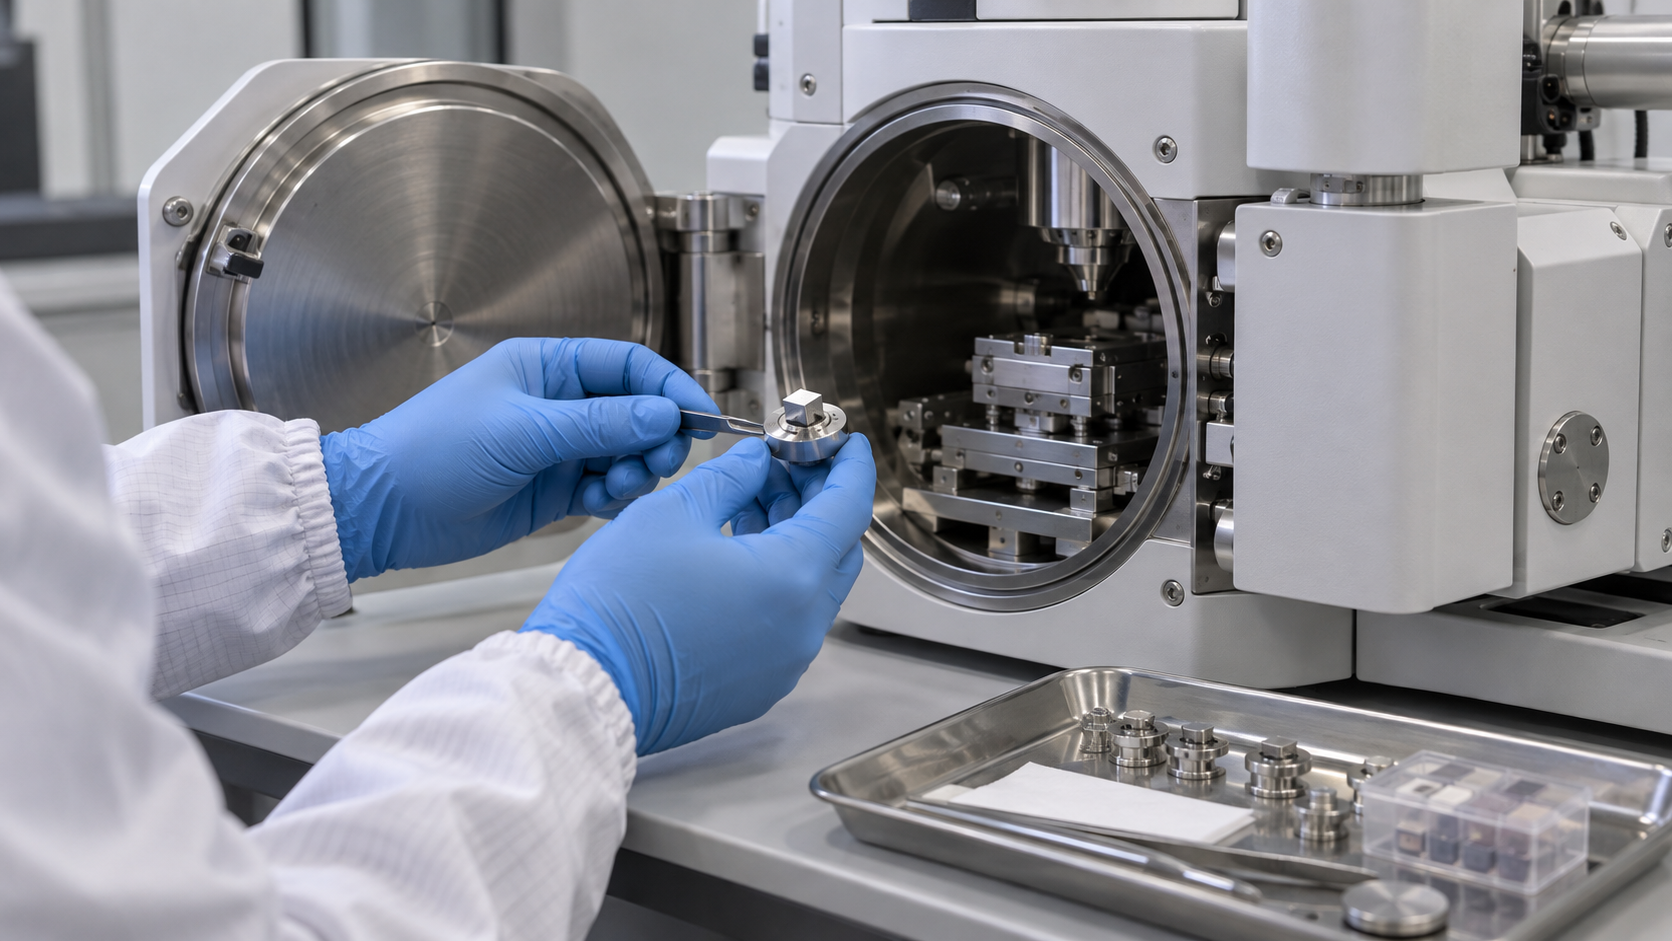
- What nanometrology is (the short version)
- What is being measured — the meaning of “diameter” differs by method
- Applicable range by method, and tendencies to read high or low
- Electron microscopy (SEM, TEM) — counting particles one by one
- Scanning probe microscopy (AFM, STM) — measuring height
- Light scattering, sedimentation, mobility and small-angle X-ray scattering — measuring dispersions and aerosols
- BET, X-ray diffraction, Raman and XPS — looking at surface, crystal and composition
- Our calculation: seen by number, surface area, volume and scattering intensity
- Our calculation: sphere-equivalent diameter from BET surface area
- A materials engineer’s view (1): the measurement method is part of the specification
- Reference materials and calibration — NIST gold nanoparticles and OECD TG 125
- Quality control in volume production — the TG 125 recommendations laid out as a process
- A materials engineer’s view (2): regulatory definitions and the cost of measurement
- What is still open, and what we could not confirm
- Glossary / Primary sources / Claim-to-source audit
Sourced = content stated in published material (link given)
Our calculation = a figure this article derived, with the assumptions spelled out
Not yet confirmed = a plan or outlook with no confirmed record
Readings and interpretations are marked separately as Commentary.
1. What nanometrology is (the short version)
- The quantity differs: OECD TG 125 states that particle size is reported as an equivalent spherical diameter that depends on the measurement principle (an equivalent circular diameter for microscopy), and that the measured equivalent diameter is also influenced by sample preparation, data analysis, distribution weighting and the type of averagingSourced.
- The direction of bias differs by method: the same TG’s table says electron microscopy, AFM and SAXS tend to underestimate diameters, while DLS, PTA and DMAS tend to overestimate themSourced.
- Attach conditions to the value: particle size of a production material, or the judgement of whether something is “nano” under regulation, cannot be compared unless it comes with which quantity, which method and which preparation (Commentary).
OECD TG 125 says that mathematical transformation of one size distribution into another is possible only under very specific conditions (for example, ideal spherical and monodisperse particles); in most other cases it rests on assumptions with unknown uncertainties, and so is generally not recommended Sourced. So you cannot say “DLS gave 80 nm, so electron microscopy will also give 80 nm” (Commentary).
2. What is being measured — the meaning of “diameter” differs by method
TG 125 distinguishes the type of distribution with a subscript: 0 for number, 1 for length, 2 for area, 3 for volume (mass) and i for intensity. For example, the number-based hydrodynamic diameter from PTA is written d0,hydSourced. Even for one particle, where each method takes the “edge” of the particle is different.
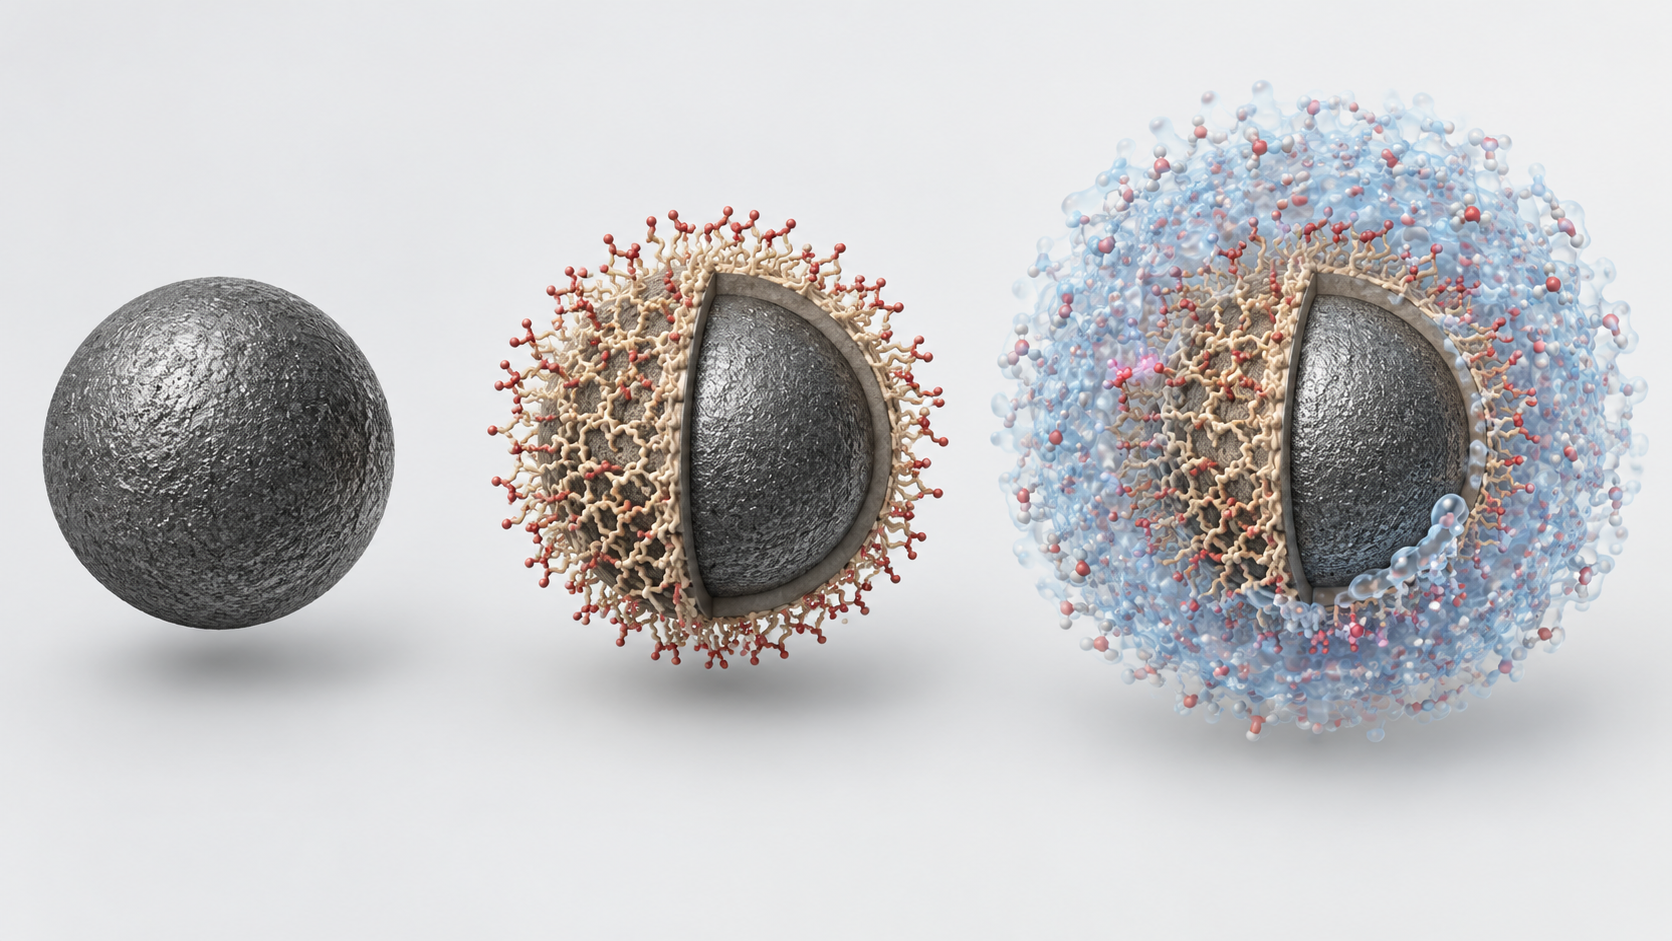
Shapes, colors and dimensions are illustrative. Consult the original schematic below for exact values and label correspondence.
View the original SVG schematic and exact annotations
Reading guide and original schematic labels: One particle, several “diameters”, one per method (conceptual) / core / Electron microscopy (SEM, TEM) / Diameter of a circle with the same area / as the image (equivalent circular diameter) / SAXS (small-angle X-ray scattering) / Diameter converted from scattered intensity / (volume-square equivalent, intensity basis) / DLS, PTA / Hydrodynamic diameter, including the / solvation layer and adsorbed molecules / AFM (atomic force microscopy) / Height above the substrate / (lateral size depends on tip shape) / DMAS, sp-ICP-MS / Electrical-mobility diameter / diameter / converted from the mass of metal / core / coating / hydration layer (dotted) / * Explanatory schematic. Methods differ in where they take the “edge” of a particle, so one particle gives different values. / * Layer thicknesses and ratios are not to scale. Quantity names follow Table 1 of OECD TG 125.
| Method | Quantity measured (type of diameter) | Basis of distribution | State of sample | Tendency to read high or low |
|---|---|---|---|---|
| Electron microscopy (SEM, TEM) | Equivalent circular diameter (diameter of a circle with the same area as the image) | Number | Dry, deposited particles in vacuum | Low (shrinkage in vacuum; contrast with coatings) |
| AFM | Height-based equivalent circular diameter | Number | Particles deposited on a substrate | Low (particles compressed by the imaging force) |
| DLS | Hydrodynamic diameter | Scattering intensity | Dispersion | High (large particles’ scattering masks small ones) |
| PTA | Hydrodynamic diameter | Number | Dispersion | High |
| DMAS | Electrical-mobility diameter | Number | Aerosol | High (generating an aerosol from a liquid) |
| Centrifugal sedimentation (CLS / AUC) | Stokes diameter | Volume etc. (depends on detector) | Dispersion | The TG’s table lists neither high nor low |
| SAXS | Volume-square-equivalent diameter | Scattering intensity | Dispersion, powder | Low (when the coating scatters weakly) |
| sp-ICP-MS | Mass-equivalent diameter | Number | Dispersion | Low. But the interlaboratory comparison could not sufficiently validate it, so it sits in an appendix |
All Sourced (OECD TG 125 Tables 1 and 2, paragraph 37 and Appendix C; Source 1). The arrangement and condensing of the table are ours.
3. Applicable range by method, and tendencies to read high or low
For particles of 1 to 1,000 nm, TG 125 lists eight methods. No single method measures the whole 1 to 1,000 nm range with equal accuracy, and the TG says a combination of methods may be neededSourced.
Take the case where a method that tends to underestimate gives a value near 100 nm. TG 125 reasons that the true value is probably larger (for example 120 nm), so the material is probably not a nanomaterial, but this should be confirmed by a second, complementary method. Conversely, if a method that tends to overestimate (such as DLS) gives about 100 nm, the true value is probably smaller (for example 80 nm), so the material is probably a nanomaterialSourced. In both cases, confirmation is by a complementary method (paragraph 37).
4. Electron microscopy (SEM, TEM) — counting particles one by one
Electron microscopy is the leading method for obtaining a number-based size distribution directly from images. TG 125 explains that SEM scans a focused electron beam over the sample and detects secondary electrons (sensitive to surface morphology) or backscattered electrons (sensitive to differences in composition), while TEM detects electrons that pass through the sample to give a projected image of the particles. The lateral resolution of TEM is usually better than that of SEMSourced. ISO publishes ISO 21363:2020 for particle size and shape distributions by TEM and ISO 19749:2021 for SEMSourced.
- How many to count: TG 125 says 300 particles are sufficient for a narrow distribution (geometric standard deviation σg ≤ 1.5), and at least 700 for a wide one (σg > 1.5). The ISO 19749 summary likewise gives a rule of thumb that several hundreds or thousands of particles need to be measured for a statistically sound distributionSourced.
- Resolution: TG Table 4 indicates that for particles of 14 to 21 nm in diameter a resolution of 1.5 to 2.0 nm per pixel is needed, and that one pixel of error is a 10 to 11% uncertainty in diameter. For 63 to 100 nm, 5 to 6 nm per pixel is needed and the uncertainty is 5 to 6%Sourced.
- The sample must be stable: particles must be stable under vacuum and the electron beam, and there must be enough contrast to separate particle outlines from the background. Shrinkage in vacuum, or poor contrast with a coating, can make diameters read small.
- Conductive coating: non-conducting samples charge, so first reduce the beam intensity, then improve conductivity between sample and substrate, and only then apply a thin conductive coating. But the coating thickness makes particles look larger, so the thickness must be reported and subtracted from the resultSourced.
- Particles inside agglomerates: a particle in an agglomerate or aggregate is counted only if its physical boundaries are fully visible. Before quantitative evaluation, the quality of preparation (are particles separated, are impurities and artefacts few) is checked visually in the images.
- Fibres only by electron microscopy: for measuring the diameter and length of fibres, TG 125 says the only method currently available is image analysis of electron micrographs (paragraph 5).
5. Scanning probe microscopy (AFM, STM) — measuring height
AFM scans a sharp tip over a surface and builds an image from height differences. In TG 125 the particle diameter is taken from the height, giving a number-based distribution d0,hgtSourced. The particles are immobilised on a surface and can be measured on a dry surface or in liquid (TG 125).
- Lateral data are not reliable: lateral data are a convolution of the sample and tip geometry and depend strongly on tip quality. The TG does not recommend using lateral data to determine particle size (paragraph 48). The tip apex radius should be below 10 nm.
- Substrate roughness mixes into the diameter: the roughness of the particles and the substrate beneath is measured together, so the substrate must be flat; roughness below 5% of the particle size is recommended. Polished silicon wafer or mica are given as examples.
- Non-spherical particles depend on orientation: only the height is determined accurately, and the value varies with how the particle lies. AFM can also compress particles and so underestimate.
- Mixtures are hard: AFM measures size regardless of a particle’s chemical identity, so separating the size distributions of each type of particle in a mixture is difficult.
STM (scanning tunnelling microscopy) observes the atomic arrangement of a conductive surface through the tunnelling current between tip and surface; here it is mentioned only as background (Commentary). Within the scope of our research, we could not confirm any ISO standard or OECD test guideline that lists STM as a method for particle size distribution.
6. Light scattering, sedimentation, mobility and small-angle X-ray scattering — measuring dispersions and aerosols
(1) Dynamic light scattering (DLS)
DLS shines laser light on a dilute dispersion, derives the particles’ diffusion coefficient from fluctuations in scattered-light intensity, and calculates a hydrodynamic diameter with the Stokes-Einstein equation. The result is an intensity-weighted diameter di,hydSourced.
- Large particles mask small ones: scattered intensity scales with the sixth power of the radius (outside the Mie-scattering region), so the signal of large particles overlays that of small ones and can hide the small particles or make them look fewer.
- It includes the hydration layer and adsorbates: the diameter includes the particle’s electrical double layer and attached molecules (dispersants, proteins). The double layer changes with dispersing conditions (pH, ionic strength), so hydrodynamic diameters are comparable only under the same dispersing conditions.
- Mind the concentration: too high a concentration gives multiple scattering, a faster decay of the correlation function, and smaller apparent diameters and larger polydispersity. The TG advises checking at two concentrations differing by a factor of two to exclude a systematic concentration dependency.
- Transformation is not recommended: converting an intensity-based result into a number or volume basis greatly multiplies the uncertainty and is not recommended. If done, the whole procedure is reported.
- Instrument checks: the optics are verified periodically with a high-purity solvent, and performance with a reference material certified for size by DLS.
The DLS standard is ISO 22412. OECD TG 125 cites the 2017 edition, and the ISO catalogue also lists a 2025 edition (ISO 22412:2025)Sourced.
(2) PTA, centrifugal sedimentation, DMAS and SAXS
- PTA (particle tracking analysis): follows the diffusion of individual particles to obtain a number-based hydrodynamic diameter. It covers 10 to 1,000 nm and, like DLS, tends to read high.
- Centrifugal liquid sedimentation (CLS) and analytical ultracentrifugation (AUC): derive a Stokes diameter from the sedimentation speed. They have good resolution of the distribution and may work for mixtures in some cases.
- DMAS (differential mobility analysis system): derives a diameter from the electrical mobility of particles made into an aerosol. It gives the outer diameter including a dry coating layer directly. Generating the aerosol from a liquid can make it read high.
- SAXS (small-angle X-ray scattering): derives a volume-square-equivalent diameter from the angular dependence of scattered intensity. If the coating scatters weakly, the coating is not included and the diameter reads low.
For these methods, Appendix B of TG 125 lists ISO 13318-1, -2 and -3 for centrifugal sedimentation, ISO 15900 and ISO/TS 12025 for DMAS, ISO 17867 for SAXS, and ISO 19430 for PTA, among others (numbers as given in the TG)Sourced. For sp-ICP-MS, ISO/TS 19590:2017 (size distribution and concentration of inorganic nanoparticles in aqueous media) has been published. TG 125, however, found the results of sp-ICP-MS depended strongly on the instrument and says it could not be sufficiently validatedSourced.
7. BET, X-ray diffraction, Raman and XPS — looking at surface, crystal and composition
Beyond particle size itself, evaluating surface, crystal and composition is also an important part of what determines a nanomaterial’s properties. The following are the main points we could confirm in primary sources.
- BET method (gas adsorption): ISO 9277:2022 is the standard for determining the overall specific surface area of disperse (including nano-powders) or porous solids from the amount of physically adsorbed gas by the BET method. It applies only to type II (non-porous or macroporous) and type IV (mesoporous, pore diameter 2 to 50 nm) isotherms; inaccessible pores are not detected, and it cannot be reliably applied to solids that absorb the measuring gasSourced (ISO 9277 catalogue entry). OECD TG 124 obtains a powder’s volume-specific surface area (VSSA) from the BET mass-specific surface area and the skeletal density from gas pycnometry.
- X-ray diffraction (XRD): the Scherrer formula estimates crystallite size from the width of a diffraction peak; Patterson’s 1939 paper (“The Scherrer Formula for X-Ray Particle Size Determination”) is well known. But what it gives is crystallite size, which is not the same as particle size. If one particle consists of several crystallites, the crystallite size is smaller (Commentary).
- Raman spectroscopy: the review by Ferrari and Basko says Raman spectroscopy of graphene is used to determine the number and orientation of layers, the quality and types of edge, and the effects of electric and magnetic fields, strain, doping, disorder and functional groupsSourced. For carbon materials, the intensity ratio of the defect-sensitive D band to the G band is used as a quality indicator (Commentary; specific values are left to the individual explainers on graphene and carbon nanotubes).
- XPS (X-ray photoelectron spectroscopy): examines the elemental composition and chemical state of the top few nanometres of a surface. Shard’s paper deals, by its title, with a straightforward method for interpreting XPS data from core-shell nanoparticles (cited by title only). That it can be used to estimate coating thickness is our reading of the title (Commentary).
- EDX (energy-dispersive X-ray analysis): a composition analysis attached to an electron microscope; TG 125 says it can be used alongside to identify mixed samples of particles of different substances.
8. Our calculation: seen by number, surface area, volume and scattering intensity
An extreme example shows how much the conclusion can change with the way of measuringOur calculation. Assumption: a powder consists of only two kinds of spheres, 20 nm in diameter (99% by number) and 200 nm in diameter (1% by number), with the same density.
- Number basis: 20 nm particles make up 99.0%.
- Surface-area basis (proportional to d²): 200 nm is 10 times 20 nm, so area is 100 times. 20 nm side = 0.99; 200 nm side = 0.01 × 100 = 1. The 20 nm share is 0.99 ÷ 1.99 = 49.7%.
- Volume (mass) basis (proportional to d³): volume is 1,000 times. 20 nm side = 0.99; 200 nm side = 0.01 × 1,000 = 10. The 20 nm share is 0.99 ÷ 10.99 = 9.0%.
- Scattering-intensity basis (proportional to d6, an approximation for particles much smaller than the wavelength): intensity is 106 times. 20 nm side = 0.99; 200 nm side = 0.01 × 106 = 10,000. The 20 nm share is 0.99 ÷ 10,000.99 = 0.01%.
Assumptions and limits: TG 125 itself notes that the sixth-power scaling of DLS scattered intensity holds when not in the Mie-scattering region. A 200 nm particle is close to the wavelength of visible light and the approximation does not hold, so the 0.01% above is an estimate at the extreme end. Even so, the direction of the bias, that particles making up 99% by number almost vanish from a DLS intensity distribution, agrees with the TG’s statement that large particles mask small ones.
9. Our calculation: sphere-equivalent diameter from BET surface area
From the BET mass-specific surface area (SSA) one can calculate the diameter the particles would have if they were smooth, monodisperse spheresOur calculation.
- Formula: surface area per mass of a sphere = 6/(ρ × d), hence d = 6/(ρ × SSA), where ρ is density.
- TiO2 (density assumed 4.0 g/cm³): for SSA = 50 m²/g, d = 6/(4.0 × 106 g/m³ × 50 m²/g) = 30 nm. For SSA = 10 m²/g, 150 nm. For SSA = 1.5 m²/g, 1 µm.
- Au (density 19.3 g/cm³): NIST reference material RM 8012 is given as 27.6 nm by TEM [Source 10]. For a smooth sphere of that size, SSA = 6/(19.3 × 106 × 27.6 × 10−9) = about 11.3 m²/g.
- Relation to the EU exclusion criterion: the SSA corresponding to a volume-specific surface area of 6 m²/cm³ is 1.5 m²/g for TiO2 (4.0 g/cm³) and about 0.31 m²/g for Au (19.3 g/cm³). Even for the same volume-specific surface area, the mass-based value changes with density.
Assumptions and limits: real powders may be porous, may be agglomerates of fused primary particles, or may have rough surfaces. In that case the “sphere-equivalent diameter” fixed by the BET value does not agree with the size of the particles seen in a microscope. The EU recommendation likewise notes that a high surface area can come from internal nanostructure, and it removed the option of using surface area to qualify a material as nano (see this series’ explainer on nanomaterial definitions and regulation).
10. A materials engineer’s view (1): the measurement method is part of the specification
TG 125 says sample preparation decides the result for every method, and lists the following pointsSourced.
- Representativeness: the sample must be statistically representative of the size distribution and homogeneous, and fractionation by size must be avoided. Take subsamples at different ageing times and locations to check the temporal stability and spatial homogeneity of the preparation.
- Changes caused by preparation: breakage of particles by excessive energy input, loss of small particles by filters with too large a pore size, dissolution in the test medium, and insufficient disassembly of agglomerates (ISO 14887). Under- or over-grinding can be estimated by electron microscopy, and a limit of 5% of the number concentration is recommended (ISO 14887 is general guidance, not nano-specific).
- Stability of the dispersion: a dispersion must remain stable until measurement is finished, with no significant sedimentation, agglomeration or dissolution. For a distribution of individual particles, repeat measurements with the same method during sonication and check that a stable dispersion has been reached.
- Three routes: preparation can start from dry powder, dispersion or aerosol, and where possible all three should be tried to assess reproducibility and robustness.
- Items in the test report: composition and identifiers, surface modification, morphology, contaminants, amount of sample, preparation method (type of substrate, dispersion medium, filtering, concentration, dispersants, sonicator type, power and energy), time between preparation and measurement, instrument model, software version and settings.
Put in terms a materials engineer will recognise, particle size is a property not of the powder alone but of “powder + preparation conditions + measurement method”. An incoming-inspection or shipping-inspection specification therefore needs to state not just a particle-size value but the quantity measured (d0,ecd or di,hyd, for example), the basis of the distribution, and the preparation and instrument conditions (Commentary).
11. Reference materials and calibration — NIST gold nanoparticles and OECD TG 125
To confirm that measured values are right, you need reference materials with assigned values.
- NIST gold nanoparticles: in January 2008 NIST issued gold spheres of nominal 10, 30 and 60 nm as reference materials (RMs) for biomedical research (described as “the world’s first” in the wording of the source). The U.S. National Nanotechnology Initiative (NNI) document says that producing them required the development of six different methods of measuring nanoparticle sizeSourced.
- Values assigned by TEM: NIST SP 1200-21 gives the TEM diameters of RM 8011, 8012 and 8013 as 8.9 nm, 27.6 nm and 56 nm (RM 8013 is 56 nm ± 0.5 nm). The same document gives the TEM diameter of RM 8017, PVP-coated silver nanoparticles (nominal 75 nm), as 74.6 nmSourced.
- TG 125 recommendations: calibrate methods with reference materials certified for that method and measurand. Where there is no experience with a method or a material, the TG recommends testing at least once with one of the nanomaterials used in the interlaboratory comparison or a certified reference materialSourced. Appendix E of TG 125 lists the test materials used in the comparison.
In NIST SP 1200-21, which we could confirm, the values assigned to RM 8011 to 8013 are TEM diameters. The NNI document says six measurement methods were developed, so we infer that the certificate lists values from several methods, but we could not directly check the certificate itself (NIST’s certificate distribution page could not be retrieved). So we do not say flatly that “RM 8012 is 27.6 nm”; we write “given as 27.6 nm by TEM” (a note from us).
12. Quality control in volume production — the TG 125 recommendations laid out as a process
TG 125 is a test method for regulation, but its recommendations carry straight over to particle-size control of production lots (Commentary). Rearranged into a flow, they look like this.
(1) Decide the main method and the cross-check method in advance
Rather than settling everything with one method, combining methods whose biases run in opposite directions raises the reliability of the result. For example, measure with both electron microscopy, which tends to read low, and DLS, which tends to read high, and see whether the difference can be explained. TG 125 itself says that most real-life nanomaterials can be characterised by only a small number of methods and only a few by all of them, and strongly recommends paying attention to each method’s limitsSourced.
(2) Make the “width” of the distribution a control item
TG 125 distinguishes a distribution as narrow if the geometric standard deviation σg is 1.5 or less and wide above 1.5, and varies the number of particles counted by electron microscopy accordinglySourced. Even at the same mean diameter, a different σg changes the “number fraction at 100 nm or less” greatly (Commentary). A specification can therefore add a quantity showing the width of the distribution, such as σg, to the mean or median.
13. A materials engineer’s view (2): regulatory definitions and the cost of measurement
The EU recommendation asks whether 50% or more of the number-based size distribution lies at 1 to 100 nm. The “mean particle size” or “D50” usually watched in a plant is, in many cases, volume-based or DLS intensity-based, a different quantity from number basis (Commentary). Bridging the two needs the size distribution itself. In the example in Section 8, a powder that is 99% 20 nm by number looked like 9% by volume and 0.01% by scattering intensity.
The recommendation says that, to support implementation, the JRC (the Commission’s Joint Research Centre) is to develop guidance listing recommended measurement methods and best-practice tools (recital 8)Sourced. On the other hand, in its position paper on MWCNTs, NBCI says that TG 125 calls for extremely labor-intensive measurementsSourced (an industry body’s opinion). Measuring on a number basis calls for checks through three preparation routes, counting 300 to 700 or more particles, and confirmation by a complementary method (Sections 10 to 12). The cost of measurement is a real burden of regulatory compliance (Commentary).
This is where a comparatively simple way to judge the “not nano” side helps. According to recital 20 of the recommendation, the NanoDefine project reported that, across a large set of industrial materials, there were no inconsistencies in classifying non-nanomaterials between judgement by the median of the number-based size distribution and judgement by a volume-specific surface area below 6 m²/cm³Sourced. Volume-specific surface area can be obtained by BET and pycnometry (OECD TG 124). But for porous materials the surface area can be large without any small particles, so a high value does not make a material “nano”. It can serve to exclude, but it cannot prove that a material is nano (Commentary).
The regulatory side is covered in this series’ explainer on nanomaterial definitions and regulation.
14. What is still open, and what we could not confirm
- The method-by-method values in the certificates of the NIST gold nanoparticle reference materials (RM 8011 to 8013); the certificate distribution page could not be retrieved. We confirmed the values assigned by TEM in NIST SP 1200-21.
- Any ISO standard or OECD guideline listing STM as a method for particle size distribution.
- The text of ISO standards (paid). We confirmed titles and scopes, the standards body’s catalogue summaries, and the standard numbers in Appendix B of OECD TG 125. ISO 13318, 15900, 17867, 19430 and others are numbers only (titles and latest editions unconfirmed).
- The difference between ISO 22412:2025 and the 2017 edition.
- Specific formulas and values such as the Raman ID/IG ratio, the Scherrer constant and the XPS shell-thickness calculation (we confirmed only the titles and the gist of the review).
- Acceptance criteria and inspection frequency for production lots. TG 125 does not define them, and we have not confirmed any company’s published values.
- Particle size is a different quantity for each method. There are equivalent circular, height-based, hydrodynamic, electrical-mobility, volume-square-equivalent and mass-equivalent diametersSourced
- The direction of bias differs. Electron microscopy, AFM and SAXS tend to read low; DLS, PTA and DMAS tend to read highSourced
- The basis of the distribution changes the conclusion. In our example, 20 nm particles making up 99% by number looked like 9% by volume and 0.01% by scattering intensityOur calculation
- Electron microscopy counts 300 particles for σg ≤ 1.5 and 700 or more for σg > 1.5. Conductive-coating thickness is reported and subtractedSourced
- BET measures specific surface area. The sphere-equivalent diameter is an idealised calculation and does not match the microscope size for porous materials or agglomeratesOur calculation
- A reference material’s value is also “with a method”. NIST gold RM 8012 is given as 27.6 nm by TEMSourced
- The measurement method is part of the specification. State the quantity, the distribution basis, the preparation and the instrument conditions (Commentary)
15. Glossary
- Equivalent spherical / circular diameter
- A diameter converted to a sphere (or circle) according to the measurement principle. In microscopy, the diameter of a circle with the same area as the image.
- Hydrodynamic diameter
- The diameter of a sphere, including solvation layer and adsorbates, converted from the speed of diffusion (DLS, PTA).
- Number basis / intensity basis
- A distribution counted by particles / one weighted by scattered-light intensity.
- Geometric standard deviation (σg)
- The width of a distribution assuming a lognormal form. TG 125 calls 1.5 or less “narrow”.
- Feret diameter
- The distance between parallel lines enclosing a particle in an image. Minimum and maximum Feret diameters are used for non-spherical particles.
- Skeletal density
- The density of the material itself, excluding closed pores inside particles. Determined by gas pycnometry.
- BET method
- A method that obtains specific surface area from the amount of physically adsorbed gas molecules.
- Crystallite
- A region that behaves as a single crystal in X-ray diffraction. One particle may consist of several crystallites.
- SEM / TEM
- Scanning / transmission electron microscopy. They give surface morphology / a projected image of particles.
- AFM / STM
- Atomic force microscopy (measures height) / scanning tunnelling microscopy (observes conductive surfaces).
- DLS / PTA
- Dynamic light scattering / particle tracking analysis. They obtain a hydrodynamic diameter from Brownian motion.
- DMAS
- Differential mobility analysis system. It obtains a diameter from the electrical mobility of aerosol particles.
- SAXS
- Small-angle X-ray scattering. It obtains a diameter from the angular dependence of scattered intensity.
- sp-ICP-MS
- Single-particle ICP mass spectrometry. It obtains a mass-equivalent diameter from the metal signal of each particle.
- Reference material (RM)
- A sample with assigned values, used for checking or calibrating measurements.
- Interlaboratory comparison (ILC)
- A test in which several laboratories measure the same sample to evaluate a method’s validity.
- Multiple scattering
- Light scattered more than once in a concentrated sample. It makes DLS diameters look smaller.
16. Primary sources
- OECD Test Guideline No. 125 "Nanomaterial Particle Size and Size Distribution of Nanomaterials", adopted 30 June 2022, corrected 4 July 2023 (PDF) — oecd.org
- OECD Test Guideline No. 124 "Determination of the Volume Specific Surface Area of Manufactured Nanomaterials", 30 June 2022 — oecd.org
- ISO ISO 21363:2020 "Nanotechnologies — Measurements of particle size and shape distributions by transmission electron microscopy" — iso.org
- ISO ISO 19749:2021 "Nanotechnologies — Measurements of particle size and shape distributions by scanning electron microscopy" — iso.org
- ISO ISO 22412:2017 "Particle size analysis — Dynamic light scattering (DLS)" — iso.org
- ISO ISO 22412:2025 "Particle size analysis — Dynamic light scattering (DLS)" — iso.org
- ISO ISO 9277:2022 "Determination of the specific surface area of solids by gas adsorption — BET method" — iso.org
- ISO ISO/TS 19590:2017 "Nanotechnologies — Size distribution and concentration of inorganic nanoparticles in aqueous media via single particle inductively coupled plasma mass spectrometry" — iso.org
- U.S. National Nanotechnology Initiative (NNI) "NIST Issues First Nanoparticle Reference Materials for Biomedical Research" (PDF) — nano.gov
- NIST Murphy KE et al., "Characterization of nanoparticle suspensions using single particle inductively coupled plasma mass spectrometry", NIST Special Publication 1200-21 (PDF) — nvlpubs.nist.gov
- Patterson AL "The Scherrer Formula for X-Ray Particle Size Determination", Physical Review 1939;56:978-982 (cited by title only) — doi.org/10.1103/PhysRev.56.978
- Ferrari AC, Basko DM "Raman spectroscopy as a versatile tool for studying the properties of graphene", Nat Nanotechnol 2013;8:235-246 — doi.org/10.1038/nnano.2013.46
- Shard AG "A Straightforward Method For Interpreting XPS Data From Core-Shell Nanoparticles", J Phys Chem C 2012;116:16806-16813 (cited by title only) — doi.org/10.1021/jp305267d
- European Commission Commission Recommendation of 10 June 2022 on the definition of nanomaterial (2022/C 229/01) — eur-lex.europa.eu
- NBCI (Nanotechnology Business Creation Initiative) "NBCI Feedback on Chemicals – new rules on carcinogenic, mutagenic or reproductive toxic substances subject to restrictions", 6 February 2026 (PDF) — nbci.jp
17. Claim-to-source audit
| Claim in the text | Basis | Label |
|---|---|---|
| Particle size is an equivalent spherical diameter depending on measurement principle (circular for microscopy) and is also affected by preparation, analysis, weighting and type of average. The subscripts for distributions (number 0, length 1, area 2, volume 3, intensity i). The tendency d0 < d2 < d3, and that conversion is possible only under special conditions and generally not recommended. Range, quantity, basis and state of sample for eight methods (Table 1); tendencies to read high or low and which methods give a number basis directly (Table 2); the reasoning for judging when a method reads low or high (paragraph 37) | OECD TG 125 (paragraphs 20 to 24 and 37; Tables 1 and 2)[Source 1] https://www.oecd.org/content/dam/oecd/en/publications/reports/2023/07/test-no-125-nanomaterial-particle-size-and-size-distribution-of-nanomaterials_4e91976f/af5f9bda-en.pdf | Sourced |
| Electron microscopy: principles of SEM and TEM, number-based equivalent circular diameter, 300 particles (σg ≤ 1.5) / 700 or more (σg > 1.5), the resolution and uncertainty table (Table 4), reporting and subtracting conductive-coating thickness, treatment of particles within agglomerates, fibres by electron microscopy only, combination with EDX. Titles and scopes of ISO 21363:2020 (TEM) and ISO 19749:2021 (SEM), and the rule of thumb of several hundreds or thousands of particles | OECD TG 125 (paragraphs 5 and 110 to 122)[Source 1] https://www.oecd.org/content/dam/oecd/en/publications/reports/2023/07/test-no-125-nanomaterial-particle-size-and-size-distribution-of-nanomaterials_4e91976f/af5f9bda-en.pdf. ISO 21363[Source 3] https://www.iso.org/standard/70762.html. ISO 19749[Source 4] https://www.iso.org/standard/66235.html | Sourced |
| AFM: height-based equivalent circular diameter, tip apex radius below 10 nm, not using lateral data for size, substrate roughness (below 5% of particle size recommended), orientation dependence of non-spherical particles, difficulty with mixtures, distinguishing agglomerates only in limited cases such as σg < 1.2 | OECD TG 125 (paragraphs 40 to 50)[Source 1] https://www.oecd.org/content/dam/oecd/en/publications/reports/2023/07/test-no-125-nanomaterial-particle-size-and-size-distribution-of-nanomaterials_4e91976f/af5f9bda-en.pdf | Sourced |
| DLS: hydrodynamic diameter (intensity basis) from fluctuations in scattered intensity, intensity scaling with the sixth power of radius (outside the Mie region), inclusion of the electrical double layer and adsorbates, dependence on dispersing conditions, concentration effects, transformation not recommended, checking with a certified reference material. That the ISO 22412 cited by OECD TG 125 is the 2017 edition and that the ISO catalogue also lists a 2025 edition | OECD TG 125 (paragraphs 96 to 108)[Source 1] https://www.oecd.org/content/dam/oecd/en/publications/reports/2023/07/test-no-125-nanomaterial-particle-size-and-size-distribution-of-nanomaterials_4e91976f/af5f9bda-en.pdf. ISO 22412:2017[Source 5] https://www.iso.org/standard/65410.html. ISO 22412:2025[Source 6] https://www.iso.org/standard/85505.html | Sourced |
| What PTA, CLS, DMAS and SAXS measure and their tendencies; the standard numbers in Appendix B (ISO 13318-1, -2 and -3; ISO 15900; ISO/TS 12025; ISO 17867; ISO 19430). That sp-ICP-MS could not be sufficiently validated in the interlaboratory comparison. The title of ISO/TS 19590:2017 | OECD TG 125 (Tables 1 and 2; Appendices B and C)[Source 1] https://www.oecd.org/content/dam/oecd/en/publications/reports/2023/07/test-no-125-nanomaterial-particle-size-and-size-distribution-of-nanomaterials_4e91976f/af5f9bda-en.pdf. ISO/TS 19590[Source 8] https://www.iso.org/standard/65419.html | Sourced |
| BET method: scope of ISO 9277:2022 (type II and IV isotherms; inaccessible pores not detected; cannot be reliably applied to solids that absorb the gas). VSSA as mass-specific surface area times skeletal density, with skeletal density by gas pycnometry | ISO 9277:2022 catalogue entry[Source 7] https://www.iso.org/standard/71014.html. OECD TG 124[Source 2] https://www.oecd.org/en/publications/test-no-124-determination-of-the-volume-specific-surface-area-of-manufactured-nanomaterials_abb72f8f-en.html | Sourced |
| The Scherrer formula for XRD (title). That Raman spectroscopy of graphene is used for layers, edge quality, strain, doping, disorder and the like. A paper on interpreting XPS data from core-shell nanoparticles (title). That EDX can be used alongside to identify mixed samples | Patterson 1939[Source 11] https://doi.org/10.1103/PhysRev.56.978. Ferrari et al. 2013[Source 12] https://doi.org/10.1038/nnano.2013.46. Shard 2012[Source 13] https://doi.org/10.1021/jp305267d. EDX: OECD TG 125 (paragraph 115)[Source 1] https://www.oecd.org/content/dam/oecd/en/publications/reports/2023/07/test-no-125-nanomaterial-particle-size-and-size-distribution-of-nanomaterials_4e91976f/af5f9bda-en.pdf | Sourced |
| For a powder of 20 nm spheres (99% by number) and 200 nm spheres (1% by number), the 20 nm share is 99.0% by number, 49.7% by surface area, 9.0% by volume and 0.01% by scattering intensity (intensity using the d6 approximation) | Our calculation. The assumptions of spheres, one density and two monodisperse populations are ours. The caution that the sixth-power rule holds outside the Mie region is from OECD TG 125 (paragraph 106) | Our calculation |
| By d = 6/(ρ × SSA), TiO2 (density assumed 4.0 g/cm³) with SSA 50, 10 and 1.5 m²/g gives 30 nm, 150 nm and 1 µm. A sphere of Au (19.3 g/cm³) with a TEM diameter of 27.6 nm gives about 11.3 m²/g. The SSA corresponding to 6 m²/cm³ is 1.5 m²/g for TiO2 and about 0.31 m²/g for Au | Our calculation. The assumptions of spheres, monodisperse, no internal pores and smooth surfaces, and the TiO2 density, are ours. The Au density and the TEM diameter of RM 8012 are from Table 6 of NIST SP 1200-21[Source 10] https://nvlpubs.nist.gov/nistpubs/SpecialPublications/NIST.SP.1200-21.pdf | Our calculation |
| Sample preparation: representativeness and homogeneity, avoiding fractionation, changes caused by preparation (breakage, filter loss, dissolution, insufficient disassembly, the ISO 14887 recommendation of 5% by number concentration), stability of the dispersion, the three preparation routes, items in the test report | OECD TG 125 (paragraphs 25 to 29, 33, 34 and 176)[Source 1] https://www.oecd.org/content/dam/oecd/en/publications/reports/2023/07/test-no-125-nanomaterial-particle-size-and-size-distribution-of-nanomaterials_4e91976f/af5f9bda-en.pdf | Sourced |
| That NIST issued gold-sphere reference materials of nominal 10, 30 and 60 nm in January 2008, the development of six measurement methods, and the NNI wording “world’s first”. The TEM diameters of RM 8011, 8012 and 8013 as 8.9, 27.6 and 56 nm (RM 8013 56 ± 0.5 nm) and of RM 8017 (nominal 75 nm) as 74.6 nm. That TG 125 recommends certified reference materials for calibration and lists the interlaboratory-comparison materials in Appendix E | NNI[Source 9] https://www.nano.gov/sites/default/files/nistissuesfirstnanoparticlereferencematerials.pdf. NIST SP 1200-21[Source 10] https://nvlpubs.nist.gov/nistpubs/SpecialPublications/NIST.SP.1200-21.pdf. OECD TG 125 (paragraphs 24, 174 and 175)[Source 1] https://www.oecd.org/content/dam/oecd/en/publications/reports/2023/07/test-no-125-nanomaterial-particle-size-and-size-distribution-of-nanomaterials_4e91976f/af5f9bda-en.pdf | Sourced |
| “50% or more by number” in the EU recommendation, recital 8 (JRC guidance), recital 14 (difficulty of identifiable constituent particles) and recital 20 (NanoDefine result and volume-specific surface area below 6 m²/cm³). NBCI’s statement that TG 125 calls for extremely labor-intensive measurements and that no realistic method exists to measure a 0.1 wt% inclusion at the mixture threshold | Commission Recommendation 2022/C 229/01[Source 14] https://eur-lex.europa.eu/legal-content/EN/TXT/?uri=CELEX:32022H0614(01). NBCI position paper (an industry body’s opinion)[Source 15] https://www.nbci.jp/topics/public/doc/20260206_260206_NBCIFeedbacktopublicconsultationCMRV01.pdf | Sourced |
| Rearranging the TG 125 recommendations into steps 1 to 5 plus calibration. The suggestion that specifications state the quantity, distribution basis, and preparation and instrument conditions. The suggestion to combine methods whose biases run in opposite directions. The framing that the regulatory question is about number while plant control is about mean diameter. The reading that a volume-specific surface area exclusion can serve for the “not nano” side but cannot prove it. That STM is covered only as background | Our reading and commentary on the published content. They are not views stated by any of the bodies | Commentary |
| The method-by-method values in the certificates of NIST RM 8011 to 8013, any standard for STM, the text of ISO standards, the difference between ISO 22412:2025 and the 2017 edition, specific values for Raman ID/IG, the Scherrer constant and XPS formulas, and acceptance criteria and inspection frequency for production lots | Not stated, because we could not confirm them in public primary sources within the scope of our research | Commentary |
| That Figs. 1 and 6 are AI-generated images and Figs. 2 to 5 and 7 are explanatory vector drawings | Our note | Commentary |
Last updated 9 October 2026. Sources are limited to primary material (OECD test guidelines, standards bodies’ catalogues, documents from NIST and NNI, peer-reviewed papers and the European Commission recommendation), plus an industry body’s opinion where this is stated. Readings and organisation are marked as Commentary and kept separate from sourced fact. We could not confirm the following in primary sources, so we do not state them as fact: the method-by-method values in NIST reference-material certificates, any standard for STM, the text of ISO standards, the difference between the two editions of ISO 22412, specific Raman, XRD and XPS formulas and values, and acceptance criteria and inspection frequency for production lots. The calculations in Sections 8 and 9 are illustrations this article made under stated assumptions and are not measured values for any real material. All figures are explanatory concept graphics. Figs. 1 and 6 are AI-generated images, and Figs. 2 to 5 and 7 are vector drawings; none of them shows a real instrument, product or measurement screen.