TECHNOLOGY EXPLAINER
Battery Evaluation and Degradation
— how and under what conditions the single number "cycle life" was measured
A battery's life cannot be summed up in one datasheet number. With the same commercial cell, simply changing temperature, depth of discharge and discharge rate within the manufacturer's allowed range changed the number of cycles to 80% capacity by thousands of cycles. This article sets out, from primary sources, how to read the evaluation metrics, the degradation mechanisms (SEI growth, lithium plating, particle cracking, transition-metal dissolution), the pitfalls of evaluation, and ways to read internal degradation without destroying the cell (dQ/dV and others).
- What battery evaluation is (the short version)
- Reading the metrics correctly — capacity, energy, power, internal resistance, life, C-rate, depth of discharge, end point
- Degradation mechanisms — SEI growth, lithium plating, particle cracking, transition-metal dissolution
- Degradation modes — reading by "what was lost"
- Pitfalls of evaluation — temperature, rate, depth of discharge and pressure change the result
- Our calculation: compare by cycles or by energy throughput?
- Reading the inside without destroying the cell — periodic capacity and resistance checks, dQ/dV
- Test standards and procedures
- Limits, and what could not be confirmed
- How to read evaluations and standards
- Glossary
- References (primary sources)
- Claim-to-source audit
Sourced = stated in published material (link given)
Our calculation = a figure this article derived, with the assumptions spelled out
Not yet confirmed = a plan or schedule whose record has not been confirmed
Materials-design interpretations are marked separately as Commentary. Inference is shown in bold.
The life and degradation figures here are laboratory results for particular commercial cells tested under particular conditions. They do not describe the life of production cells in general and are not predictions for real equipment. Please do not read laboratory coin-cell or champion data as the performance of production cells. This article does not rank products or companies.
1. What battery evaluation is (the short version)
- Evaluation is a measurement made under conditions: capacity and life become numbers only once temperature, current, voltage range and rest time are fixed. A number without its conditions cannot be compared
- Life is not one thing: there is the life that shrinks with repeated charge and discharge (cycle life) and the life that shrinks even when the cell is left unused (calendar life). Both change with how the end point is defined (at what percentage of capacity life is considered over)
- Read degradation by "what was lost": there are many causes of capacity loss, but sorting them into "degradation modes" — was lithium lost, was active material lost, or did resistance rise? — ties them to non-destructive measurementsSourced [Sources 4, 5]
"Cycle life of N cycles" means something only when its conditions are stated. Preger et al. report that even when operated within the manufacturer's specifications, the conditions had a profound effect on degradation, and the time and cycle count to reach 80% capacity varied by thousands of hours and thousands of cycles within each chemistrySourced [Source 1].
2. Reading the metrics correctly — capacity, energy, power, internal resistance, life, C-rate, depth of discharge, end point
Definitions differ slightly between procedures. Here we follow the definitions in the US Department of Energy's Idaho National Laboratory (INL) Battery Test Manual for Electric Vehicles (Revision 3, June 2015) and add what the IEC standard pages stateSourced [Sources 6, 7, 8].
| Metric | Meaning | Reading note |
|---|---|---|
| Capacity (Ah) | Charge that can be taken out in a discharge. The INL manual's "rated capacity" is the usable capacity over the full electrochemical range between the upper and lower voltage limits at a C/3 current; it is provided by the manufacturer or set at beginning of life and then held fixed during life testing | The value changes with the current at which rated capacity is measured. C/3 is INL's convention; other procedures may differ |
| Energy (Wh) | Capacity multiplied by voltage. The INL manual's "available energy" is the value at a C/3 discharge | Always check whether it is material, cell or pack (what the denominator is) |
| Power (W) | Electric power available over a given time. The INL manual uses the HPPC test (Hybrid Pulse Power Characterization) to follow pulse power and energy capability with aging | Power changes with temperature, state of charge and pulse length |
| Internal resistance | Resistance obtained from the voltage drop under current. Pulse resistance is obtained from the pulse response in the HPPC test | The value changes with pulse length (seconds or tens of seconds), temperature and state of charge |
| Cycle life | Number of charge–discharge repeats until the end point. Preger et al. used equivalent full cycles (EFC) = cumulative discharge capacity ÷ nominal capacity | With a different depth of discharge or current, one cycle means something different. EFC can hide differences when cells of different capacity or energy are compared |
| Calendar life | Degradation that proceeds even when the cell is not used. The SEI starts to grow as soon as the anode is lithiated and exposed to electrolyte, and grows even when the cell is unused; heat speeds it up | The storage temperature and state of charge must be stated |
| C-rate | Current divided by a reference capacity (1C is the current that would use up that capacity in one hour) | The current changes with which capacity is the reference (nominal or measured). Preger et al. used nominal capacity |
| Depth of discharge (DOD) / state of charge (SOC) | In the INL manual, DOD is the share of capacity removed by discharge relative to full charge. SOC is an estimate of charge capability relative to rated capacity, typically reached by obtaining specified voltages | Preger et al.'s SOC windows were set by voltages taken from the fresh cells' discharge curves and not adjusted as the cells aged |
| End point of capacity retention | The capacity fraction at which life is considered over. 80% is often used as a reference in specification sheets | The INL manual defines end of life (EOL) as the point at which the device can no longer meet the targets, not a simple value such as 80% capacity. It depends on the application |
All Sourced (INL manual [Source 6], Preger et al. [Source 1], Edge et al. [Source 2]). The general meanings of C-rate and internal resistance are this article's commentary.
IEC 62660-1:2018 is a standard for performance and life testing of lithium-ion cells used for propulsion of electric vehicles (BEV and HEV), giving test procedures for capacity, power density, energy density, storage life and cycle life (Edition 2.0, published 12 December 2018)Sourced [Source 7]. IEC 62620:2014+AMD1:2023 specifies marking, tests and requirements for lithium secondary cells and batteries for industrial applications, including stationary ones; where a standard for a special application such as the IEC 62660 series for road vehicles conflicts, that one takes precedence (Edition 1.1, published 12 May 2023)Sourced [Source 8]. Both texts are paid, so this article keeps to their stated scope.
In the commercial 18650 cells of Preger et al., capacity fell roughly linearly whatever the conditions, a little faster at the start and at the end of cycling. They say this matches a three-phase degradation modelSourced [Source 1].
- Phase 1: lithium is consumed forming the SEI, and capacity drops suddenly
- Phase 2: lithium keeps being lost in side reactions and capacity falls nearly linearly
- Phase 3: rapid capacity fade as the cell fails, often attributed to an impedance increase
Attia et al. call the sharp bend of phase 3 the "knee" and review it. They list six pathways to a knee: lithium plating, electrode saturation, resistance growth, electrolyte and additive depletion, percolation-limited connectivity, and mechanical deformation. The important point is that some pathways cannot be detected electrochemicallySourced [Source 3].
3. Degradation mechanisms — SEI growth, lithium plating, particle cracking, transition-metal dissolution
The review by Edge et al. (Phys. Chem. Chem. Phys. 2021, open access) sets out the degradation mechanisms regarded as most important in normal operationSourced [Source 2].
| Mechanism | What happens (as described in the review) | What speeds it up |
|---|---|---|
| SEI growth | The SEI forms on the first charge, costing about 10% of capacity. It then keeps thickening, through solvent diffusing through it, new surfaces exposed by cracking, plated lithium, and transition metals dissolved from the cathode. The growth rate roughly follows the square root of time. It traps lithium (capacity loss), impedes ion transport (resistance rise) and consumes electrolyte solvent | Heat (faster diffusion) and high current (cracking, new surfaces). It proceeds even when unused if the anode is lithiated and in contact with electrolyte |
| Lithium plating | Metallic lithium deposits on the anode surface instead of intercalating into graphite. There is thermodynamic plating (the anode is full) and kinetic plating (fast charging). Plated lithium reacts with electrolyte to add SEI, and can become electrically isolated as "dead lithium". It can grow as dendrites that puncture the separator and cause an internal short | Low temperature (even moderate charge rates below freezing), high state of charge, high current, and insufficient anode mass or area. Giving the anode 10–20% spare capacity and an edge overhang is standard practice |
| Particle cracking | Stress from large volume change of active material cracks particles in both electrodes. Cracks expose new surface, so the SEI re-forms, and electrical contact between particles is lost. Calendering can crack particles even before use | Large-volume-change materials (the review's table: graphite about 12%, silicon about 320%, LTO about 1%), high current, deep discharge, large particles |
| Cathode structural change and transition-metal dissolution | In layered oxides such as NMC, the delithiated layered structure turns into disordered spinel and rock-salt phases and releases oxygen. Ni2+/Li+ site exchange (disordering) slows lithium diffusion. Moisture in the electrolyte generates HF, and the acid dissolves transition metals from the cathode. Dissolved metal promotes SEI growth on the anode | High state of charge (deep delithiation), heat, moisture |
All Sourced (Edge et al. [Source 2]). The review does not cover salt precipitation, current-collector corrosion, binder decomposition, separator pore blockage or electrode–collector delamination.
Of the four mechanisms in the table, SEI growth, lithium plating and transition-metal dissolution all happen at the electrode–electrolyte interface, and they speed one another up: dissolved transition metal promotes SEI growth, plated lithium adds SEI, and cracked particles create new interface.
To a materials engineer it matters that moisture in the electrolyte and LiPF6 produce the HF that is the source of the acid attacking the cathode (the review's reactions: LiPF6 → LiF + PF5; PF5 + H2O → POF3 + 2HF)Sourced [Source 2]. Electrode drying, the hygroscopicity of materials and electrolyte additives bear directly on life.
Lithium plating is something anode design is meant to prevent (capacity margin against the cathode, edge overhang), but the review says these measures are not enough to stop plating during fast charging or below freezing. Plating also bears on safety: that it can lower the onset temperature of thermal runaway is covered in our explainer on thermal runaway and battery safety. The SEI itself, dendrites and cracking of silicon anodes are covered in our explainers on SEI, dendrites, and silicon anodes and nanostructured electrodes.
4. Degradation modes — reading by "what was lost"
Degradation mechanisms are many and entangled. "Degradation modes" sort them not by root cause but by their effect on the electrode voltage response. Birkl et al. grouped them into the three below, and showed their effect on voltage experimentally in coin cells in which known amounts of lithium and active material had been removedSourced [Source 4].
- LLI (loss of lithium inventory): usable lithium decreases
- LAM (loss of active material): active material of the positive or negative electrode decreases (LAMPE, LAMNE)
- Kinetic limitation: a rise in resistance or a slowing of reaction rate
Dubarry and Anséan (Front. Energy Res. 2022, open access) explain that early capacity loss in graphite-based cells is usually dominated by LLI, and that loss of active material (LAM) is a "hidden degradation mode" that barely shows up in capacity while an electrode still has margin. Active material can be lost without any capacity loss as long as that electrode is not the one limiting capacitySourced [Source 5]. It is an important reminder that capacity loss and degradation are different things: a cell may still hold 80% of its capacity while degradation is progressing inside.
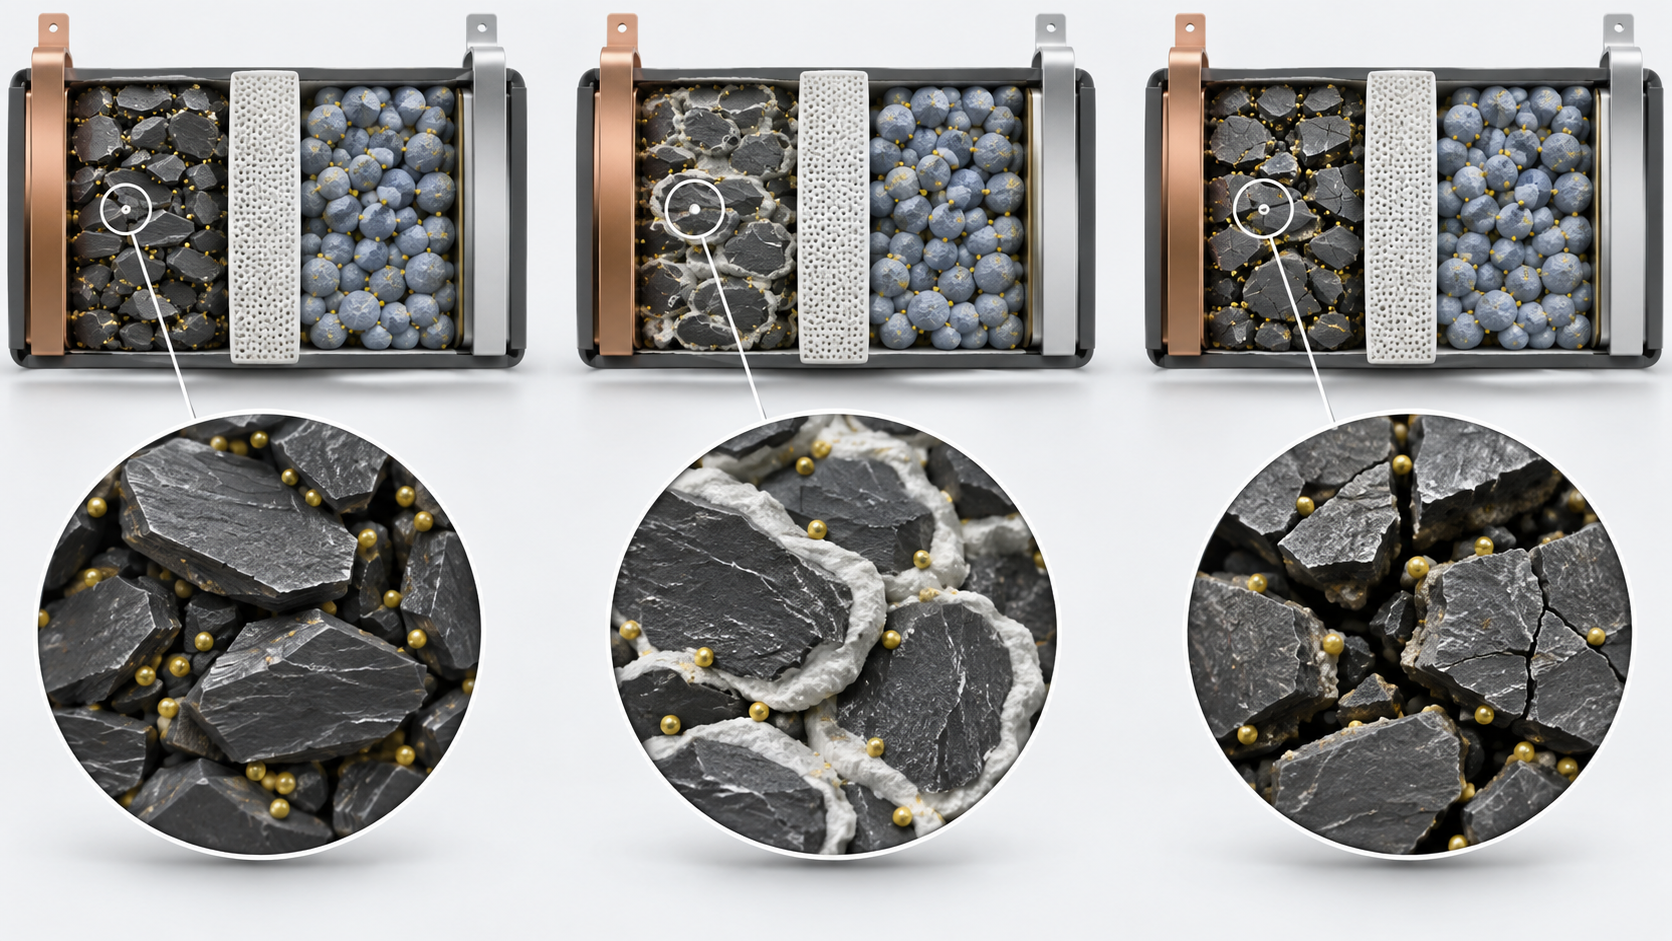
View the original SVG schematic and exact annotations
The anode is built with margin over the cathode to prevent lithium plating (the review gives 10–20% as standard) [Source 2]. In addition, forming the SEI consumes lithium at the first cycle, so the cathode cannot be fully re-lithiated. Both electrodes thus have an "unused part", and a loss of active material does not show in capacity as long as that part is spare [Source 5].
For a materials engineer this means that even if particles are isolated by cracking or coating loss, an initial capacity test will not notice. Conversely, even when capacity fade reads as "lithium loss", whether the cause is SEI or plating cannot be separated without other information (temperature history, charge rate, the shape of dQ/dV). Evaluation has to be read from a combination of measurements, not from the single number of capacity (Commentary).
5. Pitfalls of evaluation — temperature, rate, depth of discharge and pressure change the result
In degradation tests, changing one condition can reorder the results. The table collects the main examples that could be confirmed in primary sources.
| Condition | How the result changes | Source |
|---|---|---|
| Temperature | In the 15–35 °C range, the capacity fade rate of LFP cells rose with temperature while that of NMC cells fell, which points to different dominant mechanisms. Preger et al. stress the value of testing several temperatures within the normal operating range, not only extremes | [1] |
| Discharge rate | Discharge rate was a statistically significant factor, but the direction of the dependence differs by chemistry. The NMC cells showed no systematic dependence in this test | [1] |
| Depth of discharge (SOC window) | NMC and NCA cells were more sensitive than LFP cells to cycling over the full range (0–100%) | [1] |
| Pressure (pouch, prismatic) | Both zero and too-high external pressure bring the knee (rapid fade) earlier; an intermediate value is best. For 37 Ah NMC/graphite pouch cells, cycle life was reported to rise from 500 cycles (no bracing) to 3,200 cycles (optimal spring compression). Uneven pressure also causes local lithium plating | [3] (cited) |
| Cell-to-cell variation | Preger et al. show that results vary even against earlier studies under the same conditions, and argue that degradation models should be reported with a standard deviation. At least two cells were tested for each condition | [1] |
| Choice of metric | By cycle count (EFC) LFP is overwhelmingly long-lived, but the gap shrinks when compared by energy (Section 6). Round-trip efficiency also varied by up to about 10% with conditions and can fall by more than 5% with aging | [1] |
| Reference conventions | C-rate was based on nominal capacity. SOC windows used voltages from the fresh cells' discharge curves and were not adjusted with aging. 100% DOD charging used CCCV (constant current, constant voltage) with the current tapered to 0.05 A | [1] |
| How resistance is measured | Internal resistance depends strongly on the timescale of the measurement. DC pulses such as HPPC and electrochemical impedance spectroscopy (EIS) give matching resistance when their timescales match (results for 20 Ah LFP/graphite pouch cells) | [9] |
All Sourced (Preger et al. [1], Attia et al. [3], Barai et al. [9]). Preger et al. tested commercial 18650 cells and Barai et al. 20 Ah pouch cells; the results cannot be generalised to other cells.
Harlow et al. ran long-term cycling at 20, 40 and 55 °C, storage and high-precision coulometry on NMC532/graphite pouch cells for up to three years, and concluded that "cells of this type should be able to power an electric vehicle for over 1.6 million kilometers and last at least two decades in grid energy storage". The authors themselves caution that format-dependent losses of other cell formats, such as cylindrical, may not be capturedSourced [Source 10]. This is an extrapolation, for one excellent cell chemistry under specific conditions. It cannot be used as a statement of the life of other cells or of real equipment (this article's caution).
The effect of pressure is not merely mechanical. Attia et al. describe rate-dependent lithium plating as starting once the anode porosity falls below a critical value (a threshold pathway). Too much pressure reduces local porosity and narrows the ion pathways, which provokes plating. Too little pressure worsens particle contact and conductionSourced [Source 3]. Electrode thickness, porosity and binder content should be evaluated together with the clamping pressure as one design, and a life obtained under the pressure of a coin cell or laboratory fixture does not necessarily apply to the pressure conditions of a pouch cell or module (Commentary).
6. Our calculation: compare by cycles or by energy throughput?
Take the range of equivalent full cycles (EFC) to 80% capacity from Preger et al. and convert it to cumulative discharge energy by multiplying by nominal energyOur calculation.
- Nominal energy (nominal capacity × nominal voltage): LFP 1.1 Ah × 3.3 V = 3.63 Wh; NCA 3.2 Ah × 3.6 V = 11.52 Wh; NMC 3 Ah × 3.6 V = 10.8 Wh (values from the paper's Table I)
- EFC ranges (paper): LFP 2,500–9,000; NCA 250–1,500; NMC 200–2,500
- Conversion: LFP from 2,500 × 3.63 = about 9.1 kWh to 9,000 × 3.63 = about 32.7 kWh. NCA from 250 × 11.52 = about 2.9 kWh to 1,500 × 11.52 = about 17.3 kWh. NMC from 200 × 10.8 = about 2.2 kWh to 2,500 × 10.8 = about 27.0 kWh
- How the ratio changes: comparing the lower ends of the ranges, the LFP-to-NCA ratio is 2,500 ÷ 250 = 10 times in EFC but 9.1 ÷ 2.9 = about 3.2 times in energy. For the upper ends it is 9,000 ÷ 1,500 = 6 times in EFC and 32.7 ÷ 17.3 = about 1.9 times in energy
Assumptions and limits: this is a rough estimate that uses the same nominal energy for every cycle; the actual cumulative discharge energy (Preger et al. summed the energy of each discharge) differs. The ranges also span different temperatures, depths of discharge and discharge rates, and the LFP upper end includes extrapolation for cells that had not reached 80%. It is not a like-for-like comparison. Even so, it is clear that what you count changes the size of the gap several-fold, and the paper itself says the LFP advantage narrows when judged by energy [Source 1].
Use the review's statement that SEI growth is roughly proportional to the square root of time [Source 2]Our calculation. If the capacity lost to this mechanism alone were 2% in the first year (an illustrative value), then after 4 years it would be 2% × √4 = 4%, after 9 years 2% × √9 = 6%, and after 25 years 2% × √25 = 10%.
Assumptions and limits: this is a strong simplification in which only the SEI sets capacity and temperature and state of charge stay constant. In reality a knee (Section 2), lithium plating and temperature changes are added, so this extrapolation cannot be used to predict life. The calculation only illustrates a caution: a mechanism that slows down with the square root of time makes extrapolation from a short test optimistic, and it fails if another mechanism appears later.
7. Reading the inside without destroying the cell — periodic capacity and resistance checks, dQ/dV
Taking a cell apart (destructive analysis) is accurate, but the cell is lost. Dubarry and Anséan place methods based on derivatives of the voltage response between simple capacity/resistance monitoring and full post-mortem investigation, with a good balance of accuracy and resourcesSourced [Source 5].
| Method | What it reveals | Conditions and cautions |
|---|---|---|
| Reference performance test (RPT) | Life testing is interrupted periodically and capacity and other quantities are measured under the same conditions and compared with the first measurement (RPT0) to give the degradation rate. This is the INL manual's approach | Repeat with fixed measurement conditions (Commentary). The first measurement (RPT0) is the baseline |
| Pulse tests (HPPC etc.), electrochemical impedance spectroscopy (EIS) | Internal resistance and its dependence on timescale. A resistance rise reduces power, and is also one pathway to a knee [3] | Resistance values depend on the timescale of the measurement (Section 5). Be careful comparing numbers across methods |
| dQ/dV (incremental capacity analysis, ICA), dV/dQ (differential voltage analysis, DVA) | From derivatives of the voltage curve, read the position, height and width of peaks corresponding to electrode phase changes. Degradation modes (LLI, LAM, kinetic limitation) can be quantified. ICA is also sensitive to resistance changes | Most accurate with low-rate (C/10 or below, C/25 preferred) constant-current data. Voltage resolution of 1 mV or finer is preferred. Interpretation differs by chemistry, and carrying a method from one chemistry to another invites errors |
| Open-circuit voltage (OCV) fitting | Reproduce the OCV curve with the electrodes' own curves to estimate the amounts of lithium and active material lost | Birkl et al. showed the effect of the modes experimentally with coin cells in which known amounts of lithium and active material had been removed |
All Sourced (INL manual [6], Birkl et al. [4], Dubarry and Anséan [5], Barai et al. [9]).

What to look for in dQ/dV
Dubarry and Anséan list cautions for using ICA in practiceSourced [Source 5].
- Peaks correspond to phase changes: a solid-solution reaction changes voltage continuously and gives a broad peak; a phase-transformation reaction gives a voltage plateau and a sharp peak. Each electrode material has its own "fingerprint"
- Either charge or discharge can be read: choose to suit the application. The low-voltage graphite peaks are more visible in charge and the high-voltage features in discharge
- Lithium plating is easier to see in charge: it can appear as an extra peak about 80 mV above the last graphite peak (depending on rate and cathode). Plating that is not irreversible does not cost capacity; the irreversible part adds to LLI
- Peak-area analysis is specific to LFP: it is not recommended for other chemistries
- Data quality: low voltage resolution, noise and high current reduce accuracy. Check that filtering and smoothing have not distorted peak shapes
- The authors warn that the ICA literature contains many errors (a "minefield"), partly because a valid analysis differs by chemistry
A dQ/dV peak is materials information: which electrode, which phase transition. Graphite, layered oxides (NMC and others) and LFP give peaks at different positions and shapes (LFP, which reacts by two-phase coexistence, gives sharp peaks). If a peak moves, it tells which electrode is changing and how; if a peak shrinks, it can be read as less material available to the reaction.
This presupposes a comparison with the fresh cell taken at low rate. At high current, thermodynamic and kinetic information mix and become hard to read. Doing the same analysis from battery-management-system operating data (high rate, dynamic current) needs a model [Source 5]. Diagnosis of degradation in real equipment cannot always take the laboratory method over as it is (Commentary).
8. Test standards and procedures
The procedures for evaluating performance and degradation are set in application-specific standards and manuals. The table lists those whose number, title and scope could be confirmed on an official pageSourced.
| Standard / manual | Subject | What could be confirmed |
|---|---|---|
| IEC 62660-1:2018 | Performance and life testing of lithium-ion cells for propulsion of electric vehicles (BEV, HEV) | Test procedures for capacity, power density, energy density, storage life and cycle life. Edition 2.0, published 12 December 2018 [7] |
| IEC 62620:2014+AMD1:2023 | Marking, tests and requirements for industrial lithium secondary cells and batteries, including stationary use | Edition 1.1, published 12 May 2023. Standards for special applications, such as IEC 62660 for road vehicles, take precedence [8] |
| INL/EXT-15-34184 Revision 3 (US Department of Energy) | Battery test manual for electric vehicles | Static capacity test, HPPC test, dynamic stress test for cycle life, calendar life test, reference performance test (RPT). June 2015 [6] |
The texts of standards are paid, so this article keeps to their stated scope. The review by Barai et al. compared the measurement methods in international standards for high-power automotive and grid cells and notes that stakeholders have often devised their own procedures, which makes comparison difficult [Source 11].
9. Limits, and what could not be confirmed
(1) Standard texts
The texts of IEC 62660-1 and IEC 62620 were not checked. Test temperatures, currents, cycling procedures and end-point criteria are therefore not given.
(2) Life of real equipment and large cells
The numbers in Sections 5 and 6 are laboratory results for small commercial 18650 cells and pouch cells. They are not converted to the life of production cells, large cells or real equipment (packs and systems).
(3) Procedures for electrochemical impedance spectroscopy (EIS)
Standard EIS procedures and how to read equivalent circuits are not given, because primary material could not be confirmed. Only the finding of Barai et al. that resistance changes with the timescale of the measurement is shown.
(4) Other chemistries
Degradation of other chemistries such as sodium-ion, lithium–sulfur and all-solid-state batteries is not covered. Interface degradation in all-solid-state batteries is covered in our all-solid-state battery series.
(5) Differences between sources
The definition of the end point (80%, or the point at which targets can no longer be met) differs by source. This article shows both and does not unify them.
- "Life of N cycles" is a number with conditions. Even within the manufacturer's allowed range, differing conditions changed the life to 80% capacity by thousands of cyclesSourced
- Degradation mechanisms are entangled. SEI growth follows roughly the square root of time; lithium plating occurs when cold and at high current; particle cracking comes from volume change; transition-metal dissolution proceeds through moisture-derived HFSourced
- Reading by "what was lost" (LLI, LAM, resistance) links to non-destructive measurements. There is "hidden" degradation in which active material is lost without showing in capacitySourced
- Pitfalls: the direction of the temperature effect is opposite for different chemistries, pressure has an optimum, resistance changes with the measurement timescale, and the choice of metric (cycles or energy) changes the size of the gap several-foldSourced / Our calculation
- dQ/dV is used with low-rate constant-current data and with chemistry-specific reading. The literature is warned to contain many errorsSourced
10. How to read evaluations and standards
Before comparing which number is larger, align the basis of comparison in the following order. This is an editorial reading checklist, not a set of test conditions or acceptance limits prescribed by a standard.
- 1. What was measured?
- capacity retention, internal resistance, calendar life and cycle life. Check the units and whether the result describes a material, component or complete system.
- 2. Under which conditions?
- temperature, C-rate, depth of discharge, state of charge, rest time and end criterion. Treat results under different conditions as separate results before comparing them.
- 3. The comparison trap
- Compare elapsed time and energy throughput, not cycle count alone.
- 4. What does the standard cover?
- Check the identifier, title, edition and scope in the issuing body’s material. Distinguish test methods, safety, interoperability and management requirements. Naming a standard alone does not establish that a test, conformity assessment or certification has been completed.
Keep a comparison note containing the object, units, conditions, sample count and variation, comparator, standard edition and unresolved points. Do not invent numerical conditions or acceptance limits from a public abstract of a standard.
11. Glossary
- C-rate
- Current divided by a reference capacity. 1C is the current that uses up the reference capacity in one hour.
- DOD / SOC
- Depth of discharge / state of charge: the share of capacity used / the share of charge remaining.
- EFC
- Equivalent full cycles: cumulative discharge capacity divided by nominal capacity.
- SOH
- State of health: the condition of capacity or resistance relative to new.
- EOL
- End of life. Depending on the source, 80% capacity or the point at which targets can no longer be met.
- RPT
- Reference performance test: periodic measurement under the same conditions, interrupting life testing.
- HPPC
- Hybrid pulse power characterization: examines power and resistance with pulses.
- EIS
- Electrochemical impedance spectroscopy: separates resistance components by varying AC frequency.
- LLI / LAM
- Loss of lithium inventory / loss of active material. Two of the degradation modes.
- ICA / DVA
- Reading electrode reactions from derivatives of the voltage curve (dQ/dV, dV/dQ).
- Knee
- A point at which the trajectory of capacity or resistance suddenly bends.
- Dead lithium
- Metallic lithium that has become electrically isolated and unusable.
12. References (primary sources)
- Preger Y. et al. "Degradation of Commercial Lithium-Ion Cells as a Function of Chemistry and Cycling Conditions", J. Electrochem. Soc. 167, 120532 (2020), DOI 10.1149/1945-7111/abae37 (open access) — doi.org/10.1149/1945-7111/abae37
- Edge J. S. et al. "Lithium ion battery degradation: what you need to know", Phys. Chem. Chem. Phys. 23, 8200–8221 (2021), DOI 10.1039/D1CP00359C (open access) — doi.org/10.1039/d1cp00359c
- Attia P. M. et al. "Review—'Knees' in Lithium-Ion Battery Aging Trajectories", J. Electrochem. Soc. 169, 060517 (2022), DOI 10.1149/1945-7111/ac6d13 (open access) — doi.org/10.1149/1945-7111/ac6d13
- Birkl C. R. et al. "Degradation diagnostics for lithium ion cells", J. Power Sources 341, 373–386 (2017), DOI 10.1016/j.jpowsour.2016.12.011 — doi.org/10.1016/j.jpowsour.2016.12.011
- Dubarry M., Anséan D. "Best practices for incremental capacity analysis", Front. Energy Res. 10, 1023555 (2022), DOI 10.3389/fenrg.2022.1023555 (open access) — doi.org/10.3389/fenrg.2022.1023555
- Christophersen J. P. (Idaho National Laboratory) "Battery Test Manual for Electric Vehicles, Revision 3", INL/EXT-15-34184, June 2015 (US Department of Energy) — inldigitallibrary.inl.gov
- IEC "IEC 62660-1:2018" product page (IEC Webstore) — webstore.iec.ch/en/publication/28965
- IEC "IEC 62620:2014+AMD1:2023" product page (IEC Webstore) — webstore.iec.ch/en/publication/85493
- Barai A. et al. "A study of the influence of measurement timescale on internal resistance characterisation methodologies for lithium-ion cells", Sci. Rep. 8, 21 (2018), DOI 10.1038/s41598-017-18424-5 (open access) — nature.com/articles/s41598-017-18424-5
- Harlow J. E. et al. "A Wide Range of Testing Results on an Excellent Lithium-Ion Cell Chemistry to be used as Benchmarks for New Battery Technologies", J. Electrochem. Soc. 166, A3031–A3044 (2019), DOI 10.1149/2.0981913jes (open access) — doi.org/10.1149/2.0981913jes
- Barai A. et al. "A comparison of methodologies for the non-invasive characterisation of commercial Li-ion cells", Prog. Energy Combust. Sci. 72, 1–31 (2019), DOI 10.1016/j.pecs.2019.01.001 (open access) — doi.org/10.1016/j.pecs.2019.01.001
13. Claim-to-source audit
| Claim in the text | Basis | Class |
|---|---|---|
| Test conditions of the commercial 18650 cells (LFP, NCA, NMC): 15, 25 and 35 °C, SOC windows, discharge 0.5–3C, charge 0.5C, at least two cells per condition; EFC to 80% capacity (LFP 2,500–9,000; NCA 250–1,500; NMC 200–2,500); that most LFP cells had not reached 80% so the figures are extrapolated; the three-phase degradation model; that 80% is often used as a reference in specification sheets; that the gap narrows when judged by energy; the range of round-trip efficiency; the dependence on temperature (LFP fade rises with temperature, NMC falls), depth of discharge and discharge rate; the definition of EFC; the reference conventions for C-rate and SOC; the table of specifications | Preger et al. (2020) Reference 1 https://doi.org/10.1149/1945-7111/abae37 | Sourced |
| The first-cycle SEI formation (about 10% capacity loss) and growth near the square root of time; the mechanism and drivers of lithium plating (below freezing, 10–20% anode margin) and dead lithium; cathode structural change, transition-metal dissolution and HF in NMC; particle cracking and volume change (graphite about 12%, silicon about 320%, LTO about 1%); the mutual acceleration of mechanisms | Review by Edge et al. (2021) Reference 2 https://doi.org/10.1039/d1cp00359c | Sourced |
| The definition of the knee and the six pathways (lithium plating, electrode saturation, resistance growth, electrolyte and additive depletion, percolation, mechanical deformation); that some cannot be detected electrochemically; the effect of pressure (zero or too-high pressure brings a knee, an optimum exists, 37 Ah NMC/graphite pouch from 500 to 3,200 cycles); that plating begins when anode porosity falls below a critical value | Review by Attia et al. (2022), including studies it cites Reference 3 https://doi.org/10.1149/1945-7111/ac6d13 | Sourced |
| Degradation modes (LLI, LAM, kinetic limitation) shown experimentally in coin cells with known amounts of lithium and active material removed; quantification by OCV fitting | Birkl et al. (2017) Reference 4 https://doi.org/10.1016/j.jpowsour.2016.12.011 | Sourced |
| The position of ICA/DVA (between simple monitoring and post-mortem), low rate (C/10 or below, C/25 preferred), resolution of 1 mV or finer, the meaning of peaks (solid solution and phase transformation), the plating peak (about 80 mV above the last graphite peak), LFP peak-area analysis, hidden degradation modes, the warning that the literature contains many errors | Dubarry and Anséan (2022) Reference 5 https://doi.org/10.3389/fenrg.2022.1023555 | Sourced |
| The INL manual's definitions (rated capacity at C/3, DOD, SOC, EOL as the point at which targets can no longer be met, RPT, HPPC) and its test structure (static capacity, HPPC, dynamic stress, calendar life) | INL/EXT-15-34184 Revision 3 (June 2015) Reference 6 https://inldigitallibrary.inl.gov/sites/STI/STI/6492291.pdf | Sourced |
| The scope of IEC 62660-1:2018 and its Edition 2.0 of 12 December 2018; the scope of IEC 62620:2014+AMD1:2023 and its Edition 1.1 of 12 May 2023; that IEC 62660 takes precedence | IEC Webstore Reference 7 https://webstore.iec.ch/en/publication/28965 Reference 8 https://webstore.iec.ch/en/publication/85493 | Sourced |
| That internal resistance depends strongly on the measurement timescale and that HPPC and EIS give matching resistance when timescales match (20 Ah LFP/graphite pouch cells); the review's remark that procedures are not unified across standards | Barai et al. (2018, 2019) Reference 9 https://www.nature.com/articles/s41598-017-18424-5 Reference 11 https://doi.org/10.1016/j.pecs.2019.01.001 | Sourced |
| The long-term tests on NMC532/graphite pouch cells (20, 40 and 55 °C, up to three years), the authors' conclusion (over 1.6 million km for an electric vehicle, at least two decades in grid storage), and their caution that losses specific to other formats may not be captured | Abstract of Harlow et al. (2019) Reference 10 https://doi.org/10.1149/2.0981913jes | Sourced |
| Nominal energy (LFP 3.63 Wh, NCA 11.52 Wh, NMC 10.8 Wh); cumulative energy converted from the EFC ranges (LFP about 9.1–32.7 kWh, NCA about 2.9–17.3 kWh, NMC about 2.2–27.0 kWh); the lower-end ratio (10 times to about 3.2 times) and upper-end ratio (6 times to about 1.9 times). The square-root-law loss (an illustrative 2% in the first year gives 4% at 4 years, 6% at 9 years, 10% at 25 years) | Our calculation. A rough estimate using nominal capacity × nominal voltage held constant over all cycles; the ranges span differing conditions and the LFP upper end includes extrapolation. The square-root example is a simplification with one mechanism and constant conditions and cannot be used to predict life | Our calculation |
| The texts of IEC 62660-1 and 62620, standard EIS procedures and equivalent-circuit reading, conversion to the life of production cells, large cells or real equipment, and degradation of other chemistries | Not given, because they could not be confirmed in the primary sources accessible to this article | Commentary |
| The readings “the entrance to degradation is the interface and moisture”, “capacity fell and active material fell are not the same”, “pressure is a question of electrode porosity”, “peak movement translates into the language of materials”, and “diagnosis in real equipment cannot take the laboratory method over as it is”. The matching of mechanisms to modes (Fig. 3). The framing of “what you count” | This article's own sorting and commentary based on the published material. Not a view stated by any company or body | Commentary |
| That Figs. 2, 3, 4 and 5 are explanatory drawings, not real observations or data, and that Figs. 1 and 6 are AI-generated images | Note from this article | Commentary |
Last updated 10 October 2026. Sources are limited to primary material (peer-reviewed papers, a US Department of Energy test manual and standards-body pages). The texts of standards are paid and could not be checked. Because the article includes structural readings and materials-design interpretations, those are marked as Commentary and kept separate from sourced fact. The texts of IEC 62660-1 and 62620, standard EIS procedures, conversion to the life of production cells, large cells or real equipment, and degradation of other chemistries could not be confirmed and are not stated here. The life and degradation figures are laboratory results for particular commercial cells under particular conditions and cannot be generalised to other cells or to real equipment. All figures are explanatory concept graphics. Figs. 2, 3, 4 and 5 are vector drawings; Figs. 1 and 6 are AI-generated images, and none of them shows a real cross-section, micrograph or physical product.