TECHNOLOGY EXPLAINER
Cathode Materials
— how far to pull the lithium out, and how to hold back the breakdown
The cathode of a lithium-ion battery sets much of a cell's voltage and energy density, and it is the biggest single component by cost. This article covers the three structural families (layered oxides: LCO, NMC, NCA; olivine: LFP, LMFP; spinel: LMO, LNMO), three directions of development (high nickel, high voltage, cobalt-free), four degradation pathways (particle cracking, surface rock-salt formation, oxygen release, transition-metal dissolution), particle design (polycrystalline, single-crystal, concentration-gradient, coated) and synthesis (co-precipitation and calcination), from a materials engineer's point of view and built on peer-reviewed papers and public-institute reports. Resources and sourcing are left to the “Battery Raw Materials and Supply Chains” article in this series. Nothing here is investment, procurement or design advice.
- What a cathode material is (the short version)
- Three structural families — layered, spinel, polyanion
- Our calculation: the gap between theoretical and practical capacity
- A materials engineer's view (1): “lithium utilisation” trades capacity against life
- High nickel, high voltage, cobalt-free — three directions
- Our calculation: cobalt per kWh
- Four degradation pathways
- A materials engineer's view (2): cracking, oxygen and dissolution are linked
- Particle design — polycrystalline, single-crystal, gradient, coated
- Synthesis — co-precipitation and calcination
- Where LFP, LMFP and spinel stand
- Strengths and weaknesses; how this article divides work with others in the series
- How to read evaluations and standards
- Glossary
- References (primary sources)
- Claim-to-source audit
Sourced = content stated in published material (link given)
Our calculation = a figure this article derived, with the assumptions spelled out
Not yet confirmed = a plan or target with no confirmed track record
Structural readings and materials-design interpretations are marked separately as Commentary. An Inference is shown in bold.
Every battery figure is accompanied by whether it is a material value (half-cell and similar), a cell value or a pack value. A laboratory best result is never presented as the performance of a mass-produced product.
Values in papers are values under the conditions reported.
1. What a cathode material is (the short version)
The cathode is “the crystal that gives up lithium on charge and takes it back on discharge”. The perspective by Li and co-authors in Nature Energy says the cathode is normally the largest component by both weight and cost in state-of-the-art lithium-ion cells and is still a main bottleneck for energy densitySourced. The IEA puts the cathode active material at 40 to 50% of cell production cost for NMC batteries and 25 to 30% for LFP batteriesSourced.
- Three families: according to Manthiram's review, the oxide cathodes in use fall into layered oxides, spinel oxides and polyanion oxides, all of which originate from Goodenough's groupsSourced. The 2020 review calls these the only practical classes
- Two aims: to raise capacity (more lithium extracted, more nickel, higher voltage), and to reduce expensive, unevenly distributed elements such as cobaltSourced
- The core difficulty: the more lithium is pulled out, the higher the capacity, but the less stable the crystal. Li and co-authors summarise that whatever the composition, large lithium utilisation brings singlet oxygen evolution, transition-metal dissolution, rock-salt phase formation and anisotropic lattice distortion (particle cracking)Sourced
Cathode design is a trade between “how far to pull the lithium out” and “how to hold back the breakdown”. Li and co-authors write that higher-nickel layered oxides do not necessarily have fundamentally inferior electrochemical stability, and that the degree of lithium utilisation is often the deciding parameterSourced. Composition, particle, surface and synthesis are all means of moving that trade.
2. Three structural families — layered, spinel, polyanion
Manthiram's review explains the three families through crystal structure, how lithium moves and how voltage is setSourced.
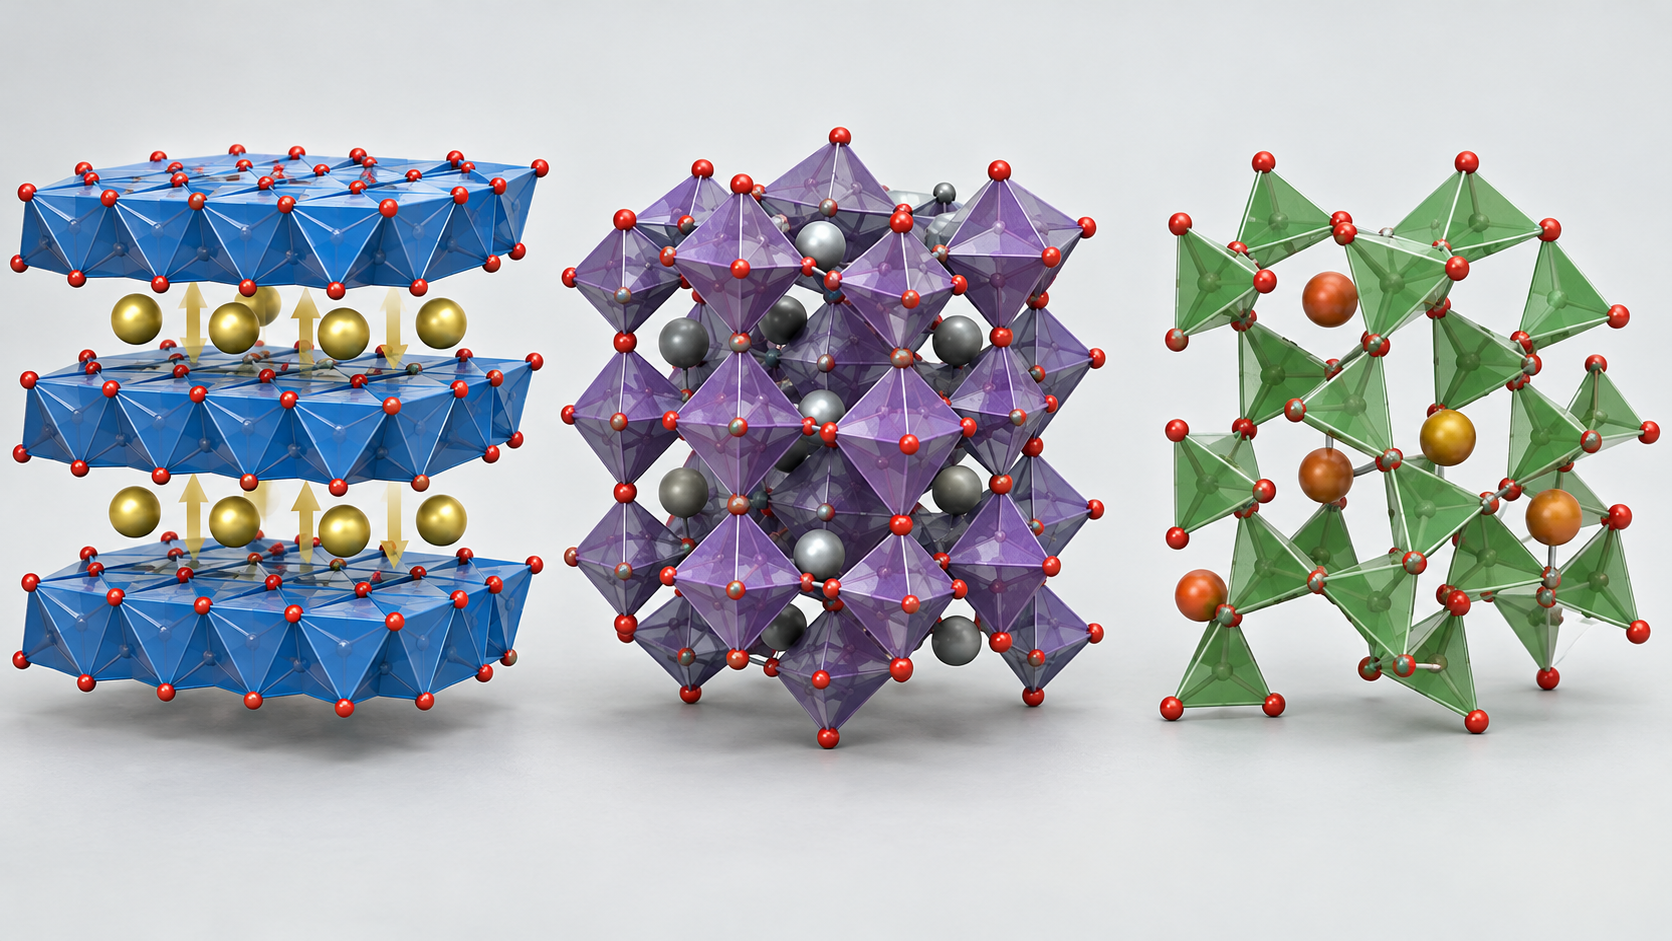
View the original SVG schematic and exact annotations
| Family | Typical materials | Structure and lithium movement | Voltage and capacity examples (conditions) | Strengths / weaknesses | Reference |
|---|---|---|---|---|---|
| Layered oxides | LiCoO2 (LCO), NMC, NCA | Li and transition metal alternate on planes of a cubic close-packed oxide array (O3 structure). Li moves two-dimensionally within its layer | LCO: ~4 V / practical ~140 mAh/g. NMC111: ~160 mAh/g; NMC811, NCA80: ~200 mAh/g (at 4.3 V vs Li, as stated in a review) | Good electronic and Li conduction, high capacity. More Ni raises capacity but cycle, thermal and air stability become problems | [Refs. 1, 2] |
| Spinel oxides | LiMn2O4 (LMO), LiMn1.5Ni0.5O4 (LNMO) | Li occupies tetrahedral sites and moves in three dimensions via empty octahedral sites | LMO: ~4 V / under 130 mAh/g. LNMO: ~4.7 V / ~135 mAh/g (review and perspective) | Fast charge and discharge, cheap. Mn dissolution damages the graphite anode and capacity fades at high temperature. LNMO needs an electrolyte that withstands high voltage | [Refs. 1, 14, 15] |
| Polyanion oxides | LiFePO4 (LFP), LiMnxFe1-xPO4 (LMFP) | Oxygen is bound to P and similar atoms by strong covalent bonds. The inductive effect raises voltage | LFP: ~3.5 V (vs Li), 100 to 110 mAh/g (first report, 1997) | High thermal stability, abundant iron. Low electronic conductivity, so small, carbon-coated particles; low density hurts volumetric energy density | [Refs. 1, 4] |
All Sourced (statements in each reference). Voltages and capacities are values under different conditions placed side by side, not a ranking. Layered and polyanion families are also the basis of sodium-ion battery cathodes [Reference 1].
On the market side, the IEA's Global EV Outlook 2026 (published 20 May 2026) says that LFP accounted for over 55% of EV batteries deployed globally in 2025, up from nearly 50% in 2024 [Reference 3]Sourced. LFP use is concentrated in China and in emerging economies, and among the EV battery chemistries deployed outside China in 2025, almost 80% used nickel-containing chemistries such as NMCSourced. In other words, nickel-based layered oxides and polyanion LFP are used side by side, split by use and region.
3. Our calculation: the gap between theoretical and practical capacity
A cathode's capacity is set by how much of the lithium in the crystal can actually be moved in and out. Theoretical capacity comes from dividing the Faraday constant (96,485 C/mol = 26,801 mAh/mol) by the molar mass of the active material per lithium. Comparing with reported practical capacities gives the lithium utilisation.
Molar masses were calculated from atomic weights (Li 6.94, Ni 58.69, Co 58.93, Mn 54.94, Al 26.98, Fe 55.85, P 30.97, O 16.00)Our calculation.
| Material | Molar mass (g/mol) | Theoretical capacity (mAh/g) | Reported practical capacity (conditions) | Utilisation |
|---|---|---|---|---|
| LiCoO2 (LCO) | 97.87 | about 274 | about 140 (review) | about 51% |
| NMC111 | 96.46 | about 278 | about 160 (4.3 V vs Li, review) | about 58% |
| NMC811 | 97.28 | about 276 | about 200 (4.3 V vs Li, review) | about 73% |
| NCA80 (Li[Ni0.8Co0.15Al0.05]O2) | 96.08 | about 279 | about 200 (4.3 V vs Li, review) | about 72% |
| LiNiO2 (LNO) | 97.63 | about 275 | 240 to 250 (4.3 V vs Li, report cited in the review) | about 87 to 91% |
| LiMn2O4 (LMO) | 180.81 | about 148 | under 130 (review) | under about 88% |
| LiMn1.5Ni0.5O4 (LNMO) | 182.69 | about 147 | about 135 (perspective) | about 92% |
| LiFePO4 (LFP) | 157.75 | about 170 | 100 to 110 (first report, 1997) | about 59 to 65% (first-report value) |
Practical capacities are Sourced (each reference); theoretical capacities and utilisation are Our calculation. The practical capacities are material values such as half-cell results and their conditions are not uniform. The LFP value is from the 1997 first report, not from later improved products.
4. A materials engineer's view (1): “lithium utilisation” trades capacity against life
In the table above, LCO's utilisation is about 51%, NMC811's about 73% and LNMO's about 92%. Manthiram's review attributes LCO's low value to the fact that the Co³⁺/⁴⁺ band overlaps the top of the O 2p band, so charging beyond 50% releases oxygen from the latticeSourced. By contrast, the Ni³⁺/⁴⁺ band only barely touches the top of the O 2p band, so nickel can be oxidised all the way to Ni⁴⁺ without losing oxygen, the review explainsSourced. That is why nickel is being increased.
- The voltage limit differs by material: Jung and co-authors found, in full cells with graphite, stable cycling up to 4.4 V for NMC111 and NMC622 but only up to 4.0 V for NMC811 (conditions of that study)Sourced. For NMC811 the high-voltage feature at about 4.3 V vs Li corresponds to the H2 to H3 phase transition
- Where the oxygen goes: Jung and co-authors say that the CO2 and CO seen at high potential are, they believe, mainly due to chemical reaction of reactive lattice oxygen with the electrolyte rather than electrochemical oxidation of the electrolyteSourced
- How to read a design: a capacity figure that does not say at what upper voltage and what utilisation cannot be used for comparison (Commentary). On seeing a capacity number, check the voltage window and whether it is a half-cell or a full cell
5. High nickel, high voltage, cobalt-free — three directions
The perspective by Li and co-authors estimates that to reach a cell-level specific energy of 350 Wh/kg or more, at least 800 Wh/kg is needed from the cathode active material (for state-of-the-art designs, without a lithium-metal anode)Sourced. That 800 Wh/kg corresponds to about 210 to 215 mAh/g at 3.7 to 3.8 V (vs Li). There are three main roads toward it.
(1) Increase nickel
At 4.3 V (vs Li), about 200 mAh/g can be reversibly accessed from NMC811 and NCA80, against about 160 mAh/g from NMC111Sourced. Over the last decade, energy gains in automotive NMC came mainly from raising nickel content: NMC111 → 523 → 622 → 811. NCA, which started with high nickel, saw only a modest increase from about 250 Wh/kg (cell) in 2009, the perspective notesSourced.
(2) Raise the voltage
Instead of more nickel, this road raises the upper voltage to increase lithium utilisation. Li and co-authors say this “ultrahigh voltage” route brings marginal advantages in thermal-abuse tolerance, but faces electrolyte compatibility issues and cobalt supply riskSourced. The high-voltage spinel LNMO offers about 4.7 V and about 135 mAh/g with high power, but its capacity fades badly in full cells with a graphite anode, particularly at elevated temperature, which has hindered commercialisation. The causes given are metal dissolution at 4.7 V and lithium consumption by an SEI that grows faster when Mn and Ni deposit on graphiteSourced.
(3) Reduce or eliminate cobalt
Li and co-authors summarise the roles of Co, Mn and Al in nickel-based layered oxides as followsSourced.
| Element | Main role | Limit |
|---|---|---|
| Co | Improves rate capability by reducing Li⁺/Ni²⁺ mixing. In high-nickel oxides it limits the formation of surface residual lithium compounds | Expensive and mined mainly in Central Africa |
| Mn | Suppresses multistep two-phase reactions and stabilises the layered structure. Cheap and easy to synthesise. Empirically 20% or more is needed | Promotes Li⁺/Ni²⁺ mixing and worsens rate capability |
| Al | Like Co, improves rate capability; stabilises the layered structure at low levels. Empirically 5% is enough | Rigidity during cycling (particle cracking), a narrow solubility range without impurity phases, more complex synthesis |
All Sourced (the perspective by Li and co-authors [Reference 2]). Manthiram's review [Reference 1] likewise treats Mn⁴⁺ as a structural stabiliser and Co as structurally stable but the origin of oxygen release.
On cobalt use, the same perspective states that state-of-the-art NCM uses 80 to 200 g of Co and 500 to 650 g of Ni per kWh, that NCM-811 uses 80 to 100 g Co/kWh, and that Panasonic's state-of-the-art NCA with under 50 g Co per kWh was deployed in Tesla Model 3 batteries (as of 2019)Sourced. It also notes that experts at cathode and cell makers do not agree on whether high-nickel, low-cobalt NCM is more competitive than NCASourced.
As an example of a cobalt-free high-nickel material, Li, Lee and Manthiram reported NMA (LiNi1−x−yMnxAlyO2) in Advanced Materials [Reference 13]. NMA with 89 mol% Ni had a slightly lower specific capacity than NMC and NCA of identical Ni content but operated at about 40 mV higher voltage, showed no compromise in rate capability, and in pouch cells with graphite outperformed NMC and NCA after 1,000 deep cycles (conditions of that study)Sourced. It only slightly trailed an Al–Mg co-doped NMC and a commercial cathode. Its thermal stability was also reported to be superiorSourced. The perspective by Li and co-authors also offers the view that strictly cobalt-free compositions may not be necessary from purely economic or geopolitical standpoints, and that there is a marketing element as wellSourced.
6. Our calculation: cobalt per kWh
To see what “reducing cobalt” means, we convert composition and capacity into the amount of cobalt needed to make 1 kWh of cell.
Steps (Our calculation): (1) find the molar mass and the mass fraction of Co. (2) Practical capacity × average voltage of 3.7 V = energy per kg of cathode. (3) Cathode mass for 1 kWh = 1,000 ÷ (2). (4) Co mass = (3) × (1).
- LCO: Co mass fraction 60.2%. 140 mAh/g × 3.7 V = 518 Wh/kg → 1.93 kg/kWh → Co about 1,160 g/kWh
- NMC111: Co 20.4%. 160 mAh/g × 3.7 V = 592 Wh/kg → 1.69 kg/kWh → Co about 344 g/kWh
- NCA80: Co 9.2%. 200 mAh/g × 3.7 V = 740 Wh/kg → 1.35 kg/kWh → Co about 124 g/kWh
- NMC811: Co 6.1%. The same 1.35 kg/kWh → Co about 82 g/kWh
Assumptions and limits: the practical capacities are the review values (about 140 for LCO, about 160 for NMC111 and about 200 mAh/g for NMC811 and NCA80), which are half-cell material values (4.3 V vs Li). The average voltage of 3.7 V is our assumption and varies with material and use. Cell design (N/P ratio, capacity margin) and capacity loss from degradation are not included. NCA80 uses a composition with 15% Co, so it is a different composition from the state-of-the-art NCA with “under 50 g Co/kWh” described by Li and co-authors (which has less Co). The roughly 82 g/kWh for NMC811 lands in the same range as the perspective's “80 to 100 g/kWh”Sourced.
7. Four degradation pathways
We organise the degradation that occurs at high lithium utilisation into four pathways, based on primary sources (the grouping into four is this article's own).
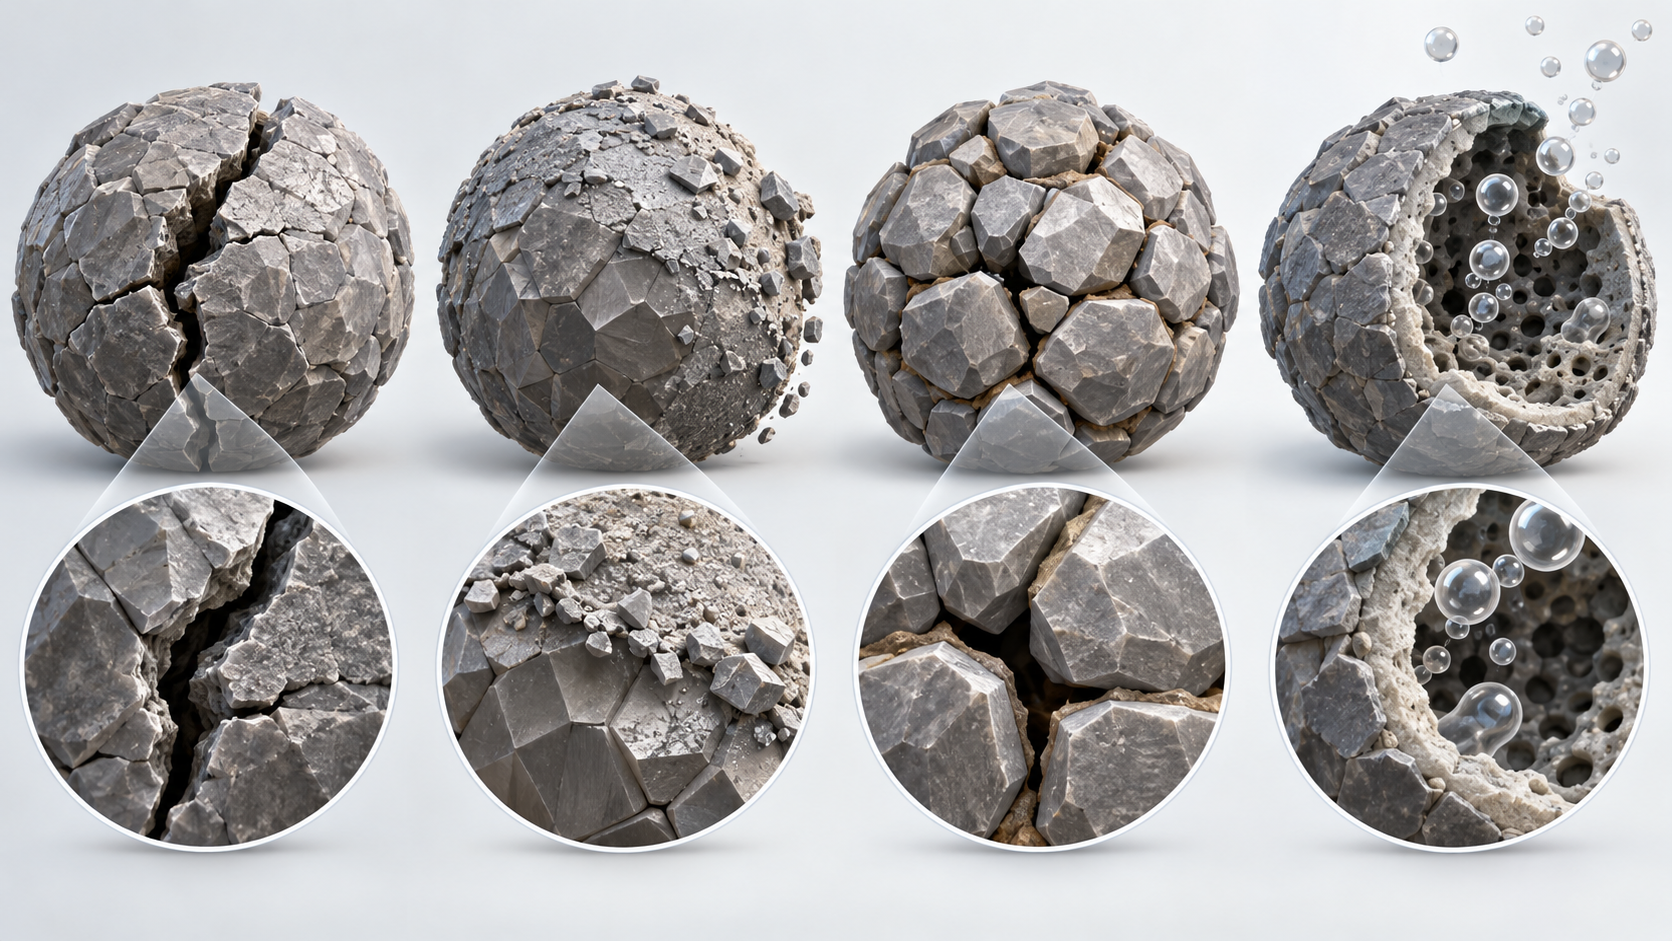
View the original SVG schematic and exact annotations
Degradation in batteries using high-nickel cathodes spans the cathode, the anode and the electrolyte. The review by Jiang and co-authors sets out each degradation process and the stabilisation strategies [Reference 19].
Pathway 1: particle cracking
A standard cathode is spherical polycrystalline secondary particles made by co-precipitation, with hundreds of primary particles densely packedSourced. On cycling, the lattice stretches and shrinks by different amounts along different directions (anisotropic lattice distortion), and in high-nickel materials multistep two-phase reactions add to this, so cracks form. Cracks expose new surface, promoting reaction with the electrolyte, metal dissolution and SEI growth, and speeding capacity loss. This is said to become especially pronounced beyond about 500 cyclesSourced. Yan and co-authors, using scanning transmission electron microscopy on a commercial NMC111, observed that cracks form inside grains (not from grain boundaries or surfaces) and are directly tied to high-voltage cycling, and showed a dislocation-based crack incubation mechanismSourced.
Pathway 2: surface rock-salt formation
Lin and co-authors write that in LiNi1−x−yMnxCoyO2, surface reconstruction from a layered to a rock-salt structure is commonly observed under a variety of operating conditions, particularly in Ni-rich compositions, and contributes to poor high-voltage cyclingSourced. The same paper reports that hierarchically structured LiNi0.4Mn0.4Co0.2O2 particles made by spray pyrolysis, whose surfaces are Ni-poor and Mn-rich, resisted surface reconstruction better and showed improved high-voltage cyclingSourced.
Pathway 3: oxygen release
The review by Sharifi-Asl and co-authors states that oxygen release from oxygen-containing positive electrode materials is one of the major structural degradations, causing rapid capacity and voltage fading and triggering parasitic thermal runaway events, and treats layered, spinel, olivine and Li-rich cathodes in turnSourced. Jung and co-authors say that the CO2 and CO long attributed to electrolyte oxidation in NMC are, they believe, mainly due to chemical reaction of reactive lattice oxygen with the electrolyte, and observed capacity fading tied to the high-voltage phase transition (H2 to H3) in NMC811Sourced. Thermal runaway itself is covered in the “Thermal Runaway and Battery Safety” article in this series.
Pathway 4: transition-metal dissolution
Zhan and co-authors showed, for spinel LiMn2O4 and carbon cells, that the manganese deposited on the anode is in the +2 state, deposited by a metathesis reaction with species in the SEI rather than by reduction to metallic Mn, and that the amount deposited rises with cycling and correlates well with rising anode impedance and capacity fadeSourced. For high nickel, Manthiram writes that Ni⁴⁺ reacts aggressively with the electrolyte to form thick SEI layers and dissolved Ni and Mn deposit on graphite, catalyse electrolyte decomposition and thicken the SEI furtherSourced. Doping with a small amount of Al is described as suppressing metal dissolution and improving long-term cycle lifeSourced.
In addition, for high nickel, surface residual lithium compounds are described as causing storage problems and gas evolution from reactions with the electrolyte, and air stability is also a challengeSourced.
8. A materials engineer's view (2): cracking, oxygen and dissolution are linked
The four pathways are not independent. Manthiram's review draws a chain for high-nickel cathodes: volume change on phase transition creates cracks and new surfaces, surface reactivity rises, metal dissolution and SEI formation advance, and capacity fades faster as cycling goes on (particularly past 500 cycles)Sourced.
- Strengthening the particle reduces cracking but the surface reactivity remains. Single-crystal particles resist cracking, while reaction at the surface is a separate matter (next section)
- Covering the surface reduces dissolution and oxygen contact, but how it is covered (water washing, dry coating, ALD) changes capacity, uniformity and cost (next section)
- Every stabilisation method tends to cost some energy (capacity): Li and co-authors note that most stabilisation strategies impose a penalty in energy content at a given voltage, so their effectiveness has to be validated with cautionSourced
Inference: in materials evaluation, unless cracking (cross-section imaging), surface (thickness of the rock-salt layer), oxygen and gas (gas analysis) and dissolution (elemental analysis on the anode side) are laid side by side under the same conditions, it becomes unclear “what was actually improved”. A paper's “capacity retention after cycling” alone does not say which pathway was affected (Commentary).
9. Particle design — polycrystalline, single-crystal, gradient, coated
Even with the same composition, how the particle is made changes its character. Li and co-authors say particle morphology, microstructure and surface properties are central to the energy output of a cathodeSourced.
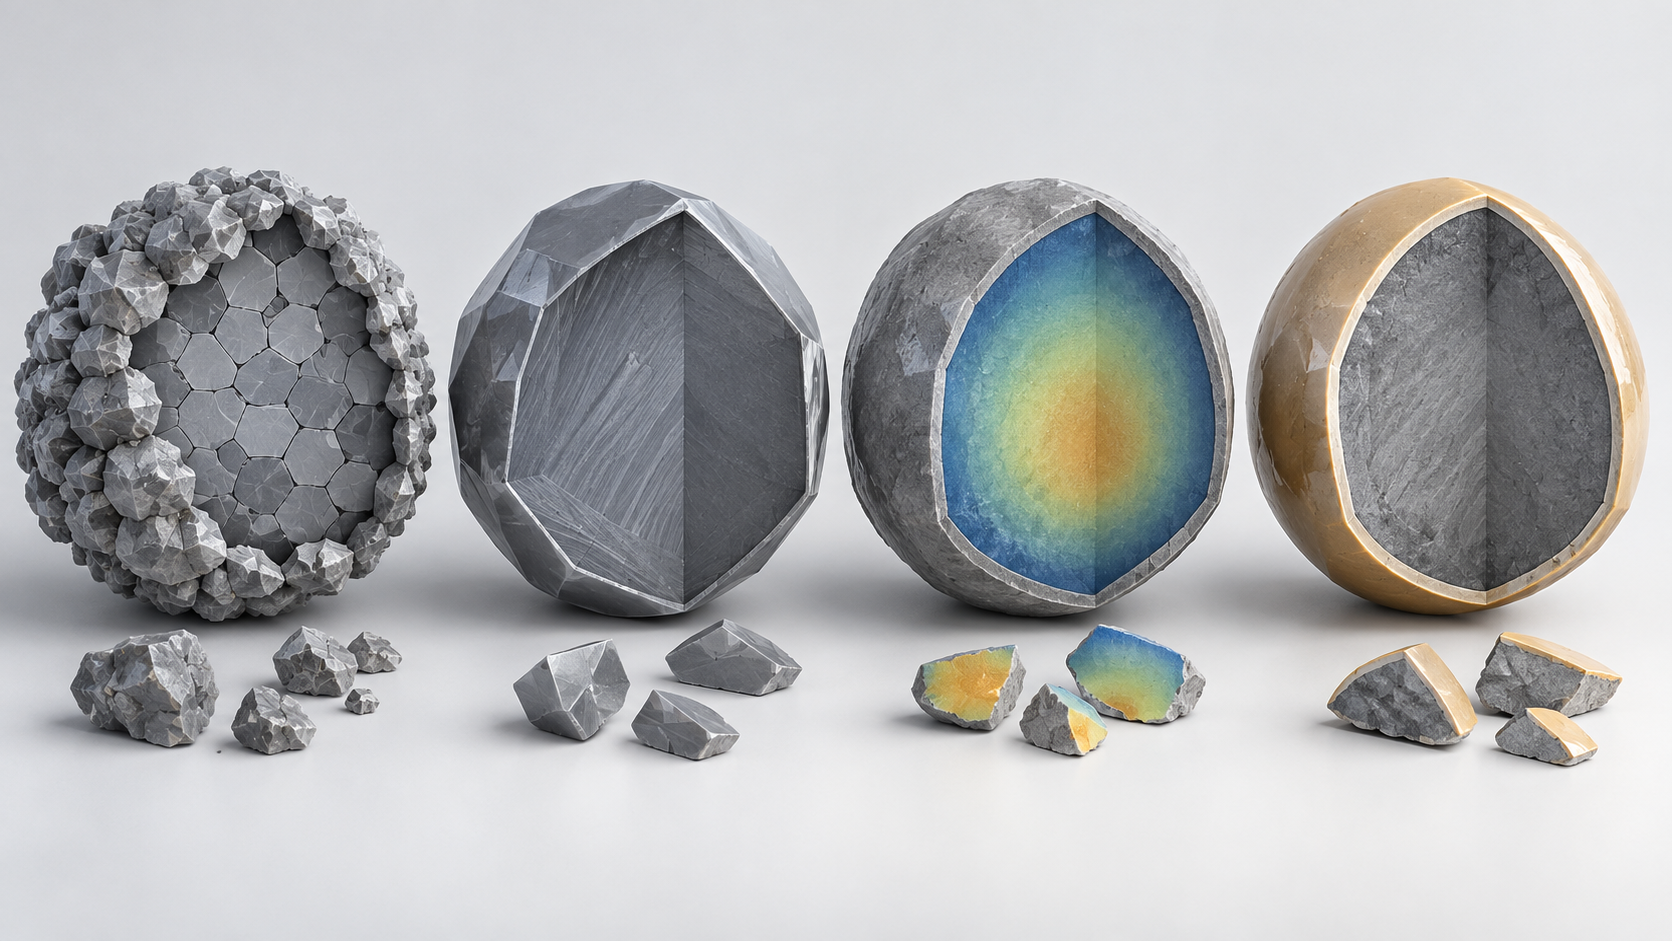
View the original SVG schematic and exact annotations
(1) Standard: polycrystalline secondary particles
High-nickel NCM and NCA electrodes reach about 3.0 to 3.4 g/cm³, against 3.8 to 4.2 g/cm³ for LCO, so they beat LCO in specific energy (Wh/kg) but not in energy density per volume (Wh/L). Pushing electrode density higher (about 3.4 g/cm³ or more) is said to severely compromise rate capability and lifetime through higher impedance, particle pulverisation and electrode delaminationSourced. Tuning the primary particles (nanosizing, realignment, grain-boundary reinforcement) is tried to aid lithium transport, ease strain and raise the mechanical strength of the secondary particleSourced.
(2) Single-crystal
Micron-scale single-crystal particles are mechanically more robust than polycrystalline particles during electrode pressing and battery operation, though with inferior specific capacity and rate capability. The better stability could allow a higher charging voltage (for example 4.5 V vs Li or more) to make up for the capacity, provided compatible electrolytes are developedSourced. The most economical synthesis is described as calcining precipitated precursors of smaller average size (3 to 5 µm, against 10 µm or more as the industrial norm) at high temperature (950°C or more) and/or with a flux, but tuned co-precipitation and calcination lower throughput and raise costSourced. Ge and co-authors examined single-crystal LiNi0.8Mn0.1Co0.1O2 with operando X-ray microscopy and spectroscopy and found sluggish redox at low state of charge, governed by ionic transport, which may be alleviated by combining with polycrystals in the same electrodeSourced.
(3) Concentration gradient
Sun and co-authors reported a cathode in which the particle centre is rich in Ni, and moving outward Ni falls while Mn and Co rise. A half cell gave 209 mAh/g and retained 96% after 50 cycles under an aggressive test (55°C, 3.0 to 4.4 V), and it also did better in thermal-abuse tests than the reference Li[Ni0.8Co0.1Mn0.1]O2Sourced. In another paper, a “full-gradient” material in which Ni falls linearly and Mn rises linearly gave 215 mAh/g, with secondary particles made of aligned needle-like nanosize primary particlesSourced. Li and co-authors, however, say concentration-gradient NCM had not registered a notable market share in the automotive cathode landscape, citing the cost and consistency concerns of a more complicated co-precipitation, the fact that the Ni-rich core and Mn-rich surface need different calcination temperatures, and a possible need for surface passivation against Mn dissolution (as of 2019)Sourced.
(4) Surface and grain-boundary stabilisation
As-synthesised high-nickel powder is routinely surface-treated for stability during electrode fabrication and cell operation. Li and co-authors describe dry or water-based coating as the most economical for industry; water-based coating washes off surface Li residues directly but exposure to water promotes surface rock-salt formation (Li leaching) and lowers capacity and cyclability; wet coating in organic solvents avoids this and gives good uniformity but at extra cost for fire hazards and waste disposal; and CVD and ALD give the best uniformity but must fall further in priceSourced. Coatings can cover the secondary particles only or penetrate to coat primary particles, and passivation at the primary-particle level can be more effective at suppressing gas generation and mechanical fractureSourced. Dopants such as Mg, Zr and Ti are routinely introduced into commercial high-nickel oxides for tuning, but optimal amounts are very small (sometimes ppm level), and large amounts cause structural defects and impurities that degrade propertiesSourced.
10. Synthesis — co-precipitation and calcination
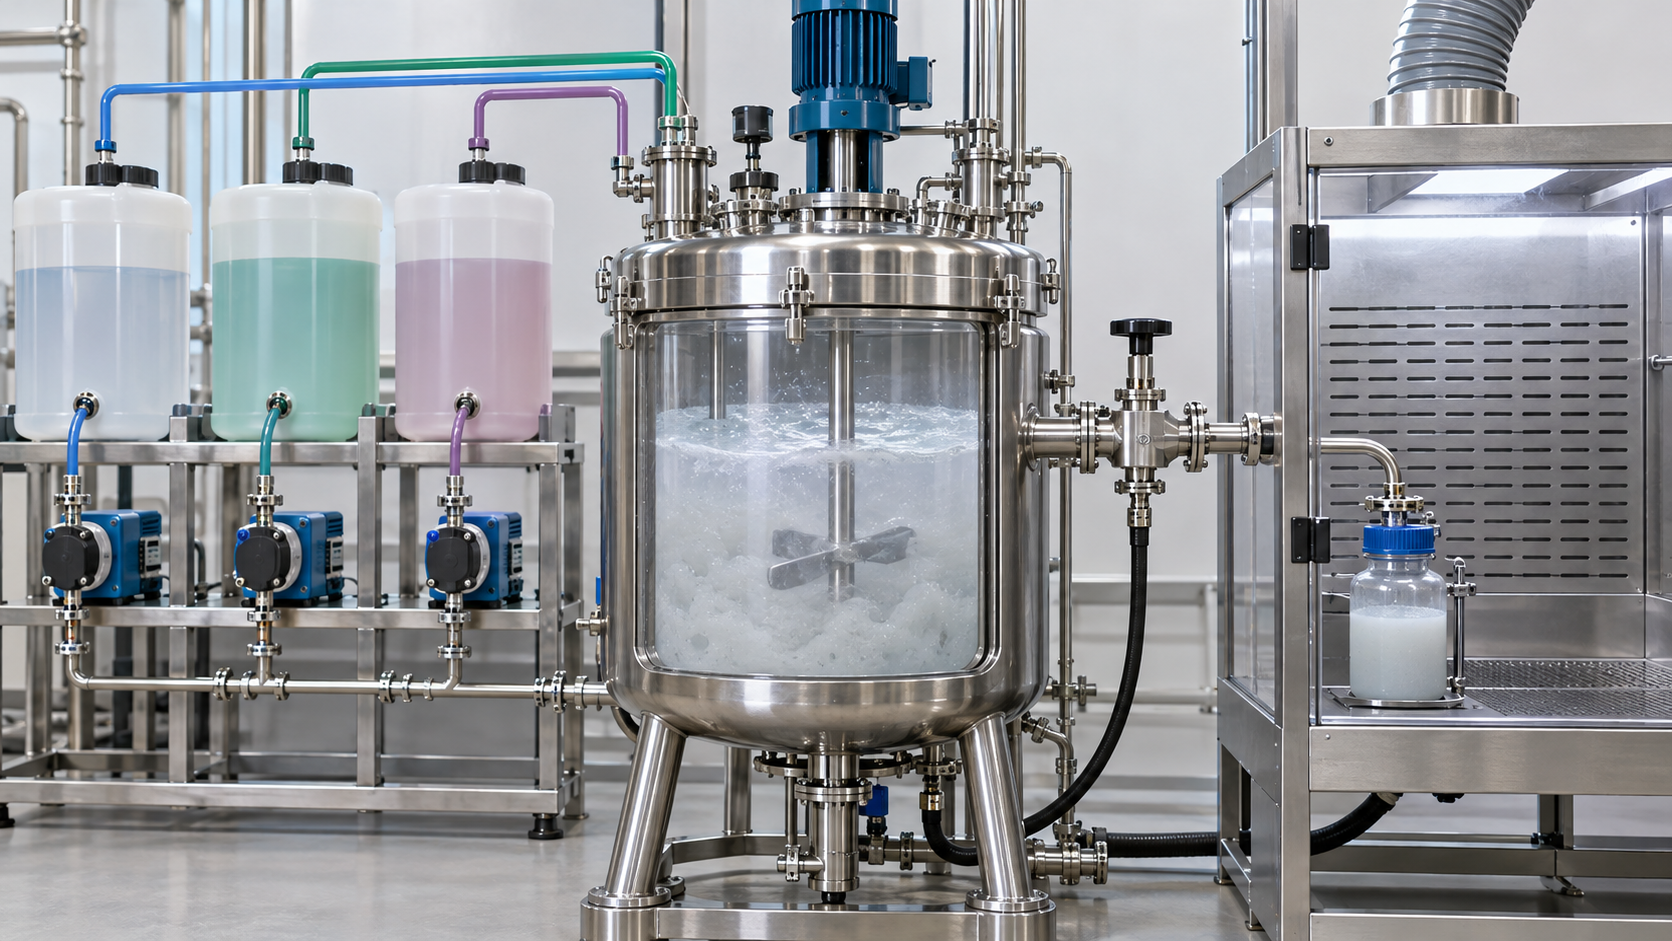
The Argonne National Laboratory technoeconomic model (Journal of Power Sources, 2026) sets out an industrial synthesis of NMC step by step. These are the model's assumptions, not the actual conditions of any manufacturerSourced.
In the model, the precursor is made from sulfates by co-precipitation (nitrogen atmosphere, 95°C, pH 11 to 11.5), mixed with lithium hydroxide monohydrate and calcined in an oxygen atmosphere. After calcination the material is deagglomerated, milled and sized, washed while a coating material is mixed in, dried and calcined a second timeSourced. The calcination conditions assumed in the Argonne model are as follows (values from its Table 7).
| Composition | Polycrystalline (calcination 1) | Single-crystal (calcination 1) | Calcination 2 (all) |
|---|---|---|---|
| NMC622 | peak 825°C, soak 6 h | peak 875°C, soak 10 h | 700°C, 2 h |
| NMC811 | peak 775°C, soak 6 h | peak 825°C, soak 10 h | 700°C, 2 h |
| NMC955 (90% Ni) | peak 700°C, soak 6 h | peak 750°C, soak 10 h | 700°C, 2 h |
All Sourced (the assumptions of the Argonne National Laboratory technoeconomic model; also a heating ramp of 2.8°C/min, a cooling ramp of 4.0°C/min and saggar loads of 10 kg for polycrystalline and 5 kg for single-crystal) [Reference 12]. These are not actual manufacturing conditions.
- The more nickel, the lower the temperature: even in the model's assumptions, peak temperature falls from 825 to 775 to 700°C going from NMC622 to 811 to 955Sourced. Manthiram's review attributes the difficulty of making well-ordered LiNiO2 to Ni³⁺ being reduced to Ni²⁺ and some lithium volatilising during high-temperature synthesis at 700 to 800°CSourced. The model's assumption of 3% excess lithium likewise allows for loss by sublimation
- High nickel is a hard material to make: Li and co-authors say high-nickel oxides need modified co-precipitation, LiOH rather than Li2CO3 as the lithium source, longer multistep calcination under flowing O2, mandatory post-calcination surface treatment, and vacuum or N2 packaging, and that most equipment must resist corrosion (LiOH and O2) and have strict humidity controlSourced
- Single-crystal makes calcination the cost driver: in the model's assumptions, single-crystal material is calcined hotter, longer and in less densely packed saggars (to prevent agglomeration and ensure uniform reaction). As a result the single-crystal material is about US$2/kg (+8%) more expensive than polycrystalline, raising pack price by about US$3/kWh (assuming identical electrochemical properties)Sourced. If it can be used at a higher upper voltage (assumed 4.35 to 4.43 V for single-crystal against 4.25 V for polycrystalline), single-crystal could yield cheaper packsSourced
- Raw materials dominate: Li and co-authors give an example in which raw materials account for 75 to 90% of the total cost of commercial NCM, with cobalt a significant partSourced. In the Argonne model, battery materials are over 60% of the price, and cutting cobalt from NMC622 to NMC955 lowers the material price by US$0.85/kg (−3%)Sourced (model values)
The Argonne model says that 60,000 tonnes per year (60 kt) of NMC is enough for about 45 GWh of cells with graphite anodesSourced. 60,000 t ÷ 45 GWh = 60,000,000 kg ÷ 45,000,000 kWh = about 1.33 kg/kWhOur calculation. This is close to the about 1.35 kg/kWh we obtained in section 6 for NMC811 (about 200 mAh/g, 3.7 V average)Our calculation. Assumptions and limits: we did not confirm the composition, capacity and voltage the model adopted in the text of the source, so the agreement is only an order-of-magnitude check.
11. Where LFP, LMFP and spinel stand
- LFP: in 1997 Padhi and co-authors reported reversible lithium extraction and insertion in LiFePO4 (triphylite) at 3.5 V vs lithium, with a specific capacity then of 100 to 110 mAh/g, and called it a candidate for the cathode of a low-power rechargeable lithium batterySourced (at 0.05 mA/cm²). Manthiram's review says polyanion cathodes need small particles coated with conductive carbon, which often increases processing cost and introduces inconsistencies in performanceSourced. The IEA says LFP was over 55% of EV batteries in 2025 [Reference 3]Sourced
- LMFP: LiMn1−xFexPO4, with part of the iron replaced by manganese. The review by Sun and co-authors explains that Fe and Mn were combined in a certain ratio to compensate for LFP's slow electron and Li⁺ transportSourced [Reference 17]. Xiao and co-authors reported LMFP/C of about 60 nm particles with a 1 to 2 nm carbon coating (1.8 wt% carbon), in which LiMn0.75Fe0.25PO4/C gave the highest energy and power at low rates and LiMn0.5Fe0.5PO4/C may be the ideal option for practical large-scale applications; the Mn-rich composition (x = 0.25) delivered 157 mAh/g at 0.1CSourced [Reference 16]. IEA statistics include LMFP within the LFP categorySourced. Performance values of current mass-produced LMFP cells could not be confirmed in primary sources
- LMO: the review by Huang and co-authors calls LiMn2O4 cheap and environmentally friendly, with excellent rate performance from 3D Li⁺ diffusion channels, but says it degrades severely under extreme voltages and at high temperature. It distinguishes “good spinel” surface phases (such as LiNi0.5Mn1.5O4) from “bad spinel” ones (Mn3O4)Sourced [Reference 15]
- LNMO: high power at about 4.7 V and about 135 mAh/g, but heavy capacity fade in full cells with graphite has hindered commercialisation (section 5)Sourced [Reference 14]
12. Strengths and weaknesses; how this article divides work with others in the series
- Strengths: layered oxides have high capacity and wide room for design as nickel rises and cobalt falls. LFP is widening its uses through thermal stability, abundant iron and low costSourced
- Challenges: at high lithium utilisation, particle cracking, surface rock-salt formation, oxygen release and transition-metal dissolution chain together. Stabilisation tends to cost energy. Synthesis of high nickel demands strict control of lithium source, atmosphere and humiditySourced
- Pitfalls in reading: do not mix half-cell mAh/g with upper voltage and full-cell energy (sections 3 and 4). Do not read the model's assumed values as actual manufacturing conditions (section 10)
What this article does not cover
- Resources, sourcing and price: the resources and supply of cobalt, nickel, lithium and phosphorus are left to the “Battery Raw Materials and Supply Chains” article. The Co quantities here are conversions from composition and capacity, not a supply discussion
- Other components: graphite anodes (“Graphite Anodes and Electrode Design”), conductive additives and binders (the article of that name), electrolytes and separators (the article of that name), the SEI (“SEI”), electrode manufacturing (“Electrode Manufacturing”)
- All-solid-state batteries: cathodes for all-solid-state batteries (such as oxide coatings) are covered in a separate field, in articles such as the all-solid-state battery article on interfacial resistance
- What could not be confirmed: the latest product compositions, particle specifications and production volumes of individual companies; the current market share of single-crystal and gradient materials (the statements by Li and co-authors date from 2019); performance values of current mass-produced LMFP cells; and the commercial status of cathodes under development such as Li-rich and disordered rock-salt types. None of these is filled in by guesswork
- Three cathode families: layered, spinel and polyanion. All originate from Goodenough's groups, and the 2020 review calls them the only practical classesSourced
- Lithium utilisation is the trade: about 51% for LCO, about 73% for NMC811 and about 92% for LNMO (the ratio of reported values to theoretical capacity, under differing conditions)Our calculation
- Cobalt depends on composition and capacity: per kWh, about 1,160 g for LCO, about 344 g for NMC111 and about 82 g for NMC811 (a conversion with stated assumptions)Our calculation
- Degradation is four chained pathways: particle cracking, surface rock-salt formation, oxygen release and transition-metal dissolutionSourced
- Particle design: single-crystal resists cracking but needs hotter, longer calcination, about US$2/kg (+8%) more in the model's assumptionsSourced
- Market: in 2025 LFP was over 55% of EV batteries; outside China about 80% of EV batteries were nickel-based (IEA)Sourced
13. How to read evaluations and standards
Before comparing which number is larger, align the basis of comparison in the following order. This is an editorial reading checklist, not a set of test conditions or acceptance limits prescribed by a standard.
- 1. What was measured?
- reversible capacity, average voltage, retention and thermal behaviour. Check the units and whether the result describes a material, component or complete system.
- 2. Under which conditions?
- composition, upper cutoff voltage, electrode density, particle structure, temperature and electrolyte. Treat results under different conditions as separate results before comparing them.
- 3. The comparison trap
- Material mAh/g alone does not determine cell Wh/kg or safety.
- 4. What does the standard cover?
- Check the identifier, title, edition and scope in the issuing body’s material. Distinguish test methods, safety, interoperability and management requirements. Naming a standard alone does not establish that a test, conformity assessment or certification has been completed.
Keep a comparison note containing the object, units, conditions, sample count and variation, comparator, standard edition and unresolved points. Do not invent numerical conditions or acceptance limits from a public abstract of a standard.
14. Glossary
- Layered oxide
- A structure in which Li and transition metal alternate in layers of oxide. LCO, NMC, NCA.
- Spinel
- A cubic structure in which Li can move in three dimensions. LMO, LNMO.
- Polyanion (olivine)
- A structure with strongly bonded oxygen groups such as PO4. LFP, LMFP.
- NMC / NCM
- Lithium nickel manganese cobalt oxide. NMC811 means Ni:Mn:Co = 8:1:1.
- NCA
- Lithium nickel cobalt aluminum oxide.
- Lithium utilisation
- The fraction of theoretical capacity actually cycled (this article's usage).
- vs Li
- A potential referenced to lithium metal, used in half-cell measurements.
- Rock-salt phase
- An inactive surface layer in which the layered structure has collapsed and Li and transition metal are mixed.
- Li⁺/Ni²⁺ mixing
- A defect in which Ni²⁺ sits in the lithium layer. It worsens rate capability.
- Co-precipitation
- Precipitating several metal ions together to make uniform mixed-hydroxide particles.
- Precursor (PCAM)
- The metal hydroxide before calcination: a mixed Ni, Mn, Co hydroxide.
- Saggar
- A heat-resistant container that holds powder during calcination and travels continuously through the kiln.
- Single-crystal (monolithic) particle
- A micron-scale integral particle with few grain boundaries.
- Concentration gradient
- A design in which composition changes continuously from centre to surface of a particle.
- Half-cell / full cell
- A test cell with lithium metal as the counter electrode / a cell closer to practice using, for example, graphite.
15. References (primary sources)
- Manthiram "A reflection on lithium-ion battery cathode chemistry," Nature Communications 11, 1550 (2020) — doi.org/10.1038/s41467-020-15355-0
- Li, Erickson, Manthiram "High-nickel layered oxide cathodes for lithium-based automotive batteries," Nature Energy 5, 26–34 (2020) (text checked in the author manuscript posted on the U.S. Department of Energy's OSTI) — doi.org/10.1038/s41560-019-0513-0
- International Energy Agency (IEA) "Global EV Outlook 2026," chapter "Electric vehicle batteries," published 20 May 2026 — iea.org
- Padhi, Nanjundaswamy, Goodenough "Phospho-olivines as Positive-Electrode Materials for Rechargeable Lithium Batteries," Journal of The Electrochemical Society 144, 1188–1194 (1997) — doi.org/10.1149/1.1837571
- Jung et al. "Oxygen Release and Its Effect on the Cycling Stability of LiNixMnyCozO2 (NMC) Cathode Materials for Li-Ion Batteries," Journal of The Electrochemical Society 164, A1361–A1377 (2017) — doi.org/10.1149/2.0021707jes
- Sharifi-Asl, Lu, Amine, Shahbazian-Yassar "Oxygen Release Degradation in Li-Ion Battery Cathode Materials: Mechanisms and Mitigating Approaches," Advanced Energy Materials 9, 1900551 (2019) — doi.org/10.1002/aenm.201900551
- Yan et al. "Intragranular cracking as a critical barrier for high-voltage usage of layer-structured cathode for lithium-ion batteries," Nature Communications 8, 14101 (2017) — doi.org/10.1038/ncomms14101
- Zhan et al. "Mn(II) deposition on anodes and its effects on capacity fade in spinel lithium manganate–carbon systems," Nature Communications 4, 2437 (2013) — doi.org/10.1038/ncomms3437
- Lin et al. "Metal segregation in hierarchically structured cathode materials for high-energy lithium batteries," Nature Energy 1, 15004 (2016) — doi.org/10.1038/nenergy.2015.4
- Sun, Myung, Park, Prakash, Belharouak, Amine "High-energy cathode material for long-life and safe lithium batteries," Nature Materials 8, 320–324 (2009) — doi.org/10.1038/nmat2418
- Sun et al. "Nanostructured high-energy cathode materials for advanced lithium batteries," Nature Materials 11, 942–947 (2012) — doi.org/10.1038/nmat3435
- Knehr, Effat, Kubal, Su, Neu, Chacko, Gordon, Ahmed (Argonne National Laboratory and others) "A technoeconomic analysis of poly- and single-crystalline NMCxyz from material synthesis to battery pack design," Journal of Power Sources 677, 240032 (2026) (text checked in the OSTI version) — doi.org/10.1016/j.jpowsour.2026.240032
- Li, Lee, Manthiram "High-Nickel NMA: A Cobalt-Free Alternative to NMC and NCA Cathodes for Lithium-Ion Batteries," Advanced Materials 32, 2002718 (2020) — doi.org/10.1002/adma.202002718
- Manthiram, Chemelewski, Lee "A perspective on the high-voltage LiMn1.5Ni0.5O4 spinel cathode for lithium-ion batteries," Energy & Environmental Science 7, 1339 (2014) — doi.org/10.1039/c3ee42981d
- Huang, Dong, Li, Lee "Lithium Manganese Spinel Cathodes for Lithium-Ion Batteries," Advanced Energy Materials 11, 2000997 (2021) — doi.org/10.1002/aenm.202000997
- Xiao, Ding, Lai, Lu "High Performance LiMn1−xFexPO4 (0 ≤ x ≤ 1) Synthesized via a Facile Polymer-Assisted Mechanical Activation," Journal of The Electrochemical Society 160, A918–A926 (2013) — doi.org/10.1149/2.116306jes
- Sun, Luo, Du, Wei "Research progress of lithium manganese iron phosphate cathode materials: From preparation to modification," Electroanalysis 36, e202400120 (2024) — doi.org/10.1002/elan.202400120
- Ge, Wi, Liu, Bai et al. "Kinetic Limitations in Single-Crystal High-Nickel Cathodes," Angewandte Chemie International Edition 60, 17350–17355 (2021) — doi.org/10.1002/anie.202012773
- Jiang, Danilov, Eichel, Notten "A Review of Degradation Mechanisms and Recent Achievements for Ni-Rich Cathode-Based Li-Ion Batteries," Advanced Energy Materials 11, 2103005 (2021) — doi.org/10.1002/aenm.202103005
16. Claim-to-source audit
| Claim in the text | Basis | Label |
|---|---|---|
| That the layered, spinel and polyanion families originate from Goodenough's groups and that the 2020 review calls them the only practical classes; that layered and polyanion families also underlie sodium-ion cathodes; LCO's structure (O3, two-dimensional Li diffusion within layers), about 4 V, oxygen release above 50% charge from Co³⁺/⁴⁺ overlapping the O 2p band and practical capacity of about 140 mAh/g; that Ni³⁺/⁴⁺ barely touches the top of the O 2p band so Ni can reach Ni⁴⁺; that Mn⁴⁺ is a structural stabiliser; spinel LMO's Li diffusion (three-dimensional via empty octahedral sites), about 4 V, under 130 mAh/g, and Mn dissolution; that polyanions bind oxygen strongly, have high thermal stability, low electronic conductivity needing small carbon-coated particles, low density, and abundant iron; that LiNiO2 is hard to make well ordered because Ni³⁺ is reduced to Ni²⁺ and some Li volatilises at 700 to 800°C; that in high nickel Ni⁴⁺ reacts with the electrolyte forming thick SEI and Ni/Mn dissolution, with dissolved metals depositing on graphite and catalysing electrolyte decomposition; that Al doping suppresses dissolution; that volume change on phase transition produces a chain of cracks, new surfaces, higher reactivity, dissolution and SEI growth that is pronounced beyond 500 cycles; and cycle, thermal and air instability of high nickel | Manthiram 2020 reviewReference 1 https://doi.org/10.1038/s41467-020-15355-0 | Sourced |
| That the cathode is normally the largest component by weight and cost and a main bottleneck; the estimate that 800 Wh/kg or more from the cathode active material (about 210 to 215 mAh/g at 3.7 to 3.8 V vs Li) is needed for 350 Wh/kg at cell level; about 200 mAh/g for NMC811 and NCA80, about 160 mAh/g for NMC111 and 240 to 250 mAh/g for LNO at 4.3 V vs Li; the progression NMC111 to 523 to 622 to 811 and NCA's modest rise from about 250 Wh/kg (2009, cell); singlet oxygen evolution, transition-metal dissolution, rock-salt formation and anisotropic lattice distortion at large Li utilisation; the “ultrahigh voltage” route's advantages and its electrolyte and cobalt issues; the roles of Co, Mn and Al (Li⁺/Ni²⁺ mixing, residual lithium, 5% Al, 20% or more Mn) and their limits; NCM at 80 to 200 g Co/kWh and 500 to 650 g Ni/kWh, NCM-811 at 80 to 100 g Co/kWh, Panasonic's NCA under 50 g Co/kWh in Tesla Model 3, no expert agreement on high-Ni low-Co NCM versus NCA, and the 2019 NCM-811 mass-produced vehicle (statements as of 2019); the marketing remark; reasons for the small share of concentration-gradient NCM; electrode density (3.0 to 3.4 versus 3.8 to 4.2 g/cm³ for LCO) and the effects of densifying; standard co-precipitated polycrystalline secondary particles (hundreds of primary particles), primary-particle tuning, single-crystal synthesis (3 to 5 µm precursors, 950°C or more, or flux); high-nickel synthesis requirements (LiOH, multistep calcination under flowing O2, surface treatment, nitrogen packaging, corrosion-resistant equipment, humidity control) and raw materials at 75 to 90% of cost; surface treatments (dry, water-based, organic solvent, CVD, ALD), primary-particle-level coating, trace dopants, the energy penalty of stabilisation; residual lithium compounds and gassing; that the degree of lithium utilisation is often the deciding parameter; and that the text is an author manuscript from 2019 | Perspective by Li, Erickson and Manthiram 2020 (author manuscript on OSTI)Reference 2 https://doi.org/10.1038/s41560-019-0513-0 | Sourced |
| That the cathode active material is 40 to 50% of cell production cost for NMC and 25 to 30% for LFP; that LFP was over 55% of global EV batteries deployed in 2025 (nearly 50% in 2024); that almost 80% of EV batteries deployed outside China were nickel-based; that LMFP is included in the LFP category; the concentration of LFP in China and emerging economies; and the publication date of 20 May 2026 | IEA Global EV Outlook 2026Reference 3 https://www.iea.org/reports/global-ev-outlook-2026/electric-vehicle-batteries | Sourced |
| That reversible lithium extraction and insertion in LiFePO4 occurs at 3.5 V vs lithium (0.05 mA/cm²) with a specific capacity of 100 to 110 mAh/g, and was called a candidate for a low-power rechargeable lithium battery (1997) | Padhi et al. 1997, abstractReference 4 https://doi.org/10.1149/1.1837571 | Sourced |
| That in full cells with graphite, stable cycling was possible up to 4.4 V for NMC111 and NMC622 and only up to 4.0 V for NMC811; that NMC811's high-voltage feature at about 4.3 V vs Li corresponds to the H2 to H3 transition; and that CO2 and CO are believed to come mainly from lattice oxygen reacting chemically with the electrolyte | Jung et al. 2017, abstractReference 5 https://doi.org/10.1149/2.0021707jes | Sourced |
| That oxygen release is a major structural degradation causing capacity and voltage fade and triggering thermal runaway, treated across layered, spinel, olivine and Li-rich cathodes | Sharifi-Asl et al. 2019, review abstractReference 6 https://doi.org/10.1002/aenm.201900551 | Sourced |
| That in a commercial NMC111, intragranular cracks are tied to high-voltage cycling and initiate from the grain interior by a dislocation-based mechanism, as observed by scanning transmission electron microscopy | Yan et al. 2017, abstractReference 7 https://doi.org/10.1038/ncomms14101 | Sourced |
| That in spinel LMO and carbon cells the Mn deposited on the anode is +2, deposited by metathesis with SEI species, and that the amount rises with cycling and correlates with anode impedance and capacity fade | Zhan et al. 2013, abstractReference 8 https://doi.org/10.1038/ncomms3437 | Sourced |
| That surface reconstruction from layered to rock-salt is commonly seen, particularly in Ni-rich compositions, and impairs high-voltage cycling; and that spray-pyrolysis LiNi0.4Mn0.4Co0.2O2 particles with Ni-poor, Mn-rich surfaces resisted reconstruction | Lin et al. 2016, abstractReference 9 https://doi.org/10.1038/nenergy.2015.4 | Sourced |
| A concentration-gradient cathode (Ni-rich centre, Ni falling and Mn and Co rising outward) giving 209 mAh/g in a half cell, 96% retention after 50 cycles at 55°C and 3.0 to 4.4 V, and better thermal-abuse results than the reference Li[Ni0.8Co0.1Mn0.1]O2 | Sun et al. 2009, abstractReference 10 https://doi.org/10.1038/nmat2418 | Sourced |
| A full-gradient material in which Ni falls linearly and Mn rises linearly giving 215 mAh/g, with secondary particles of aligned needle-like nanosize primary particles | Sun et al. 2012, abstractReference 11 https://doi.org/10.1038/nmat3435 | Sourced |
| The model's assumptions for NMC synthesis (co-precipitation of sulfates with NaOH and NH3 under N2 at 95°C and pH 11 to 11.5; mixing with lithium hydroxide monohydrate at 3% excess lithium; roller hearth kiln in oxygen with peak 700 to 925°C; deagglomeration, washing and coating assumed as Al2O3; a second calcination at 700°C for 2 hours; 95% NH3 recovery); the temperatures and soak times by composition and by polycrystalline or single-crystal in Table 7, the ramps and the saggar loads; that 60 kt/year corresponds to about 45 GWh; that single-crystal costs about US$2/kg (+8%) more and raises pack price by about US$3/kWh, and could give cheaper packs at an upper voltage of 4.35 to 4.43 V (single-crystal) versus 4.25 V (polycrystalline); that NMC622 to NMC955 lowers material price by US$0.85/kg (−3%) and battery materials are over 60% of price; and that morphology-setting conditions are typically proprietary | Knehr et al. 2026 (OSTI version). Model assumptions, not the conditions of any real manufacturerReference 12 https://doi.org/10.1016/j.jpowsour.2026.240032 | Sourced |
| That NMA with 89 mol% Ni has a slightly lower specific capacity than NMC and NCA of the same Ni content but about 40 mV higher voltage and no compromise in rate capability, outperforms NMC and NCA in graphite pouch cells after 1,000 deep cycles, only slightly trails Al–Mg co-doped NMC and a commercial cathode, and has better thermal stability | Li, Lee and Manthiram 2020, abstractReference 13 https://doi.org/10.1002/adma.202002718 | Sourced |
| That LNMO offers about 4.7 V and about 135 mAh/g, fades badly in graphite full cells particularly at high temperature, and that the cause is metal dissolution at 4.7 V and lithium consumption by SEI growth promoted by Mn and Ni deposition | Manthiram, Chemelewski and Lee 2014, abstractReference 14 https://doi.org/10.1039/c3ee42981d | Sourced |
| That LiMn2O4 is cheap and environmentally friendly with excellent rate performance from 3D Li⁺ channels but degrades severely at extreme voltages and high temperature; and the distinction of “good spinel” (LiNi0.5Mn1.5O4 and similar) and “bad spinel” (Mn3O4) surface phases | Huang et al. 2020, review abstractReference 15 https://doi.org/10.1002/aenm.202000997 | Sourced |
| LMFP/C of about 60 nm particles with a 1 to 2 nm carbon coating (1.8 wt%); that the Mn-rich composition (x = 0.25) gave 157 mAh/g at 0.1C; that LiMn0.75Fe0.25PO4/C gave the highest energy and power at low rates and LiMn0.5Fe0.5PO4/C may be ideal for large-scale applications | Xiao et al. 2013, abstractReference 16 https://doi.org/10.1149/2.116306jes | Sourced |
| That LFP has a capacity of around 170 mAh/g and that LMFP combining Fe and Mn was made to compensate for slow electron and Li transport | Sun et al. 2024, review abstractReference 17 https://doi.org/10.1002/elan.202400120 | Sourced |
| That in single-crystal LiNi0.8Mn0.1Co0.1O2 redox is sluggish at low state of charge, governed by ionic transport, and may be alleviated by combining with polycrystals | Ge et al. 2021, abstractReference 18 https://doi.org/10.1002/anie.202012773 | Sourced |
| That degradation in batteries with high-nickel cathodes spans cathode, anode and electrolyte and that stabilisation strategies for each are reviewed | Jiang et al. 2021, review abstractReference 19 https://doi.org/10.1002/aenm.202103005 | Sourced |
| The molar masses and theoretical capacities (LCO about 274, NMC111 about 278, NMC811 about 276, NCA80 about 279, LNO about 275, LMO about 148, LNMO about 147, LFP about 170 mAh/g) and utilisation; cobalt per kWh (LCO about 1,160 g, NMC111 about 344 g, NCA80 about 124 g, NMC811 about 82 g); and 60 kt ÷ 45 GWh = about 1.33 kg/kWh | Our calculation. The Faraday constant of 96,485 C/mol, the atomic weights, the practical capacities (half-cell values from the review and perspective), the 3.7 V average voltage and the Co mass fractions are all assumptions made in this article. Cell design and capacity loss from degradation are not included. NCA80 is not the same composition as the “under 50 g Co/kWh” NCA in the perspective. Utilisation is a ratio of values under differing conditions and does not rank materials | Our calculation |
| The latest product compositions, particle specifications and production volumes of individual companies; the current market share of single-crystal and gradient materials; performance values of current mass-produced LMFP cells; the commercial status of cathodes under development such as Li-rich and disordered rock-salt types | Not stated in the primary sources opened for this article, so not given (the gradient material's share is only a 2019 statement) | Not yet confirmed |
| The reading that utilisation trades capacity against life; that capacity figures need the upper voltage and half-cell or full-cell status; the grouping into four degradation pathways; the chain of cracking, oxygen and dissolution and the need to lay evaluations side by side (an Inference); the four-way grouping of particle designs; the reading of calcination as a design of lithium, atmosphere and loading; and the summary of strengths and challenges | Our summary and commentary based on published content, and an Inference. Not views stated by any company or institution | Commentary |
| That Figs. 1, 2, 3, 4, 5 and 7 are explanatory drawings rather than real observations, design drawings or process diagrams, and that Fig. 6 and the hero image are AI-generated images | Our note | Commentary |
Last updated 10 October 2026. Sources are limited to primary material (abstracts and bibliographic records of peer-reviewed papers, the full text of open-access reviews and perspectives, an Argonne National Laboratory technoeconomic analysis and IEA reports). Because the article includes structural readings and materials-design interpretations, those are marked as Commentary and kept separate from sourced fact. The latest product compositions, particle specifications and production volumes of individual companies, the current market share of single-crystal and gradient materials, and performance values of current mass-produced LMFP cells are not stated here because no published primary source could be confirmed. Paper values are from abstracts or reviews, and conditions (half-cell or full cell, upper voltage, temperature) differ from paper to paper. The synthesis conditions from Argonne National Laboratory are model assumptions, not the conditions of any real manufacturer. Statements by Li and co-authors (cobalt quantities, the share of gradient materials and so on) date from 2019. All figures are explanatory concept graphics. Figs. 1, 2, 3, 4, 5 and 7 are vector drawings; Fig. 6 and the hero image are AI-generated images, and none of them shows a real cross-section, micrograph or physical product.