TECHNOLOGY EXPLAINER
Lithium-Ion Battery Fundamentals
— six cell components, and how to read the denominator of “Wh/kg”
A lithium-ion battery (LIB) is a battery in which lithium ions are moved in and out of two electrodes. As the entry point to this next-generation energy storage series, this article sets out the cell structure (cathode, anode, electrolyte, separator, current collectors, casing), the operating principle (intercalation), how voltage, capacity and energy relate, the common material pairings (LFP, NMC, NCA and LCO with graphite), and the cell formats. In particular, it checks against official datasheets and peer-reviewed papers that the same “Wh/kg” means something different for active materials, cells and packs. Individual materials are left to other articles in the series. Nothing here is investment, procurement or design advice.
Sources: original studies, a research-laboratory model report, manufacturer specifications and announcements, and official IEA and Nobel Prize publications. Measured results, calculations and illustrative assumptions are distinguished. Updated 17 October 2026.
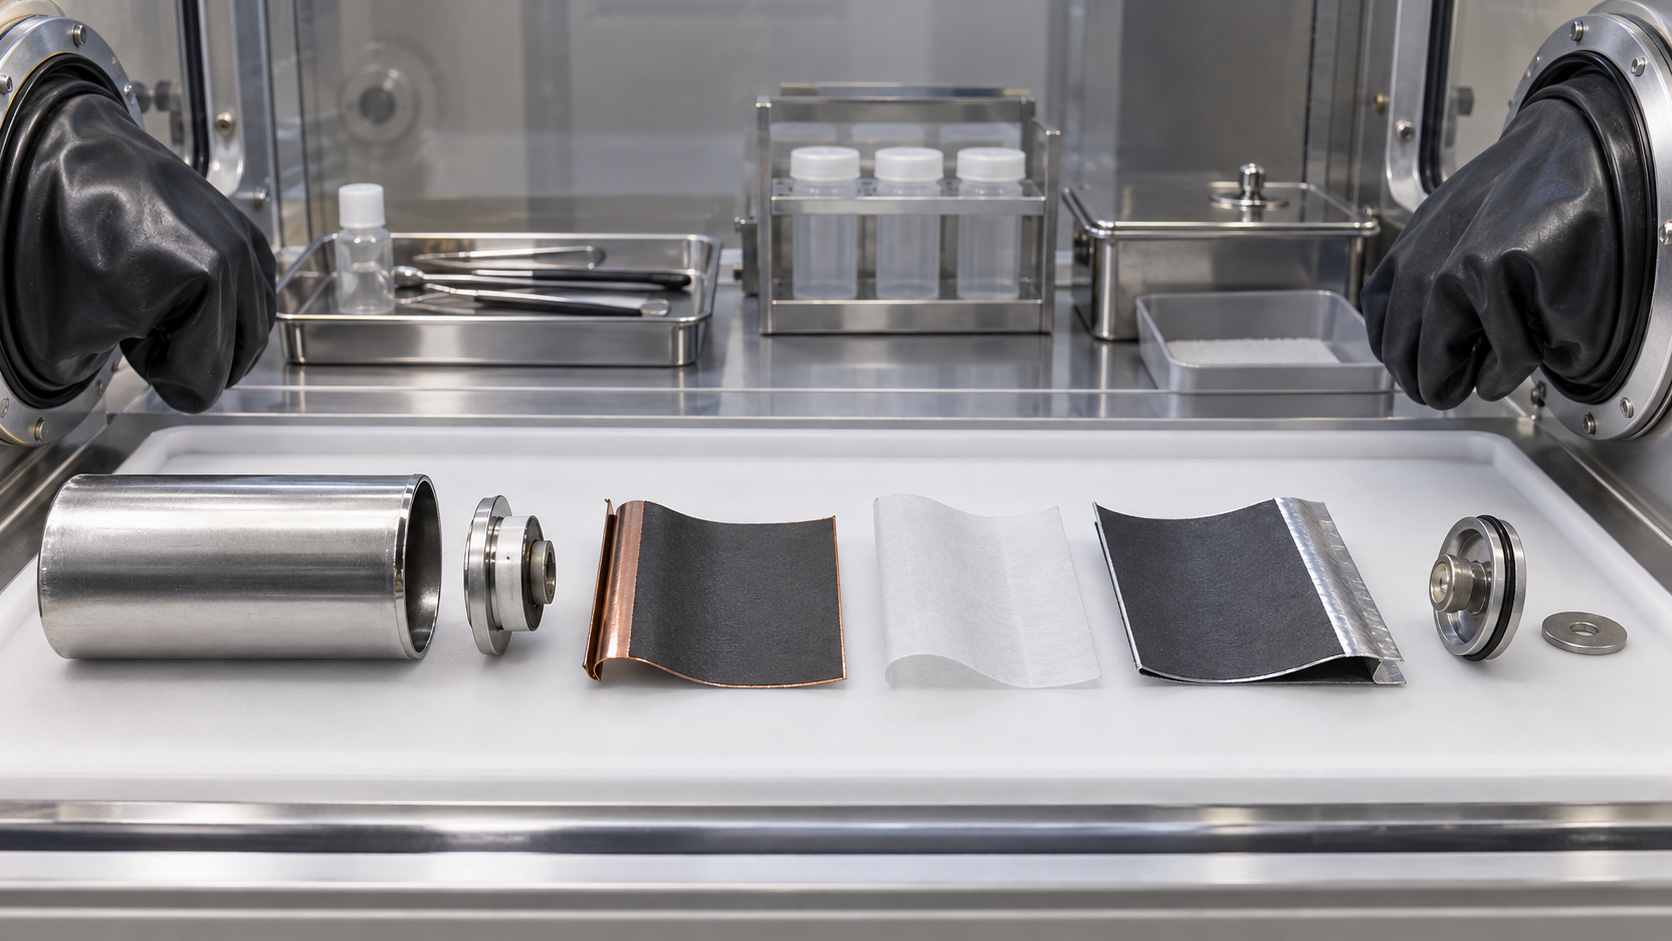
- What a lithium-ion battery is (the short version)
- The backbone of the history — the idea of an electrode that takes lithium in and out
- Inside the cell — six components
- What happens on charge and discharge — intercalation
- Our calculation: getting energy from voltage and capacity
- A materials engineer's view (1): a cell is coated film, stacked
- Material pairings — LCO, NMC, NCA, LMO and LFP with graphite
- How to read the numbers — active material, cell, pack
- A materials engineer's view (2): check the denominator of “Wh/kg” three times
- Cell formats — cylindrical, prismatic, pouch
- Strengths and weaknesses; how this article divides work with others in the series
- How to read evaluations and standards
- Glossary
- References (primary sources)
- Claim-to-source audit
Sourced = content stated in published material (link given)
Our calculation = a figure this article derived, with the assumptions spelled out
Not yet confirmed = a plan or target with no confirmed track record
Structural readings and materials-design interpretations are marked separately as Commentary. An Inference is shown in bold.
Manufacturer figures are “manufacturer's stated value”, and where the test conditions cannot be confirmed from public material, the text says so.
Every battery figure is accompanied by whether it is a value for the material, the cell or the pack.
1. What a lithium-ion battery is (the short version)
A lithium-ion battery is a battery in which lithium ions travel back and forth between the cathode and the anode. The official announcement of the 2019 Nobel Prize in Chemistry describes the advantage as being based not on chemical reactions that break down the electrodes, but on lithium ions flowing back and forth between the anode and the cathodeSourced.
- What is being stored: on charging, lithium leaves the crystal of the cathode and enters between the layers of the anode (usually graphite). On discharge the reverse happens. The electrode framework stays in place; only lithium moves in and outSourced
- Voltage and electrolyte: voltage is the potential difference between the electrodes. The electrolyte and interfaces must work at those electrode potentials. We do not assign all aqueous batteries a universal 1.5 V ceiling. At the same charge, a higher mean discharge voltage gives more energy (our explanation).
- What to evaluate: separate safety, capacity, power, life, efficiency and cost. This is our reading checklist, not the acceptance criteria of a test standard. Follow the individual articles for material-specific and safety details.
“Energy density” becomes a different number depending on what you divide by. For the same cylindrical cell, the datasheet's energy density (248 Wh/kg) can be reproduced from the rated capacity and maximum mass, while a calculation from the typical capacity gives about 259 Wh/kgOur calculation. And once cells are built into an EV pack, studies report about 0.55 to 0.58 times the cell value per unit mass and about 0.3 to 0.35 times per unit volumeSourced. Compare material, cell and pack values side by side and you will judge wrongly.
2. The backbone of the history — the idea of an electrode that takes lithium in and out
The Nobel Prize in Chemistry 2019 announcement says the foundation of the lithium-ion battery was laid during the oil crisis of the 1970sSourced. The story can be grouped into four milestones (our grouping).
Reading the announcement again from the materials sideSourced:
- Whittingham: titanium disulphide (TiS2) has spaces at the molecular level that can house lithium ions (intercalation). A battery with an anode made partly of metallic lithium reached just over two volts, but metallic lithium is so reactive that the cell was not viable
- Goodenough: he predicted that a metal oxide instead of a metal sulphide would give the cathode a higher potential, and in 1980 showed that cobalt oxide with intercalated lithium ions can produce as much as four volts
- Yoshino: building on Goodenough's cathode, he replaced the reactive metallic lithium in the anode with a carbon material (petroleum coke) that can likewise intercalate lithium ions, and in 1985 made the first commercially viable lithium-ion battery
Three entry points are Mizushima et al.’s lithium extraction from layered LiCoO2 (1980) [Ref. 3], Thackeray et al.’s insertion and structure study of spinel LiMn2O4 (1983) [Ref. 8], and Padhi et al.’s LiFePO4 study (1997) [Ref. 4]. Keep the materials and conditions of each original study separate rather than inferring all cathode performance from one historical lineage.
3. Inside the cell — six components
The smallest unit of a lithium-ion battery is the cell. The Argonne National Laboratory cost and performance model report (BatPaC, second edition, 2012) describes the cell as followsSourced.
Each electrode consists of current-collector foil coated with electrode material on both sides. An electrode is made of active-material particles held together by a polymeric binder, and a conductive additive, carbon black and/or graphite, is added to the positive electrode and sometimes to the negative. The electrodes and the separator have porosity that is filled with the electrolyte solution. During discharge, lithium ions move from the electrode particles into the electrolyte, across the separator, and into the particles of the opposite electrode. Electrons simultaneously leave the cell through the current-collection system and re-enter on the opposite side.
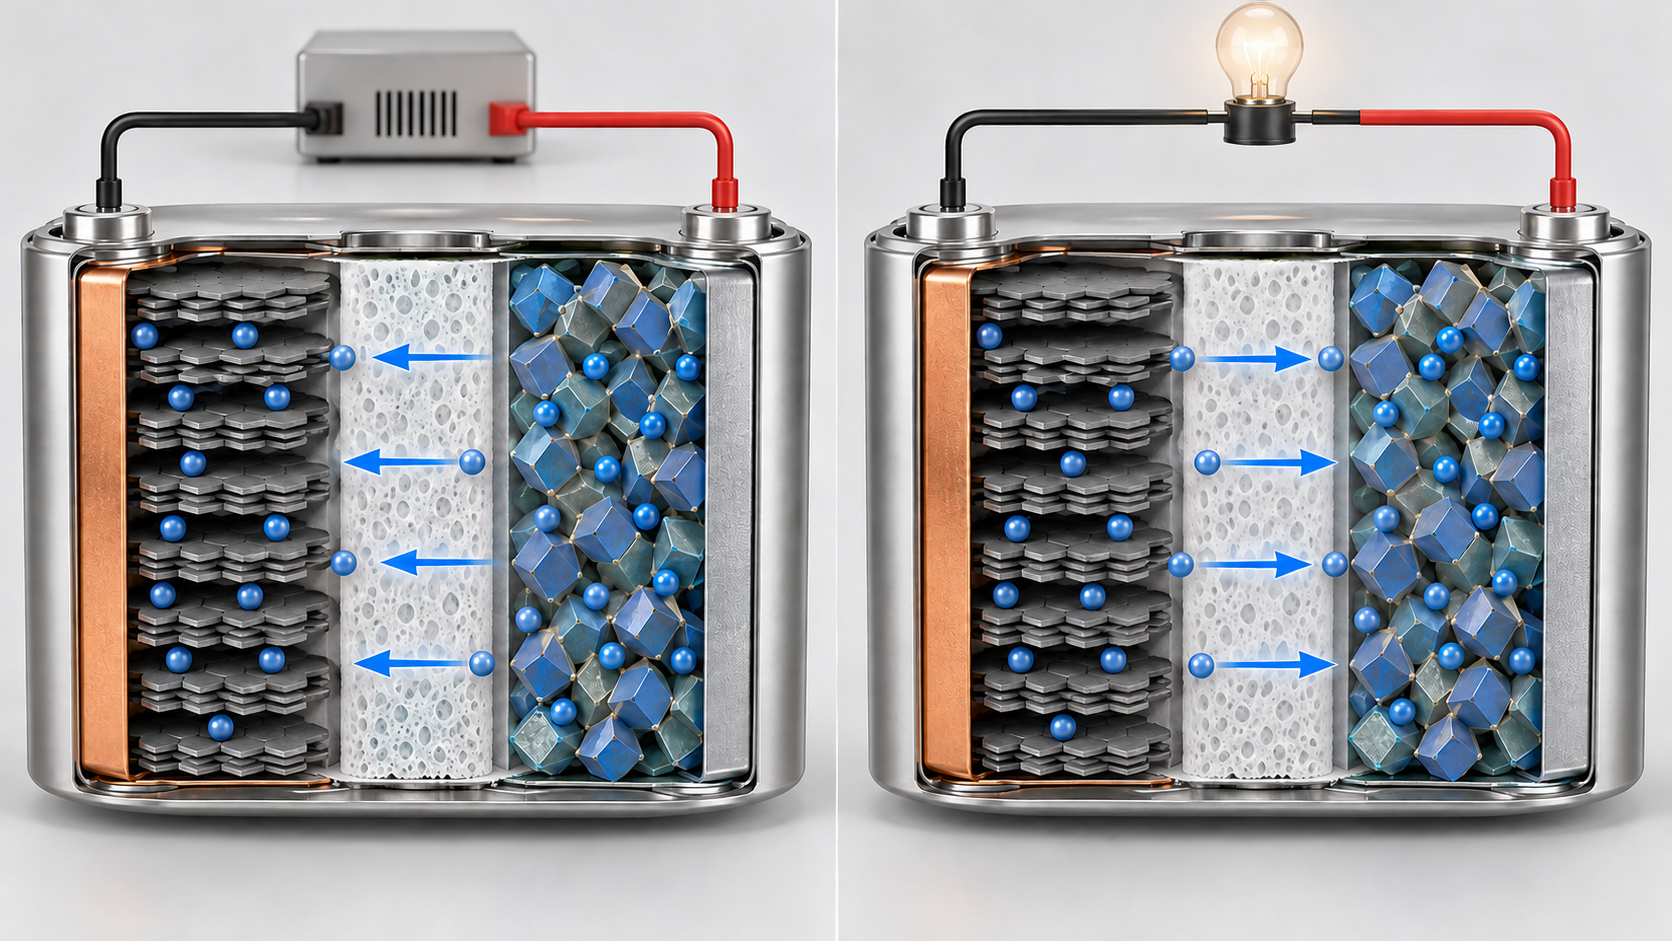
View the original SVG schematic and exact annotations
A cell is made of six components. Their typical materials and roles are summarised below.
| Component | Typical materials | Role | Reference |
|---|---|---|---|
| Cathode | Active materials such as LiCoO2, NMC, NCA, LiMn2O4 or LiFePO4, plus conductive additive and binder | Takes in lithium ions on discharge and releases them on charge. Sets much of the cell voltage and energy density | [Refs. 3, 9] |
| Anode | Graphite is the example here | Accepts lithium on charge and releases it on discharge. Graphite phase changes were measured in Li/graphite cells. | [Ref. 7, 9] |
| Electrolyte | BatPaC example: LiPF6 in carbonate solvents | Provides ionic transport. This is a model material choice, not the formulation of every product. | [Ref. 9] |
| Separator | BatPaC example: porous PP, sometimes with a PE layer | Separates electrodes electrically while electrolyte-filled pores provide ionic transport. | [Ref. 9] |
| Current collectors | Aluminium foil on the cathode, copper foil on the anode (BatPaC assumes 20 µm and 12 µm thick) | Collect electrons between the electrodes and the external circuit | [Ref. 9] |
| Casing | A metal can (typical for cylindrical and prismatic cells), or an aluminium-foil laminate between polymer layers (pouch: PET outer layer, aluminium middle layer, PP inner layer) | Seals the contents and protects them from air and moisture | [Refs. 9, 12] |
The component description mainly follows the BatPaC model report [Ref. 9]. Its material choices and thicknesses are model inputs, not specifications of all commercial cells.
BatPaC models a LiPF6/carbonate electrolyte and a porous PP separator, sometimes including a PE middle layer [Ref. 9]. Our interpretation is that separation and ionic pathways must be designed together. This is not a product formulation or a guaranteed safe operating temperature.
4. What happens on charge and discharge — intercalation
Here, intercalation means lithium entering and leaving a host structure. Mizushima et al. studied extraction from LiCoO2 [Ref. 3], and Dahn studied graphite staging [Ref. 7]. The following equations combine these ideas conceptually; they are not the operating range of a particular product.
Cathode: LiCoO2 ⇌ Li1−xCoO2 + x Li⁺ + x e⁻
Anode: 6 C + x Li⁺ + x e⁻ ⇌ LixC6
Left to right is charging and right to left is discharging. Electrons travel through the external circuit and lithium ions through the electrolyte.
The graphite side takes a “stage” structure, with lithium entering between the layers. Dahn used lithium/graphite cells and in situ X-ray diffraction to determine the phase diagram of LixC6 (0 ≤ x ≤ 1) and reported that as x increases the material passes through a dilute stage-1 phase, stage 4, stage 3, stage 2 (including a “liquid-like” 2L phase) and finally filled stage 1Sourced. Graphite is covered in more detail in the “Graphite Anodes and Electrode Design” article in this series.
Usable capacity must be read with composition, voltage range, current, temperature and acceptable degradation. We no longer describe 140 mAh/g as a universal LiCoO2 ceiling. The next section assumes 140 mAh/g solely to teach denominator effects; it is neither an original-paper measurement nor a universal safety limit.
Fong et al. (1990) studied irreversible interfacial reactions in carbon/Li-metal half-cells with a PC/EC electrolyte [Ref. 2]. They reported electrolyte decomposition during initial lithiation and a surface film that suppressed further decomposition. Their half-cell “discharge” must not be read as the discharge of a complete commercial cell. See the SEI article for more detail.
5. Our calculation: getting energy from voltage and capacity
Discharge energy is E = ∫V dq. Using the mean discharge voltage gives mean voltage × capacity; using nominal voltage is an approximation. The example below is our calculation to align capacity denominators, not a measurement of electrode potentials or discharge curves.
Theoretical capacity comes from dividing the Faraday constant (96,485 C/mol = 26,801 mAh/mol) by the molar mass of the active material per lithiumOur calculation.
- LiCoO2: molar mass 6.94 + 58.93 + 2 × 16.00 = 97.87 g/mol. 26,801 ÷ 97.87 = about 274 mAh/g (if all the lithium were used)
- Illustrative assumption: assign the cathode 140 mAh/g, about 51% of theoretical 274 mAh/g. This ratio is not a measured lithium-utilisation result.
- Graphite (LiC6): molar mass 6 × 12.011 ≈ 72.07 g/mol. 26,801 ÷ 72.07 = about 372 mAh/g
- Both electrodes combined: add the masses of the two active materials. 1 ÷ (1/140 + 1/372) = about 102 mAh/g (per total mass of the two active materials)
- Energy: taking a nominal voltage of 3.6 V (the value on the cell datasheet used later), 102 mAh/g × 3.6 V = about 366 Wh/kg (per total mass of the two active materials)
Assumptions and limits: 140 mAh/g is assumed, graphite’s 372 mAh/g is theoretical, and 3.6 V is borrowed from the later datasheet for approximation. Electrode capacities are exactly balanced; side reactions and reserve capacity are ignored. This combination is not verified as a real cell. About 366 Wh/kg uses active-material mass only, excluding foils, electrolyte, separator and casing. It is not cell or pack performance.
6. A materials engineer's view (1): a cell is coated film, stacked
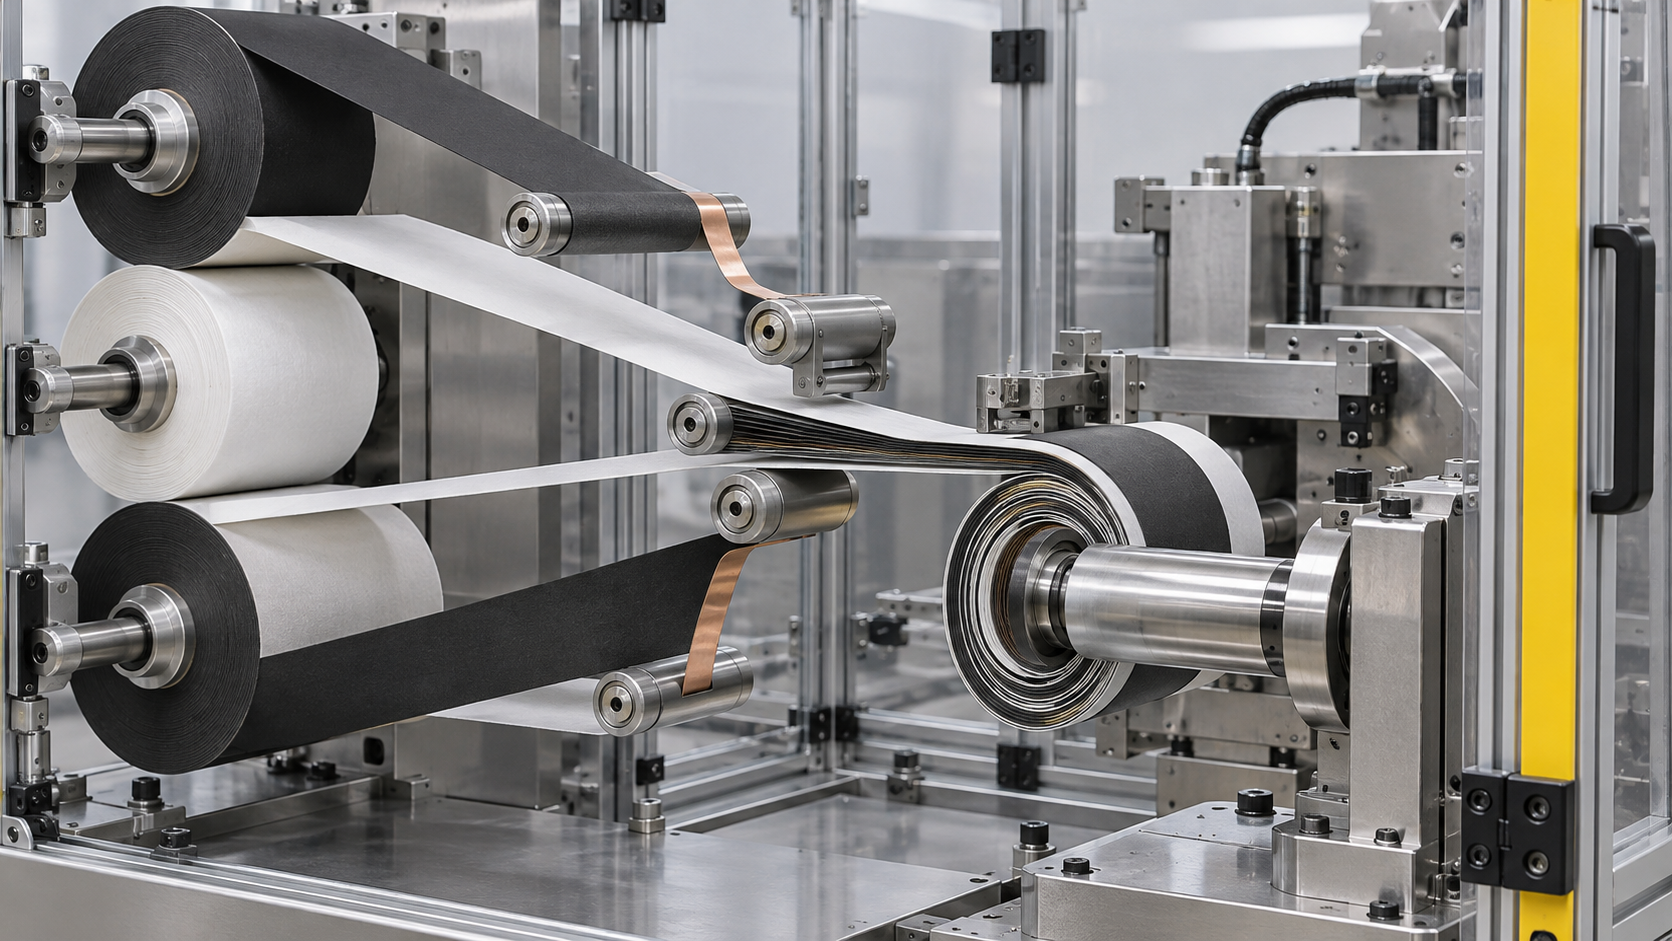
Reading the BatPaC description from the materials side: an electrode is a composite of active-material particles, a polymeric binder, a conductive additive and pores filled with electrolyte, coated on both sides of a metal foil, 12 µm (copper) or 20 µm (aluminium) thickSourced (foil thicknesses are BatPaC's assumptions). A cell's performance is set not only by the crystal properties of the active material but by this composite's composition, thickness, porosity and adhesion.
- The manufacturing flow: in BatPaC's baseline plant, active material, carbon, binder and solvent are mixed in tanks, coated and dried. The positive-electrode binder solvent is assumed to be NMP (N-methyl-2-pyrrolidone), recovered by condensation and recycled, while the negative-electrode binder solvent is water, which need not be recoveredSourced
- Parts that inflate the denominator: a cell's mass and cost include not only active material but foils, separator, electrolyte and casing. BatPaC splits its cost breakdown into active materials, carbon and binders, current collectors, separator, electrolyte, cell hardware and so onSourced. If the non-active mass stays the same, improving the active material improves the whole cell by less (Commentary)
- Many interfaces: particle to binder, particle to foil, particle to electrolyte, foil to external terminal. If any one contact weakens, it shows up as resistance or delamination (Commentary). Conductive additives and binders are covered in the “Conductive Additives and Binders” article, electrode thickness and porosity in “Graphite Anodes and Electrode Design”, and coating, drying and calendering in “Electrode Manufacturing”
7. Material pairings — LCO, NMC, NCA, LMO and LFP with graphite
The following are material examples. Graphite is an illustrative anode, not the anode of every battery. Keep each original study’s material, voltage and current conditions separate; results under different conditions do not form a performance ranking.
| Cathode | Example composition | Voltage and capacity examples (conditions) | Features and challenges | Reference |
|---|---|---|---|---|
| LCO | Layered LiCoO2 | Original study: Li extraction and voltage–composition curves | The 1980 experiment reported electrochemical extraction. We do not treat 140 mAh/g as a universal ceiling. | [Ref. 3] |
| NMC | NMC111 and related compositions | NMC111: about 150 mAh/g at 3.5–4.2 V vs Li (2001 original abstract) | Match Ni fraction and voltage range. Read oxygen release and degradation within the individual conditions of the 2017 study. | [Ref. 5, 6] |
| NCA | Written as Li[Ni0.8Co0.15Al0.05]O2 and similar | No figure taken here (a conditioned value could not be confirmed in primary sources) | The IEA groups NCA with NMC622 and NMC811 as mid- and high-nickel | [Refs. 12, 15] |
| LMO | Spinel LiMn2O4 | Original study: room-temperature insertion and X-ray diffraction | The 1983 study examined the insertion framework. Its abstract does not establish a capacity ceiling for modern 4 V cells. | [Ref. 8] |
| LFP | Olivine LiFePO4 | About 3.5 V vs Li, 100–110 mAh/g (1997; 0.05 mA/cm²) | An early original-study result, not the capacity or safety rating of later products. | [Ref. 4] |
All Sourced (statements in each reference). Values obtained under different conditions are placed side by side, so this is not a ranking of materials. LFP's 100 to 110 mAh/g is the 1997 first-report value, not that of later improved products.
On the market side, the IEA's Global EV Outlook 2026 (published 20 May 2026) says that LFP accounted for over 55% of EV batteries deployed globally in 2025, up from nearly 50% in 2024Sourced. The 2025 edition adds that LFP packs have about one-fifth lower energy density by mass and about one-third lower by volume than NMC packs, partly offset by LFP's ability to reach 100% state of charge without significant degradation, whereas NMC batteries are typically limited to 80% to preserve long-term performanceSourced. So the right reading is not “one is better” but that the chemistries are chosen by use (range, cold climate, cost). The inside of each material is covered in the “Cathode Materials” article in this series.
8. How to read the numbers — active material, cell, pack
Energy density (Wh/kg, Wh/L) falls into three levels depending on what goes into the denominator. Even the same “Wh/kg” cannot be compared across levels.
| Level | What is in the denominator | Where the value appears | Caution |
|---|---|---|---|
| Active material (the material) | The mass of the active material only | Theoretical capacity; half-cell mAh/g | In a cell, foils, separator, electrolyte, casing, conductive additive and binder are added and the value falls |
| Cell | One cell including electrodes, separator, electrolyte, current collectors and casing | Manufacturer cell datasheets | Check which capacity (rated or typical) and which dimensions and mass (can only, or with tube) were used |
| Pack | Cells plus module frames, cooling, battery management, wiring and enclosure | Published values for a vehicle's battery system; research comparisons | Always smaller than the cell. Löbberding et al. examined the drop from cell to system across 25 EVs |
We reproduce the energy density from the figures on the Panasonic Energy NCR18650BF datasheetOur calculation.
- What the datasheet says: nominal voltage 3.6 V; rated capacity 3,200 mAh (at 20°C); capacity minimum 3,250 mAh and typical 3,350 mAh (at 25°C); mass at most 46.5 g (without tube); maximum dimensions 18.24 mm diameter by 65.10 mm heightSourced (manufacturer's stated value). Energy density is given as 248 Wh/kg and 677 Wh/L, with a note that it is calculated using bare cell dimensions without the tubeSourced
- Using the rated capacity: 3.6 V × 3.2 Ah = 11.52 Wh. 11.52 ÷ 0.0465 kg = about 248 Wh/kg (matches the datasheet)
- Volume: π × (1.824 ÷ 2)² cm² × 6.510 cm = about 17.0 mL. 11.52 ÷ 0.0170 L = about 677 Wh/L (matches the datasheet)
- Using the typical capacity: 3.6 V × 3.35 Ah = 12.06 Wh. 12.06 ÷ 0.0465 = about 259 Wh/kg
Reading: the datasheet's 248 Wh/kg and 677 Wh/L can be reproduced from the rated capacity, maximum mass and maximum dimensions (our inference from the calculation; the manufacturer does not state its formula). With the typical capacity, the same cell comes to about 259 Wh/kg. Unless you know which capacity and mass were used, the figure alone cannot be compared.
The same datasheet has two columns, for charge voltages of 4.20 V and 4.10 V. At 4.10 V it lists a rated capacity of 2,835 mAh and energy density of 219 Wh/kg and 600 Wh/LSourced (manufacturer's stated value). Compared with 248 Wh/kg at 4.20 V, 219 ÷ 248 = about 0.88Our calculation. Lowering the upper charge voltage by just 0.1 V cuts the energy that can be drawn by about 12%. Using a lower upper voltage to extend life rests on this trade against capacity (Commentary).
Next, the drop when cells become a pack. Löbberding et al. compared the energy density of cell, module and system for 25 BEV models (10 manufacturers, Chinese vehicles excluded) that entered the market between 2010 and 2019Sourced. According to Table 1 of the paper, the average cell-to-system “efficiency rate” (system value divided by cell value) is as followsSourced.
| Cell format | Per unit mass (average, min to max) | Per unit volume (average, min to max) |
|---|---|---|
| Prismatic and pouch | 0.575 (0.495 to 0.742) | 0.353 (0.168 to 0.528) |
| Cylindrical (Tesla) | 0.552 (0.484 to 0.672) | 0.295 (0.247 to 0.356) |
All Sourced (Table 1 of Löbberding et al., 2020). The 25 vehicles date from 2010 to 2019, and the figures may not hold for current designs such as cell-to-pack.
9. A materials engineer's view (2): check the denominator of “Wh/kg” three times
In materials development the question is “by how many Wh/kg does the cell improve if the active material changes?” As the calculations above show, the answer depends on the choice of denominator. Asking the following three questions makes misreading less likely (Commentary).
- 1. What mass or volume was divided by? Active material, cell or pack. For a cell, can only, or including tube and label? Read the datasheet's note (“calculated using bare cell dimensions”)
- 2. Which capacity was used? Rated, minimum or typical. Check temperature (20°C or 25°C), discharge rate and the upper charge voltage (in the example above, 4.20 V and 4.10 V differ by about 12%)
- 3. What is it being compared with? Do not mix half-cell material values, real-cell values and pack values. The mAh/g in a paper is mostly a half-cell value per unit of active material and does not translate directly into cell energy density
One more point: a pack figure is the sum of a material difference and a design difference. The IEA's statement that LFP packs are about one-fifth lower per unit mass than NMC packs is a value that includes differences in pack construction and design, not only in the active-material crystalsSourced. You cannot declare one material better than another from pack figures alone.
Löbberding et al. also conclude that systems are improving, but specific energy is improving more than energy density, and that there is still room for improvement in packaging optimisationSourced. Both cell improvements (materials) and the design that assembles cells (structure) decide the pack figure. The latter is treated in the “Cell Formats and Cell-to-Pack” article in this series.
10. Cell formats — cylindrical, prismatic, pouch
The IEA's Global EV Outlook 2026 sorts the lithium-ion market into three physical configurations, known as form factors: cylindrical, pouch and prismaticSourced.
- Cylindrical: the first format in which lithium-ion batteries were commercialised, introduced by Sony in 1991. Supported by mature related technology such as alkaline batteries, Japanese manufacturers have kept a strong focus on itSourced
- Pouch: it offers high energy density and highly customisable dimensions, and was chosen by Korean producers whose expansion coincided with the rapid growth of the smartphone industrySourced. BatPaC assumes the casing to be a three-layer laminate: a PET outer layer, a 0.1 mm aluminium middle layer and a PP inner layer (heat-sealed)Sourced
- Prismatic: a compact and rigid structure that can be efficiently stacked in EV battery packs, which is why Chinese manufacturers, whose growth has been closely tied to EV deployment, adopted it widely. It accounts for over 60% of EV batteries and most stationary storage batteries, and is the most widely used format worldwideSourced
Löbberding et al. also report a trend toward larger and prismatic cellsSourced. The IEA says that cooling plates between prismatic cells, and cell-to-pack (CTP) and cell-to-chassis (CTC) designs that eliminate the intermediate modules, raised overall energy density, while adding complications for recyclingSourced. That is where cell format connects with the pack figures in section 8.
11. Strengths and weaknesses; how this article divides work with others in the series
- Strengths: because lithium moves in and out without breaking the electrodes, the battery can be charged and discharged repeatedly. The voltage is high and so is the energy density. By choosing materials and formats, it covers uses from EVs to stationary storageSourced (Nobel announcement, IEA)
- Reading the challenges: distinguish initial irreversible reactions in Fong et al.’s half-cells [Ref. 2] from cell construction and cost in BatPaC [Ref. 9]. Our guidance is not to infer safety, life or manufacturing cost from material capacity alone.
- A pitfall in reading: mixing material mAh/g, cell Wh/kg and pack Wh/kg gives wrong rankings (sections 8 and 9)
What this article does not cover
- The inside of individual materials: cathodes (“Cathode Materials”), graphite and electrode design (“Graphite Anodes and Electrode Design”), conductive additives and binders (the article of that name), electrolytes and separators (the article of that name), the SEI (“SEI”)
- Manufacturing: coating, drying and calendering (“Electrode Manufacturing”), dry electrodes (“Dry Electrodes”)
- Safety, degradation and evaluation: thermal runaway (“Thermal Runaway and Battery Safety”), degradation and evaluation (“Battery Evaluation and Degradation”)
- The next generation: silicon anodes, lithium-metal anodes, sodium-ion batteries, lithium-sulfur batteries and so on. All-solid-state batteries are covered in a separate field, in the all-solid-state battery articles
- What could not be confirmed: a conditioned capacity value for NCA; the cathode composition of the NCR18650BF (not stated on its datasheet); and the formula behind the datasheet's energy density (not stated by the manufacturer; this article reproduces it from the rated capacity). None of these is filled in by guesswork
- A cell is made of six components: cathode, anode, electrolyte, separator, current collectors and casing. An electrode is a composite of active material, binder, conductive additive and pores, coated on metal foilSourced
- Start with lithium entering and leaving a host. Distinguish theoretical capacity from condition-specific measurements. The 140 mAh/g in Fig. 3 is an illustrative assumption, not a universal ceiling.
- Energy = voltage × charge. Seen from the active materials alone it is about 366 Wh/kg, but the cell datasheet value is 248 Wh/kg (NCR18650BF)Our calculation
- The same cell gives different numbers with a different denominator: about 259 Wh/kg on typical capacity, and 219 Wh/kg when the upper charge voltage is 4.10 V (manufacturer's stated value)Sourced
- Built into an EV pack, values fall to about 0.55 to 0.58 times per unit mass and about 0.3 to 0.35 times per unit volume, as reported for 25 vehicles from 2010 to 2019Sourced
- Choosing cathodes: in 2025 LFP was over 55% of EV batteries (IEA). LFP packs are about one-fifth lower per unit mass, but are chosen for use and costSourced
12. How to read evaluations and standards
Before comparing which number is larger, align the basis of comparison in the following order. This is an editorial reading checklist, not a set of test conditions or acceptance limits prescribed by a standard.
- 1. What was measured?
- capacity in Ah, energy in Wh, Wh/kg and life. Check the units and whether the result describes a material, component or complete system.
- 2. Under which conditions?
- material versus cell versus pack, current, temperature and charge/discharge window. Treat results under different conditions as separate results before comparing them.
- 3. The comparison trap
- Passing a safety test does not guarantee high capacity, long life or safety under every condition.
- 4. What does the standard cover?
- Check the identifier, title, edition and scope in the issuing body’s material. Distinguish test methods, safety, interoperability and management requirements. Naming a standard alone does not establish that a test, conformity assessment or certification has been completed.
Keep a comparison note containing the object, units, conditions, sample count and variation, comparator, standard edition and unresolved points. Do not invent numerical conditions or acceptance limits from a public abstract of a standard.
13. Glossary
- Cell
- The smallest unit of a battery: a single unit of cathode, anode, separator, electrolyte and casing.
- Module / pack
- Cells bundled together make a module; adding cooling and management systems and an enclosure makes a pack.
- Active material
- The substance in an electrode that actually takes part in moving lithium in and out.
- Intercalation
- A reaction in which ions enter and leave the layers or gaps of a crystal without breaking its framework.
- Theoretical / practical capacity
- The calculated value if all the lithium in the crystal were used, versus the amount that can actually be used. Practical is smaller.
- Nominal voltage
- A representative voltage of a battery. It changes during discharge; datasheets give figures such as 3.6 V.
- Rated / typical capacity
- The reference capacity set by the manufacturer, versus a representative measured value. Datasheets list different values.
- Wh/kg, Wh/L
- Energy per unit mass or volume. Always check what was divided by.
- Current collector
- The metal foil that collects an electrode's electrons. Aluminium for the cathode and copper for the anode are typical.
- Conductive additive / binder
- Carbon that builds electron pathways, and the polymer that ties particles to the foil.
- LCO / NMC / NCA / LMO / LFP
- Lithium cobalt oxide / lithium nickel manganese cobalt oxide / lithium nickel cobalt aluminum oxide / lithium manganese oxide / lithium iron phosphate.
- Half-cell
- A test cell using lithium metal as the counter electrode. Its conditions differ from a practical full cell.
- Voltage window
- The range of potential over which an electrolyte can be used without decomposing. About 1.5 V for aqueous systems; wider for organic ones.
- CTP / CTC
- Cell-to-pack / cell-to-chassis. Designs that build cells directly into the pack or vehicle body without modules.
14. References (primary sources)
- The Royal Swedish Academy of Sciences "The Nobel Prize in Chemistry 2019" press release, 9 October 2019 — nobelprize.org
- Fong R., von Sacken U., Dahn J.R. "Studies of Lithium Intercalation into Carbons Using Nonaqueous Electrochemical Cells", J. Electrochem. Soc. 137, 2009–2013 (1990; original experiment) — https://doi.org/10.1149/1.2086855
- Mizushima K., Jones P.C., Wiseman P.J., Goodenough J.B. "LixCoO2 (0<x<1): A new cathode material for batteries of high energy density", Materials Research Bulletin 15, 783–789 (1980; original experiment) — https://doi.org/10.1016/0025-5408(80)90012-4
- Padhi, Nanjundaswamy, Goodenough "Phospho-olivines as Positive-Electrode Materials for Rechargeable Lithium Batteries," Journal of The Electrochemical Society 144, 1188–1194 (1997) — doi.org/10.1149/1.1837571
- Ohzuku, Makimura "Layered Lithium Insertion Material of LiCo1/3Ni1/3Mn1/3O2 for Lithium-Ion Batteries," Chemistry Letters 30, 642–643 (2001) — doi.org/10.1246/cl.2001.642
- Jung et al. "Oxygen Release and Its Effect on the Cycling Stability of LiNixMnyCozO2 (NMC) Cathode Materials for Li-Ion Batteries," Journal of The Electrochemical Society 164, A1361–A1377 (2017) — doi.org/10.1149/2.0021707jes
- Dahn "Phase diagram of LixC6," Physical Review B 44, 9170–9177 (1991) — doi.org/10.1103/PhysRevB.44.9170
- Thackeray M.M., David W.I.F., Bruce P.G., Goodenough J.B. "Lithium insertion into manganese spinels", Materials Research Bulletin 18, 461–472 (1983; original experiment) — https://doi.org/10.1016/0025-5408(83)90138-1
- Nelson, Gallagher, Bloom, Dees (Argonne National Laboratory) "Modeling the Performance and Cost of Lithium-Ion Batteries for Electric-Drive Vehicles (Second Edition)," ANL-12/55 (2012) (PDF) — osti.gov
- Panasonic Energy "Specifications for NCR18650BF" cell datasheet (PDF) — api.pim.na.industrial.panasonic.com
- Löbberding, Wessel, Offermanns, Kehrer, Rother, Heimes, Kampker "From Cell to Battery System in BEVs: Analysis of System Packing Efficiency and Cell Types," World Electric Vehicle Journal 11, 77 (2020) — doi.org/10.3390/wevj11040077
- International Energy Agency (IEA) "Global EV Outlook 2026," chapter "Electric vehicle batteries," published 20 May 2026 — iea.org
- International Energy Agency (IEA) "Global EV Outlook 2025," "Electric vehicle batteries" (published May 2025) — iea.org
- Sony, "Sony Develops New Nexelion Hybrid Lithium Ion Batteries", 15 February 2005 (manufacturer announcement; includes 1991 commercialisation) — https://www.sony.com/en/SonyInfo/News/Press/200502/05-006E/
- Kimura, Onishi, Sakamoto, Asami "Achievement of the High-Capacity Retention Rate for the Li[Ni0.8Co0.15Al0.05]O2 (NCA) Cathode Containing an Aqueous Binder with CO2 Gas Treatment Using the Cavitation Effect (CTCE)," Journal of The Electrochemical Society 166, A5313–A5317 (2019) — doi.org/10.1149/2.0471903jes
15. Claim-to-source audit
| Claim in the text | Basis | Label |
|---|---|---|
| Initial irreversible reaction and surface film in carbon/Li half-cells with PC/EC; distinguished from full-cell discharge. | Fong et al. 1990, original abstract [Ref. 2] https://doi.org/10.1149/1.2086855 | Original study |
| Electrochemical Li extraction from LiCoO2; not evidence of a universal 140 mAh/g ceiling. | Mizushima et al. 1980, original abstract [Ref. 3] https://doi.org/10.1016/0025-5408(80)90012-4 | Original study |
| Room-temperature insertion into spinels and diffraction-based structural examination. | Thackeray et al. 1983, original abstract [Ref. 8] https://doi.org/10.1016/0025-5408(83)90138-1 | Original study |
| Commercialisation in 1991; the early anode is not identified as graphite. | Sony 2005, manufacturer announcement [Ref. 14] https://www.sony.com/en/SonyInfo/News/Press/200502/05-006E/ | Manufacturer announcement |
| That the foundation of the lithium-ion battery was laid during the oil crisis of the 1970s; that Whittingham's titanium disulphide cathode (with spaces that house lithium ions) and metallic lithium anode gave just over 2 V but metallic lithium was too reactive to be viable; that Goodenough predicted a metal oxide cathode and showed in 1980 that lithium-containing cobalt oxide gives up to 4 V; that Akira Yoshino used petroleum coke as the anode and made the first commercially viable lithium-ion battery in 1985; that it relies on lithium ions flowing between the electrodes rather than on reactions that break them down; and that it entered the market in 1991 | Nobel Prize in Chemistry 2019 press releaseReference 1 https://www.nobelprize.org/prizes/chemistry/2019/press-release/ | Sourced |
| That LiFePO4 operates at 3.5 V vs lithium with a specific capacity of 100 to 110 mAh/g at 0.05 mA/cm² (electrochemical extraction limited to about 0.6 Li) | Padhi et al. 1997, abstractReference 4 https://doi.org/10.1149/1.1837571 | Sourced |
| That LiCo1/3Ni1/3Mn1/3O2 showed a rechargeable capacity of 150 mAh/g between 3.5 and 4.2 V (evaluated in lithium cells) | Ohzuku and Makimura 2001, abstractReference 5 https://doi.org/10.1246/cl.2001.642 | Sourced |
| That in full cells with graphite, stable cycling was possible up to 4.4 V for NMC111 and NMC622 and only up to 4.0 V for NMC811; and the compositions behind the NMC111, NMC622 and NMC811 names | Jung et al. 2017, abstractReference 6 https://doi.org/10.1149/2.0021707jes | Sourced |
| That the LixC6 (0 ≤ x ≤ 1) phase diagram was determined with lithium/graphite cells and in situ X-ray diffraction, passing through dilute stage 1, stage 4, stage 3, 2L, stage 2 and filled stage 1 | Dahn 1991, abstractReference 7 https://doi.org/10.1103/PhysRevB.44.9170 | Sourced |
| BatPaC's description of cell construction (foil coated on both sides, active material bound by polymeric binder, carbon black and/or graphite conductive additive in the positive electrode, electrolyte in the pores); that the current collectors are aluminium (positive) and copper (negative) at 20 µm and 12 µm; that the electrolyte is LiPF6 in a carbonate mixture (EC with EMC or DMC) with possible additives; that the separator is a PP-based porous membrane with a PE middle layer serving as the shut-down feature; that the pouch casing is a three-layer PET, 0.1 mm aluminium and PP laminate; that in the baseline plant the positive-electrode solvent is NMP, recovered and recycled, and the negative-electrode solvent is water; that the cost breakdown is split into active materials, carbon and binders, current collectors, separator, electrolyte, cell hardware and so on; and that the report is the 2012 second edition | Argonne National Laboratory BatPaC report ANL-12/55Reference 9 https://publications.anl.gov/anlpubs/2015/05/75574.pdf | Sourced |
| The NCR18650BF specifications (nominal voltage 3.6 V; rated capacity 3,200 mAh at 20°C; minimum 3,250 and typical 3,350 mAh at 25°C; mass at most 46.5 g without tube; maximum dimensions 18.24 mm by 65.10 mm; energy density 248 Wh/kg and 677 Wh/L; the note on bare cell dimensions); and, at a charge voltage of 4.10 V, a rated capacity of 2,835 mAh and 219 Wh/kg and 600 Wh/L | Panasonic Energy cell datasheet (manufacturer's stated value)Reference 10 https://api.pim.na.industrial.panasonic.com/file_stream/main/fileversion/3446 | Sourced |
| That 25 BEVs (10 manufacturers, 2010 to 2019, Chinese vehicles excluded) were compared on cell, module and system energy density; the cell-to-system efficiency rates (by mass: prismatic and pouch 0.575 [0.495 to 0.742], cylindrical 0.552 [0.484 to 0.672]; by volume: 0.353 [0.168 to 0.528], 0.295 [0.247 to 0.356]); that systems are improving but specific energy more than energy density, with room for packaging optimisation; and a trend to larger prismatic cells | Löbberding et al. 2020, paper and Table 1Reference 11 https://doi.org/10.3390/wevj11040077 | Sourced |
| That LFP accounted for over 55% of EV batteries deployed globally in 2025 (nearly 50% in 2024); that cylindrical cells were introduced by Sony in 1991 as the first form, and the features and adopting countries of pouch and prismatic cells; that prismatic cells account for over 60% of EV and most stationary batteries; that CTP and CTC raise energy density but complicate recycling; that NCA is grouped with NMC622 and NMC811 as mid- and high-nickel; and the publication date of 20 May 2026 | IEA Global EV Outlook 2026Reference 12 https://www.iea.org/reports/global-ev-outlook-2026/electric-vehicle-batteries | Sourced |
| That LFP packs have about one-fifth lower energy density by mass and about one-third lower by volume than NMC packs; that LFP can reach 100% state of charge without significant degradation whereas NMC is typically limited to 80% | IEA Global EV Outlook 2025Reference 13 https://www.iea.org/reports/global-ev-outlook-2025/electric-vehicle-batteries | Sourced |
| That the composition of NCA is written Li[Ni0.8Co0.15Al0.05]O2 in some papers | Kimura et al. 2019, titleReference 15 https://doi.org/10.1149/2.0471903jes | Sourced |
| LiCoO2's theoretical capacity of about 274 mAh/g, practical capacity at about 51% of theory, graphite's theoretical capacity of about 372 mAh/g, the combined value of about 102 mAh/g, and about 366 Wh/kg per total active-material mass; the reproduction of the NCR18650BF datasheet values (3.6 V × 3.2 Ah ÷ 46.5 g = about 248 Wh/kg, about 17.0 mL, about 677 Wh/L), about 259 Wh/kg on typical capacity, and 219 ÷ 248 = about 0.88 at 4.10 V; and the rough estimates of about 137 Wh/kg and about 200 Wh/L from applying the average cylindrical efficiency | Our calculation. The Faraday constant of 96,485 C/mol, the molar masses (Li 6.94, Co 58.93, O 16.00, C 12.01), the 3.6 V nominal voltage, graphite delivering its theoretical capacity, and the pack estimate multiplying values from different sources are all assumptions made in this article. These are not values of a real pack, and active-material values are not cell values | Our calculation |
| A conditioned capacity value for NCA, the cathode composition of the NCR18650BF, and the formula behind the datasheet's energy density | Not stated in the primary sources opened for this article, so not given (only our calculation that the datasheet values can be reproduced from the rated capacity) | Commentary |
| The reading of the cell as layers of a three-phase composite film; that improving the active material improves the whole cell less if non-active mass stays the same; that interfaces are many; the three questions about the denominator; that a pack figure is the sum of a material difference and a design difference; that a lower upper charge voltage is a trade against capacity; that cylindrical and some prismatic cells are wound and pouch cells and others stacked; and the summary of strengths and challenges | Our summary and commentary based on published content, and an Inference. Not views stated by any company or institution | Commentary |
| That Figs. 1, 2, 3, 5 and 6 are explanatory drawings rather than real observations or design drawings, and that Fig. 4 and the hero image are AI-generated images | Our note | Commentary |
Last updated: 17 October 2026. Four secondary sources have been replaced with original studies or the manufacturer’s own announcement, with claims narrowed accordingly. Fong, Mizushima and Thackeray are used only within what their original abstracts confirm; missing experimental conditions are not invented. The 140 mAh/g example is assumed. Theory, measurements, manufacturer specifications and institutional models/statistics are distinguished. Figures are conceptual, not product photographs.