TECHNOLOGY EXPLAINER
Lithium-Sulfur Batteries
— the gap between a theoretical number and the weight of a real cell
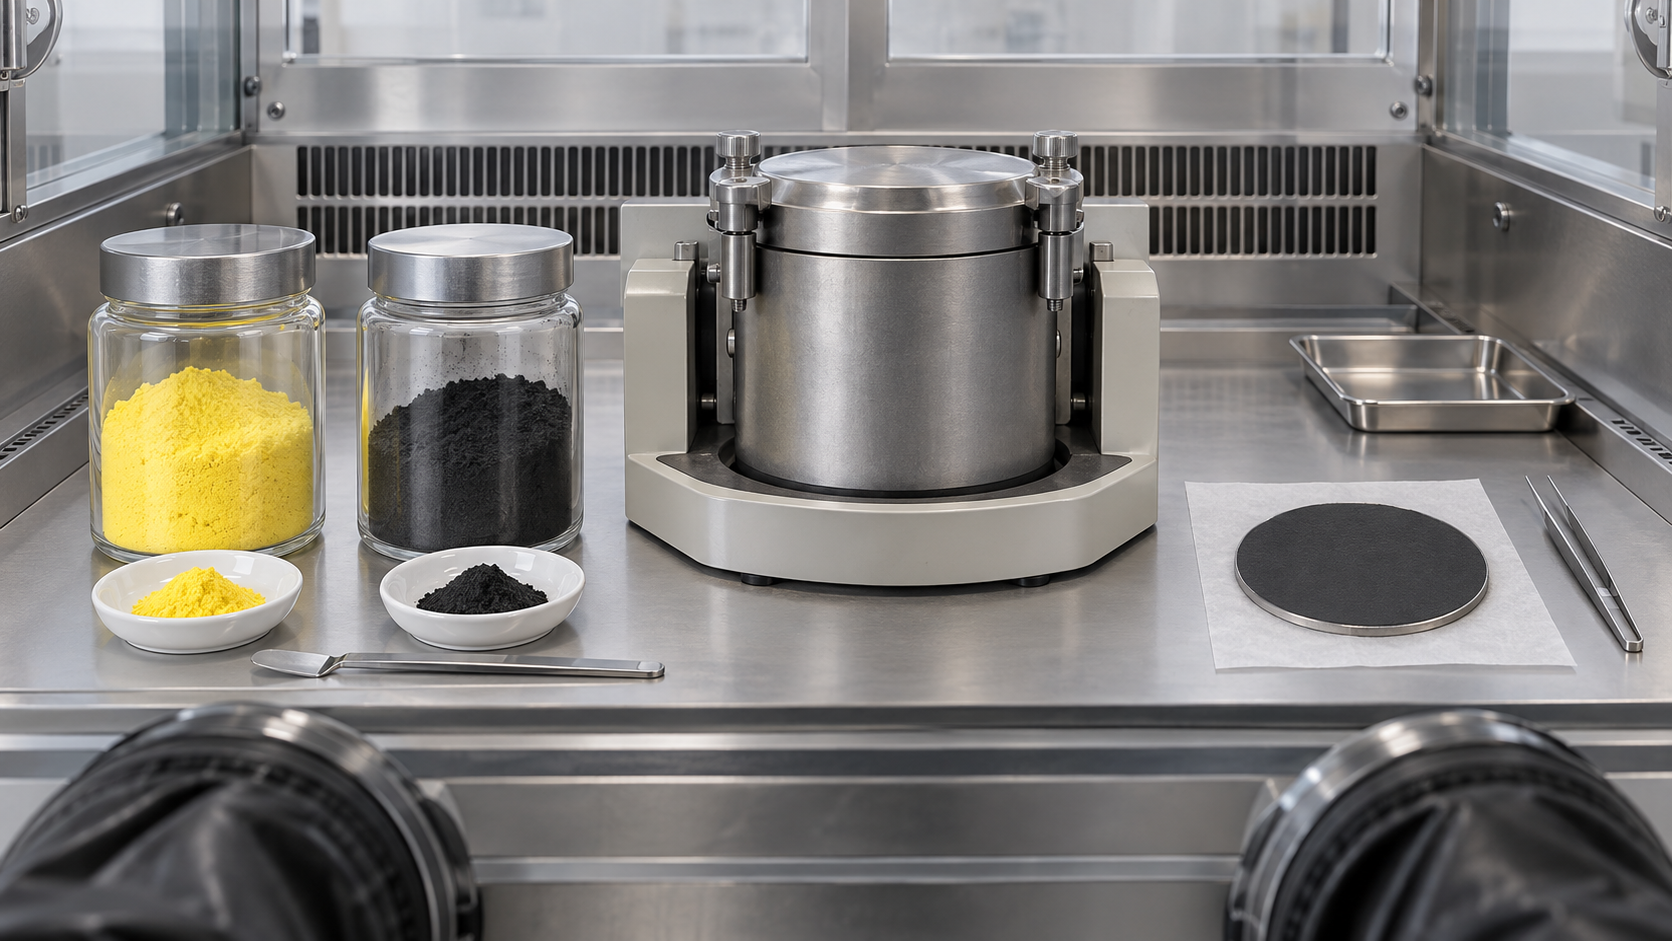
A lithium-sulfur battery uses sulfur at the cathode and lithium metal at the anode. Its theoretical energy density, about 2,600 Wh/kg on a material basis, far exceeds that of lithium-ion batteries. But during cycling sulfur dissolves into the electrolyte, its volume changes by about 80%, and the lithium-metal anode degrades. In a real cell, the amount of electrolyte (the E/S ratio) almost decides the weight and the energy density.
- What a lithium-sulfur battery is (the short version)
- The reaction — from S8 through polysulfides to Li2S
- Our calculation: theoretical capacity, theoretical energy and volume change
- The shuttle effect and the volume change
- A materials engineer's view (1): sulfur is an active material that dissolves in the electrolyte
- Pairing with a lithium-metal anode
- Evaluation conditions — E/S ratio, sulfur loading and N/P ratio
- Our calculation: how the amount of electrolyte sets weight and volume
- A materials engineer's view (2): four questions for reading a paper's numbers
- High gravimetric energy density versus volumetric density and lifetime
- Where commercialization stands — company announcements and independent surveys
- What is still hard
- How to read evaluations and standards
- Glossary
- References
- Claim-to-source audit
Sourced = stated in published material (link given)
Our calculation = a figure this article derived, with the assumptions spelled out
Not yet confirmed = a plan or target with no confirmed track record
Structural readings and materials-design interpretations are marked separately as Commentary. Company announcements are treated as company claims and kept apart from independent surveys.
Battery numbers change with the basis (material, cell or pack), with whether it is the first discharge or after formation, and with how much electrolyte is used. The basis is always given in the text.
1. What a lithium-sulfur battery is (the short version)
A lithium-sulfur (Li-S) battery is a rechargeable battery that uses sulfur as the cathode active material and lithium metal as the anode. Unlike a lithium-ion battery, in which ions move in and out of a crystal (insertion), it is a “conversion” battery in which the sulfur itself undergoes a chemical changeSourced (Chan et al. [1]).
- How high is it: sulfur's theoretical capacity is 1,675 mAh/g and lithium metal's is about 3,860 mAh/g; together they give a theoretical energy density of about 2,600 Wh/kgSourced [1, 2]. This is a material-basis value.
- What is hard: the polysulfides formed along the way dissolve into the electrolyte and migrate to the anode (the shuttle effect), the volume difference between sulfur and lithium sulfide is about 80%, and both are electrically insulatingSourced [1].
- Where commercialization stands: Fraunhofer ISI said in June 2026 that a broadly available automotive-grade Li-S cell for the mass market is currently not visible, and that the first markets are likely to be niches where weight matters most, such as drones, aviation, space and defenseSourced [5].
The “2,600 Wh/kg” of lithium-sulfur excludes the electrolyte, the carbon, the current collectors and the packaging. In a real cell the amount of electrolyte alone cuts the gravimetric energy density by a large factor. That is why the 2026 review holds that evaluation must be done under practical conditions such as an electrolyte-to-sulfur ratio (E/S) below 5 µL/mg and a sulfur loading above 5 mg/cm²Sourced [1]. For a materials engineer the most useful habit is to check the amount of electrolyte before reading the number in a paper (commentary by this article).
2. The reaction — from S8 through polysulfides to Li2S
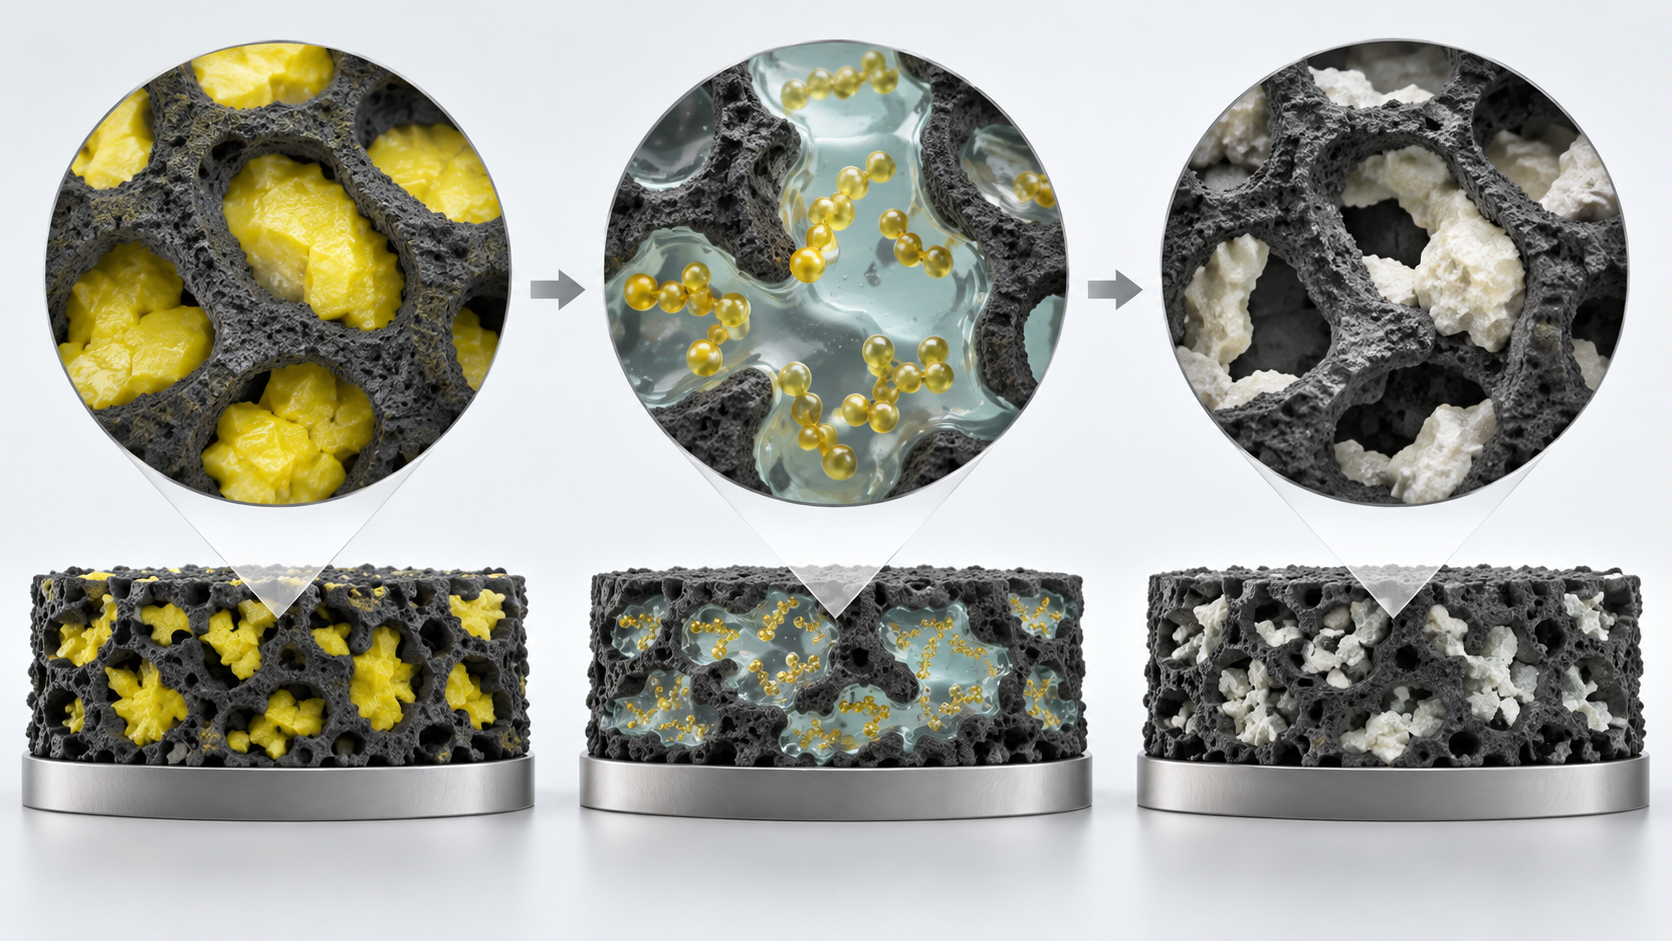
On discharge, solid sulfur (S8) turns into long-chain polysulfides that dissolve in the electrolyte (Li2S8 → Li2S6 → Li2S4), and finally deposits as insoluble solid sulfides (Li2S2/Li2S). Charging is the reverse. The overall reaction is written S8 + 16Li+ + 16e- → 8Li2SSourced [1]. Each sulfur atom accepts two electrons, at about 2.1 V versus Li/Li+Sourced [2].
View the original SVG schematic and exact annotations
3. Our calculation: theoretical capacity, theoretical energy and volume change
From published property values we check the “2,600 Wh/kg” and the “about 80%”Our calculation.
Assumptions: atomic masses S 32.06 and Li 6.94; two electrons per sulfur atom; Faraday constant 96,485 C/mol (26,801 mAh/mol). Densities S8 2.07 g/cm³ and Li2S 1.66 g/cm³ (standard property values). An average voltage of 2.1 to 2.2 V is assumed. These are material-basis values.
| Item | Calculation | Result |
|---|---|---|
| Theoretical capacity of sulfur | 2 × 26,801 ÷ 32.06 | about 1,672 mAh/g (literature: 1,675) |
| Formula mass of Li2S | 2 × 6.94 + 32.06 | 45.94 g/mol |
| Capacity per total mass of Li plus S | 2 × 26,801 ÷ 45.94 | about 1,167 mAh/g |
| Theoretical energy density (material basis) | 1,167 × voltage (2.1 to 2.2 V) | about 2,450 to 2,570 Wh/kg (literature: about 2,600) |
| Volume change | S: 32.06 ÷ 2.07 = 15.5 cm³/mol Li2S: 45.94 ÷ 1.66 = 27.7 cm³/mol | 27.7 ÷ 15.5 = 1.79 (about +79%) |
The calculations are Our calculation. The values of 1,675 mAh/g and about 2,600 Wh/kg are from the literature [1, 2], and the “about 80% volume change” is the review's statement [1]; all are Sourced.
4. The shuttle effect and the volume change
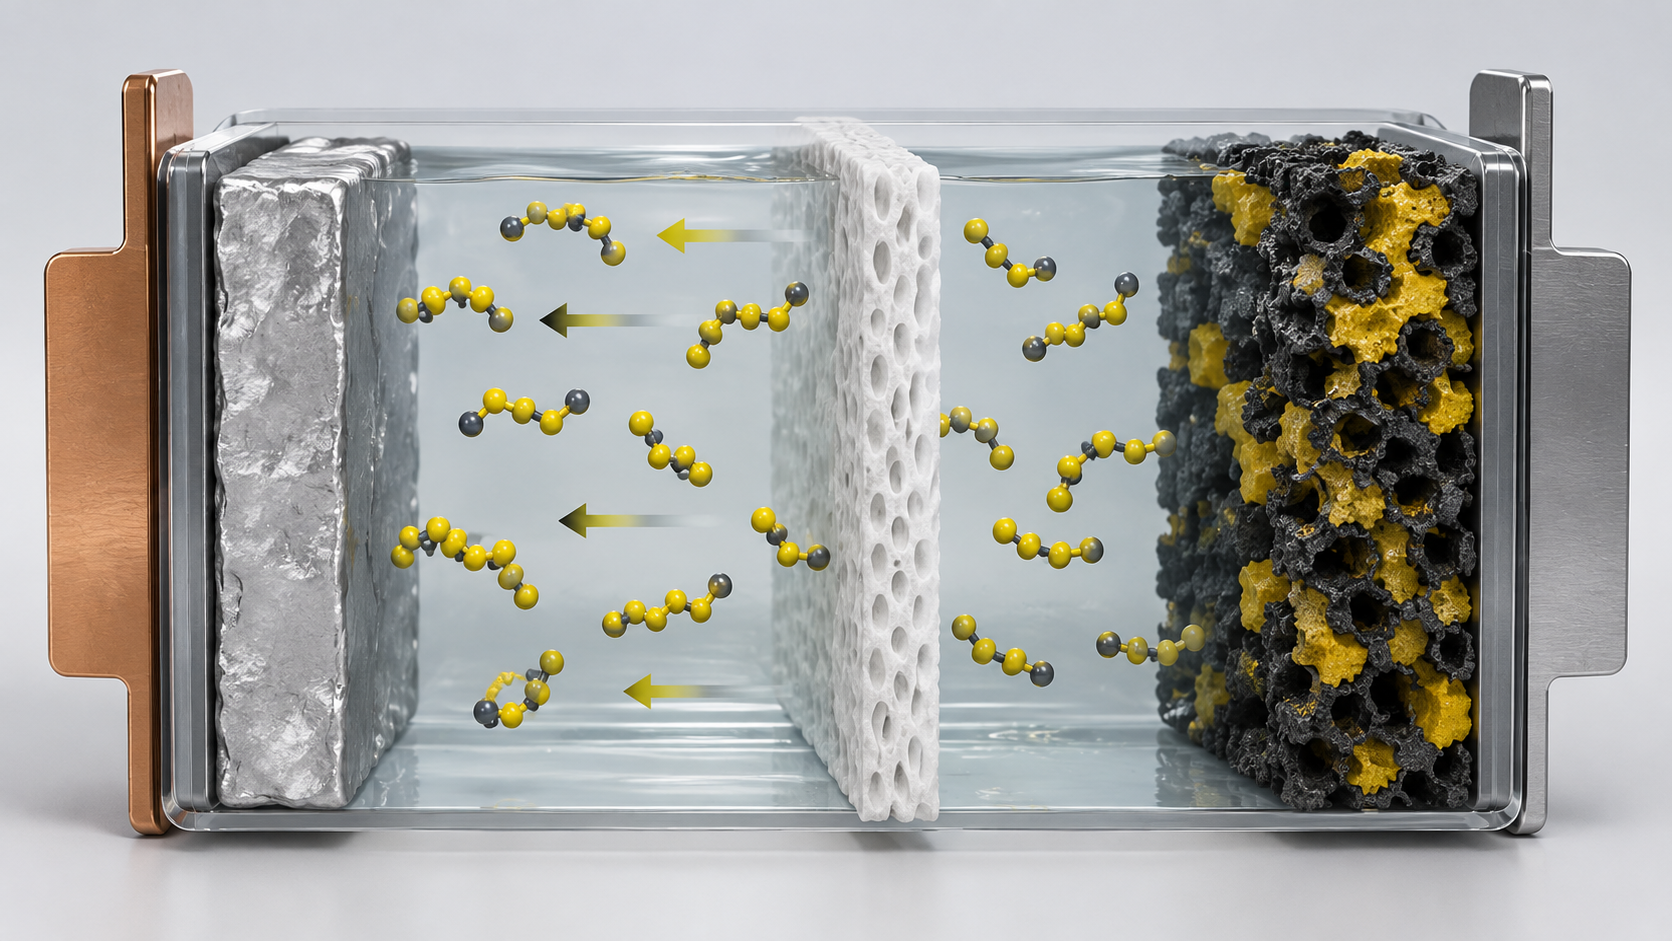
The review lists three intrinsic challenges of lithium-sulfur batteriesSourced [1].
- The shuttle effect: dissolved polysulfides migrate to the anode and react with lithium metal, causing loss of active material, side reactions at the anode and lower Coulombic efficiency.
- Insulation: sulfur and lithium sulfide are both electronic insulators, so reaction is slow, a conductive additive is needed, and it is hard to raise the sulfur content.
- Volume change (about 80%): the volume difference between sulfur and lithium sulfide puts continual mechanical stress on the electrode and gradually destroys its structure.
View the original SVG schematic and exact annotations
5. A materials engineer's view (1): sulfur is an active material that dissolves in the electrolyte
The active material of a lithium-ion battery only moves ions in and out of a crystal and never leaves the electrode. The sulfur of a lithium-sulfur battery dissolves into the electrolyte and leaves the electrode on the way. The cathode design is therefore not only a matter of particles and electrode structure but a design of mass transport through the whole cell, including electrolyte, separator and anode (commentary by this article).
For a materials engineer this changes the division of labor among materials.
- Carbon host: builds the conduction path for sulfur and physically confines polysulfides. The review lists the 2009 infusion of sulfur into ordered mesoporous carbon as a major milestoneSourced [1]. Pore size and volume decide at once how much sulfur can be loaded and how much electrolyte is needed.
- Binder: must both withstand the volume change (about 80%) and have an affinity for polysulfides, says the review [1].
- Catalytic hosts: metal-based and compound materials that speed up Li2S oxidation and polysulfide conversion are being studied [1].
- Separator layers and interlayers: layers that suppress polysulfide migration. Note, however, that each added layer adds weight and volume and lowers the cell's energy density (commentary by this article).
For practical evaluation the review asks for a high sulfur content (above 60 wt%), a high loading (above 5 mg/cm²) and little electrolyte at the same timeSourced [1]. Conductive additive, host, binder and catalyst are all additives that add weight, so material design is always dogged by the contradiction that the more functions are added, the lower the real cell's energy density becomes (commentary by this article).
6. Pairing with a lithium-metal anode
The high theoretical energy density of the lithium-sulfur battery rests not only on sulfur but also on the lithium-metal anode (about 3,860 mAh/g)Sourced [1]. The problems of lithium-metal anodes therefore become the problems of this battery.
- Reactivity: lithium's standard potential is -3.04 V (versus the standard hydrogen electrode), so it reacts readily with electrolyte components and dissolved polysulfides; SEI is formed and broken down continually and interfacial resistance risesSourced [1].
- Dendrites and dead lithium: non-uniform deposition causes branching growth (dendrites) and accumulation of electrically disconnected “dead lithium,” harming safety and cycle lifeSourced [1].
- N/P ratio: to cut the weight of a real cell, thin lithium foil is needed (a small N/P ratio, the capacity of the negative electrode divided by that of the positive). The review says thin lithium foils with N/P below 5 have become essential for realistic evaluationSourced [1]. The thinner the foil, the more a small amount of degradation bears on lifetime.
Details of the lithium-metal anode itself (why its capacity looks so large, the anode-free idea and the nature of deposited lithium) are covered in our explainer on lithium-metal anodes in this series, and the growth mechanism and countermeasures of dendrites in our explainer on dendrites. In the lithium-sulfur battery there is an additional cause of degradation that a pure lithium-metal cell does not have: dissolved polysulfides attacking the anode (commentary by this article). The standard solvents for the electrolyte are ethers (DOL, DME), whose weaknesses are volatility and flammabilitySourced [1].
7. Evaluation conditions — E/S ratio, sulfur loading and N/P ratio
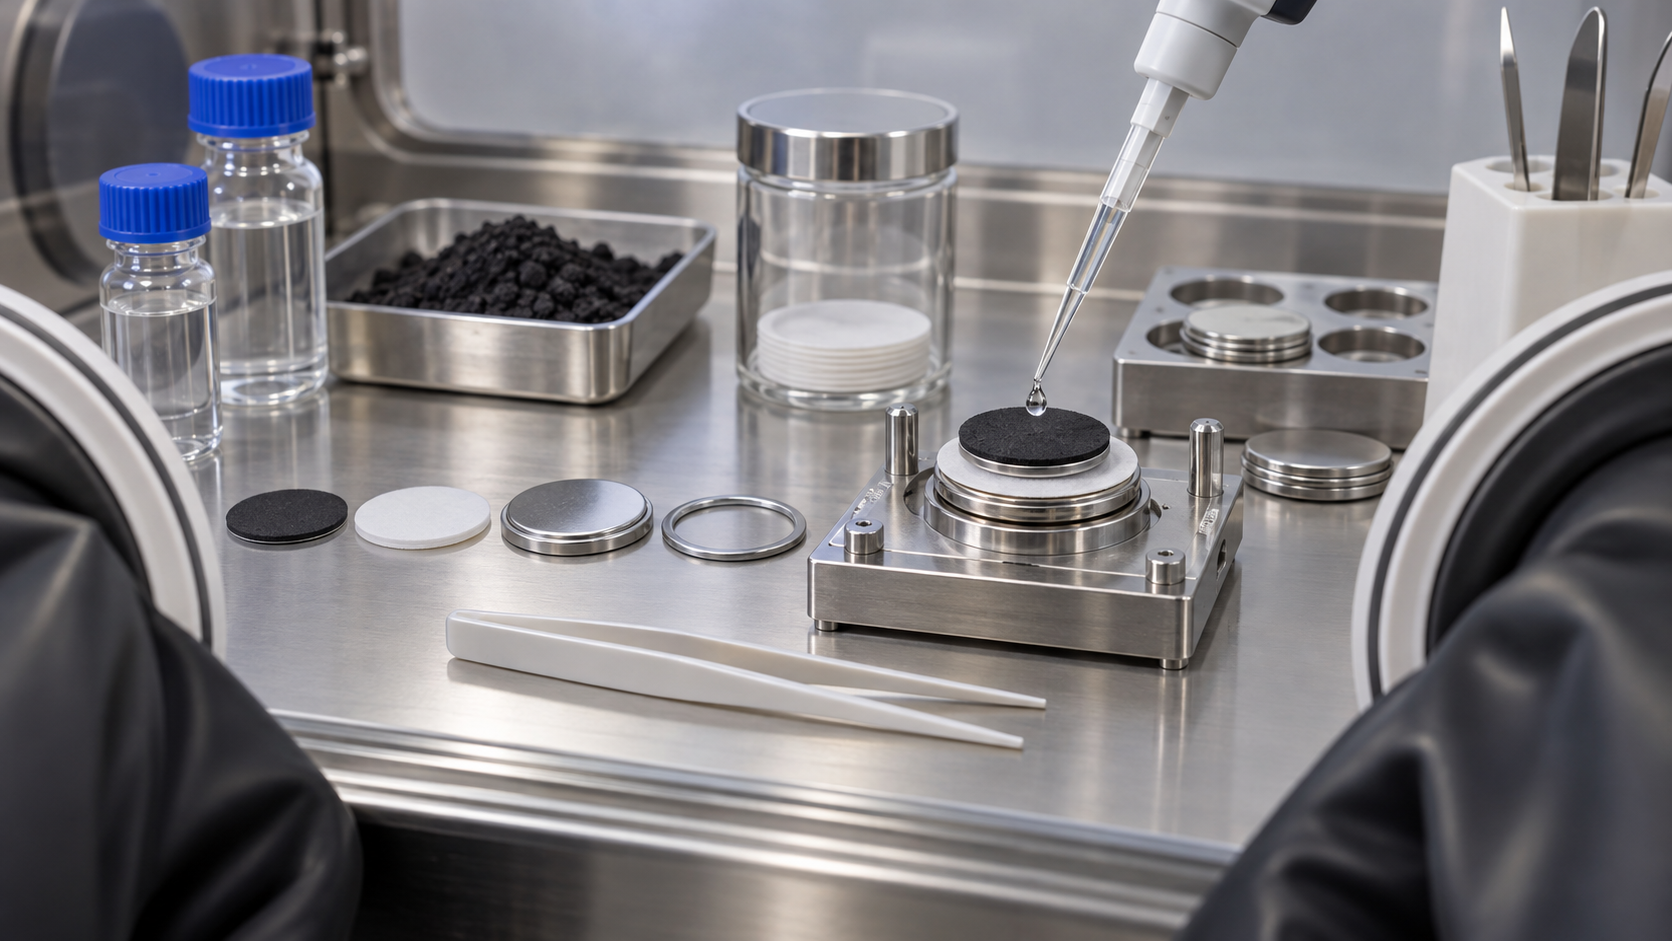
The meaning of a number in a lithium-sulfur paper changes with the conditions under which it was measured. The review points out that many academic studies use low sulfur loading, thick lithium foil and excess electrolyte, conditions that artificially improve cycling stability and do not reflect the constraints of real devicesSourced [1].
| Evaluation condition | Practical guide (2026 review) | Common academic condition | Effect on the numbers |
|---|---|---|---|
| Sulfur loading | Above 5 mg/cm² | Low loading | Thicker electrodes bring resistance, diffusion and stress problems, lowering utilization and cycling [1] |
| Sulfur content (in the electrode) | Above 60 wt% | A large amount of conductive carbon | The lower the content, the lower the energy density of the whole electrode [1] |
| E/S ratio (electrolyte to sulfur) | Below 5 µL/mg (E/C ratio also below 5 µL/mAh) | Excess electrolyte above 10 µL/mg | More electrolyte dilutes polysulfides and looks stable, but the real energy density falls greatly [1] |
| N/P ratio (negative to positive capacity) | Thin lithium foil, N/P below 5 | A large excess of lithium | The more surplus lithium, the more stable cycling looks and the more anode degradation is hidden [1] |
| Areal capacity | 2 to 4 mAh/cm² | - | Corresponds to a guide of 10 to 15 mWh/cm² of energy density [1] |
All are Sourced (statements of Chan et al. 2026 [1]; the “guide” values are the conditions the review says are needed to assess practicality).
The review says that under lean-electrolyte conditions with E/S below 5 µL/mg, the polysulfide concentration rises sharply, mass transport becomes diffusion-limited, cathode wetting worsens and the conversion between sulfur and lithium sulfide slows downSourced [1]. In other words, little electrolyte is essential for energy density but is the harshest condition for lifetime and power.
8. Our calculation: how the amount of electrolyte sets weight and volume
With a simple model we estimate how much the amount of electrolyte (the E/S ratio) affects the cell's gravimetric and volumetric energy densityOur calculation. This is a rough estimate under stated assumptions, not the design of a real cell.
Assumptions (all assumed): computed per 1 Ah of reversible capacity. Sulfur utilization of 1,000 mAh/g (about 60% of theoretical), so 1.00 g of sulfur. Sulfur content of the electrode is 70 wt%, and the remaining 30 wt% (conductive carbon and binder, 0.43 g) has a density of 2.0 g/cm³. Lithium metal at 3,861 mAh/g with N/P = 2 (0.518 g, density 0.534 g/cm³). Electrolyte density of 1.1 g/cm³ (E/S × 1.00 g × 1.1). Inactive components such as current collectors, separator and packaging are 1.0 g/Ah (volume not included). Average voltage 2.1 V.
| E/S ratio (µL/mg) | Active material + electrolyte + inactive parts (g/Ah) | Gravimetric energy density (Wh/kg, rough) | Volume (cm³/Ah, active material and electrolyte only) | Volumetric energy density (Wh/L, rough) |
|---|---|---|---|---|
| 3 | 6.25 | 336 | 4.67 | 450 |
| 5 | 8.45 | 249 | 6.67 | 315 |
| 10 | 13.95 | 151 | 11.67 | 180 |
| 15 | 19.45 | 108 | 16.67 | 126 |
Our calculation (the assumptions above). Volume is the sum of sulfur, carbon, lithium and electrolyte volumes and excludes collectors, separator, packaging and voids. These are neither cell values nor predictions.
Three things can be read from this calculation (commentary by this article).
- Electrolyte makes up most of the weight. At E/S = 5 µL/mg the electrolyte accounts for about 65% (5.5 ÷ 8.45) of active material plus electrolyte plus inactive partsOur calculation. Sulfur itself is only about 12% (1.0 ÷ 8.45).
- The electrolyte volume is about ten times the sulfur volume. At E/S = 5 µL/mg, 1 g of sulfur occupies about 0.48 cm³ (2.07 g/cm³), whereas the electrolyte is 5 cm³Our calculation. This is why volumetric energy density is slow to rise.
- It stays at about a tenth of the theoretical value. Even at E/S = 3 the result is about 336 Wh/kg, about 13% of 2,600 Wh/kgOur calculation. In a real cell, if collectors and separator weigh more than assumed, it falls further.
The assumptions used (such as a utilization of 1,000 mAh/g) are not necessarily those of real cells. Read the sensitivity, that the number changes several-fold with the amount of electrolyte, rather than the numbers themselves. Hagen et al. (2015) likewise calculated, for 18650 cells, the cell energy and cost for different sulfur loadings, utilizations and electrolyte-to-sulfur ratios, and compared the required values with statistics from 274 papers to show the “gap” between the state of research and the values needed for high-energy cellsSourced [4] (from the abstract; its numerical values were not checked here).
9. A materials engineer's view (2): four questions for reading a paper's numbers
A figure of “X Wh/kg” in lithium-sulfur material can differ by an order of magnitude with conditions. It is practical to check with these four questions (commentary by this article).
- At what level is the value? Active material, coin cell, small pouch, full-size pouch (such as 10 Ah), pack or strategic target. Fraunhofer ISI likewise cautions that companies' figures “may refer to different levels: active material, coin cell, pouch cell, cell level or strategic target values” and can be compared only to a limited extentSourced [5].
- First discharge or after formation? Li-S Energy says the first-discharge value is “always significantly higher” than practical performance and reports values after formation cycling. Its 10 Ah cell gives 498 Wh/kg on first discharge and 456 Wh/kg after formation (company claim)Sourced [6].
- How much electrolyte? If the E/S ratio is not given, one cannot tell whether the value is for a realistic cell.
- What about cycle count and capacity retention? The review says that satisfying lean electrolyte, thin lithium and high loading together shortens cycle lifeSourced [1]. An energy-density figure alone does not tell lifetime.
10. High gravimetric energy density versus volumetric density and lifetime
The lithium-sulfur battery's greatest selling point is its high energy per unit mass. Under the same conditions, however, volumetric energy density and lifetime tend to be traded away for it.
| Aspect | What is known | Reason (materials side) |
|---|---|---|
| Gravimetric energy density | The theoretical value is about 2,600 Wh/kg (material basis) [1, 2]. Cell values claimed by companies are in the 350 to 500 Wh/kg class (company claims, at different levels) [5, 6] | Sulfur is light (atomic mass 32), takes two electrons per atom, and lithium metal is light (Chapter 3) |
| Volumetric energy density | In our rough estimate, active material plus electrolyte alone gives about 315 Wh/L at E/S = 5 µL/mg. The review says current lithium-ion batteries reach over 700 Wh/L at cell level [1] (different bases; not a direct comparison)Our calculation | The electrolyte takes about ten times the volume of the sulfur (Chapter 8). Because sulfur's volume changes by about 80%, the electrode needs void space (commentary by this article) |
| Cycle life | The review says satisfying high loading, thin lithium and lean electrolyte together shortens life. Reported examples include 200 cycles at a sulfur loading of 12 mg/cm² and E/S of 4 µL/mg (C/5) and 500 cycles at 6 mg/cm² (C/2) [1] (original papers not checked; conditions differ by report) | Lean electrolyte raises polysulfide concentration. Thin lithium is exhausted by even slight degradation [1] |
“Sourced” entries in the table are statements of [1], [2], [5] and [6]. Parts marked Our calculation are rough estimates under the assumptions of Chapter 8.
In short, the more one chases lightness, the more the design moves toward less electrolyte and less anode, and the strain shows up in lifetime and volume. For this reason ISI expects the first markets to be uses where weight, rather than volume, decides (drones, aviation, space, defense)Sourced [5]. In passenger cars, volumetric energy density and a lifetime of thousands of cycles matter, so competition is harder (commentary by this article).
11. Where commercialization stands — company announcements and independent surveys
The best-organized independent source is Fraunhofer ISI's June 2026 survey. Its main points are as followsSourced [5].
- Lithium-sulfur batteries are “a promising high-energy technology but have not yet been broadly commercialized.” A broadly available automotive-grade Li-S cell for the mass market is currently not visible.
- In the United States, Lyten, Zeta Energy, Solidion, NexTech, Sion Power, Conamix and others are active, mostly in defense, space and other specialized markets. In Europe, Theion, Alteva, Gelion Europe/Oxlid and others are developing materials and cells.
- For CATL, LG Energy Solution and Samsung SDI, Li-S appears “more as a strategic research or future option than as a short-term product program.”
- The first markets are probably not passenger cars or stationary storage but drones, aviation-adjacent uses, space and defense, where the need for gravimetric energy density is particularly high.
| Party | Published content (company claim or plan) | What could not be confirmed |
|---|---|---|
| Li-S Energy (Australia) | Exchange disclosure of 28 October 2024: its GEN3 semi-solid full-size 10 Ah cells give 498 Wh/kg on first discharge and 456 Wh/kg after formation cycling. It reports the post-formation value because first-discharge values are always significantly higher than practical performance. It targets drones, defense and electric aviationSourced [6] (company claim) | Cycle life, E/S ratio, third-party measurement. The “industry leading” description is the company's own judgment based on other companies' published figures |
| Lyten (USA) | ISI's summary: communicates deliveries for UAV applications, a planned Li-S gigafactory in Nevada of up to 10 GWh per year, and acquired Northvolt assets in Europe. Claims “up to 50% lighter than NMC” and “up to 75% lighter than LFP.” Automotive qualification takes a long timeSourced [5] (company claims and plans as summarized by ISI) | Delivered volumes and measured cell specifications. Plans are Not yet confirmed |
| Zeta Energy (USA) | A 2024 development agreement with Stellantis. The target is electric vehicles, with a timeframe of around 2030Sourced [5] | Specification and mass-production plan. Not yet confirmed |
| LG Energy Solution (Korea) | In 2026, a demonstration of a sulfur cathode for all-solid-state batteries (about 1,500 mAh/g for the sulfur cathode against a theoretical 1,675). Presented as R&DSourced [5] | Cell-level performance and any product plan |
| SVOLT (China) | Testing of all-solid-state sulfur battery prototypes in 2022. 20 Ah, 350 to 400 Wh/kg. No clear public activity sinceSourced [5] | Later progress |
The Li-S Energy row follows [6]; the others follow ISI's summary [5]. All are company claims, not independent measurements.
This investigation found no value for cell performance measured and published by an independent third party (an item that could not be confirmed). Note also that some of the values mentioned (Li-S Energy, SVOLT, LG Energy Solution) relate to semi-solid or all-solid configurations, different designs from the standard liquid-electrolyte lithium-sulfur battery (commentary by this article). All-solid-state batteries are outside the scope of this article and are covered in the all-solid-state battery articles of this series.
12. What is still hard
- Lifetime under practical conditions. Satisfying lean electrolyte, thin lithium and high loading together shortens life [1]. No independently verified value of thousands of cycles was found in this investigation.
- Volumetric energy density. The electrolyte volume is about ten times the sulfur volume (Chapter 8), so the gap to lithium-ion batteries is likely to show per unit volume.
- Degradation of the lithium-metal anode, and safety. Dendrites, dead lithium and reaction with polysulfides [1]. Ether electrolytes are volatile and flammable [1]. No independent safety assessment of this battery was found here. For battery safety in general, see our explainer on thermal runaway and battery safety in this series.
- Control of the shuttle effect and insulation. Adding functions such as hosts, binders, catalysts and layers on the separator adds weight (Chapter 5).
- Standardization of evaluation. The levels and conditions behind “Wh/kg” are not aligned [5]. Evaluation that states E/S ratio, N/P ratio, loading and cycling conditions is needed [1].
- Mass production and qualification. Automotive qualification takes a long time, and ISI expects markets with short validation cycles to come first [5].
- A lithium-sulfur battery is a conversion cell in which sulfur goes from solid to dissolved to solid. The theoretical value is about 2,600 Wh/kg (material basis) and sulfur's theoretical capacity is 1,675 mAh/gSourced
- The volume difference between sulfur and Li2S is about 79% by calculation, and the material's 2,600 Wh/kg excludes electrolyte, carbon, collectors and packagingOur calculation
- The challenges are the shuttle effect, insulation, the volume change and degradation of the lithium-metal anodeSourced
- Practical conditions are summarized as E/S below 5 µL/mg, sulfur loading above 5 mg/cm² and N/P below 5Sourced
- The amount of electrolyte changes the rough energy density several-fold. As E/S rises from 3 to 15, gravimetric energy density falls from about 336 to about 108 Wh/kg (an estimate under assumptions)Our calculation
- The 350 to 500 Wh/kg-class values from various companies are company claims at different levels (coin cell or 10 Ah) and conditions (first discharge or after formation). No independent measured values were foundSourced
- ISI expects the first markets to be uses where weight is decisive, such as drones, aviation, space and defense. A broadly available cell for passenger cars is not visibleSourced
13. How to read evaluations and standards
Before comparing which number is larger, align the basis of comparison in the following order. This is an editorial reading checklist, not a set of test conditions or acceptance limits prescribed by a standard.
- 1. What was measured?
- sulfur-specific capacity, areal capacity, cell Wh/kg and life. Check the units and whether the result describes a material, component or complete system.
- 2. Under which conditions?
- sulfur loading, electrolyte/sulfur ratio, lithium inventory, voltage window and pressure. Treat results under different conditions as separate results before comparing them.
- 3. The comparison trap
- High capacity per gram of sulfur is not the same as high energy density of the whole cell.
- 4. What does the standard cover?
- Check the identifier, title, edition and scope in the issuing body’s material. Distinguish test methods, safety, interoperability and management requirements. Naming a standard alone does not establish that a test, conformity assessment or certification has been completed.
Keep a comparison note containing the object, units, conditions, sample count and variation, comparator, standard edition and unresolved points. Do not invent numerical conditions or acceptance limits from a public abstract of a standard.
14. Glossary
- Lithium-sulfur (Li-S) battery
- A rechargeable battery with a sulfur cathode and a lithium-metal anode.
- Polysulfide
- A general term for Li2Sn (n from 2 to 8). The long-chain ones dissolve in the electrolyte.
- Shuttle effect
- Dissolved polysulfides shuttling between the electrodes, causing loss of active material and lower efficiency.
- Conversion type
- A scheme that stores electricity by the substance itself changing chemically, not by ions moving in and out.
- E/S ratio
- Electrolyte volume (µL) divided by sulfur mass (mg). A lean-electrolyte guide is below 5 µL/mg.
- E/C ratio
- Electrolyte volume divided by capacity (mAh).
- N/P ratio
- Capacity of the negative electrode divided by that of the positive. The smaller it is, the less surplus lithium.
- Sulfur loading
- The mass of sulfur per unit electrode area (mg/cm²).
- Formation
- The first charge-discharge of an assembled cell, which forms the SEI and so on. Some capacity is lost in the process.
- LiNO3 additive
- An electrolyte additive that forms a protective layer on lithium and suppresses reaction with polysulfides.
- Dead lithium
- Deposited lithium that has become electrically disconnected.
- Lean electrolyte
- Electrolyte amount reduced to a practical level (for example E/S below 5 µL/mg).
15. References
- Chan, Wu and Chung (National Cheng Kung University) "Design principles for practical lithium-sulfur cells: high-loading sulfur cathodes, thin lithium-metal anodes, and lean electrolyte conditions," Energy Materials 6, 600062 (2026) (open-access review) — doi.org/10.20517/energymater.2026.51
- Manthiram, Fu and Su "Challenges and Prospects of Lithium-Sulfur Batteries," Accounts of Chemical Research 46, 1125-1134 (2013) (abstract checked) — doi.org/10.1021/ar300179v
- Seh, Sun, Zhang and Cui "Designing high-energy lithium-sulfur batteries," Chemical Society Reviews 45, 5605-5634 (2016) (abstract checked) — doi.org/10.1039/c5cs00410a
- Hagen et al. (Fraunhofer IWS and ISI) "Lithium-Sulfur Cells: The Gap between the State-of-the-Art and the Requirements for High Energy Battery Cells," Advanced Energy Materials 5, 1401986 (2015) (abstract checked) — doi.org/10.1002/aenm.201401986
- Neef and Rugerri (Fraunhofer ISI) "Where does Europe stand on lithium-sulfur batteries? Research activities and start-ups in this alternative battery technology," 24 June 2026 — isi.fraunhofer.de
- Li-S Energy Limited (ASX: LIS) "Li-S Energy achieves close to 500Wh/kg lithium-sulfur cell performance," ASX Announcement, 28 October 2024 (PDF) — announcements.asx.com.au
- Robinson et al. (Faraday Institution LiSTAR programme) "2021 roadmap on lithium sulfur batteries," Journal of Physics: Energy 3, 031501 (2021) (abstract only checked) — doi.org/10.1088/2515-7655/abdb9a
16. Claim-to-source audit
| Claim in the text | Basis | Label |
|---|---|---|
| The theoretical capacity of 1,675 mAh/g, theoretical energy density of 2,600 Wh/kg, lithium metal at 3,860 mAh/g and average discharge voltage of about 2.15 V; the conversion mechanism from S8 through liquid polysulfides (Li2Sn, 4 ≤ n ≤ 8) to solid Li2S; the overall reaction S8 + 16Li+ + 16e- to 8Li2S; sulfur and Li2S being insulators (about 10^-30 and 10^-13 S/cm) and a volume change of about 80%; polysulfides dissolving in ether electrolytes and causing the shuttle effect; lithium's standard potential of -3.04 V, SEI instability, dendrites and dead lithium; ether electrolytes (DOL, DME, LiTFSI, LiNO3) as standard, with volatility and flammability as weaknesses; efficiency above 99% with LiNO3; the 2009 ordered mesoporous carbon; the practical conditions (sulfur loading above 5 mg/cm², sulfur content above 60 wt%, areal capacity of 2 to 4 mAh/cm², energy density of 10 to 15 mWh/cm², N/P below 5, E/S below 5 µL/mg, E/C below 5 µL/mAh); the apparent stabilization from excess electrolyte, thick lithium and low loading; the rise in polysulfide concentration, diffusion limitation and worse wetting under lean electrolyte; the shortened life when high loading, thin lithium and lean electrolyte are combined, with reports of 200 cycles (12 mg/cm², E/S 4 µL/mg, C/5) and 500 cycles (6 mg/cm², C/2); and lithium-ion batteries exceeding 300 Wh/kg and 700 Wh/L | Chan et al. 2026 (review)Reference 1 https://doi.org/10.20517/energymater.2026.51 | Sourced |
| That sulfur accepts up to two electrons per atom at about 2.1 V versus Li/Li+, the theoretical capacity of 1,675 mAh/g, the theoretical energy density of about 2,600 Wh/kg, the change between soluble polysulfides and insoluble sulfides, and the cycle-life and efficiency problems that prevent use in commercial cells | Manthiram et al. 2013 (abstract)Reference 2 https://doi.org/10.1021/ar300179v | Sourced |
| That the electrochemistry, challenges and solutions of Li-S batteries (encapsulation in carbon hosts, polymeric and inorganic hosts, lithium sulfide cathodes, polysulfide catholytes, separator modification and lithium-metal protection) are reviewed | Seh et al. 2016 (abstract)Reference 3 https://doi.org/10.1039/c5cs00410a | Sourced |
| That cell energy and cost of 18650 Li-S cells were calculated for various sulfur loads, utilizations and electrolyte-to-sulfur ratios to find the values needed to beat the Panasonic NCR18650B (about 240 Wh/kg), and compared with statistics from 274 papers to show the gap with research | Hagen et al. 2015 (abstract)Reference 4 https://doi.org/10.1002/aenm.201401986 | Sourced |
| That Li-S is a promising high-energy technology not yet broadly commercialized; that a broadly available automotive-grade cell for the mass market is not visible; that the first markets are UAVs, aviation, space and defense; the distribution of companies (Lyten, Zeta Energy, Solidion, NexTech, Sion Power, Conamix, Theion, Alteva, Gelion Europe/Oxlid, CATL, LGES, Samsung SDI, SVOLT, GNE); the positioning of CATL, LGES and Samsung SDI; the caution that companies' figures refer to different levels; Lyten (UAV deliveries, the planned 10 GWh per year, the Northvolt acquisition, claims of up to 50% lighter than NMC and 75% lighter than LFP); Zeta Energy and Stellantis (2024 agreement, around 2030); LGES (2026 sulfur cathode for all-solid-state, about 1,500 mAh/g); SVOLT (2022, 20 Ah, 350 to 400 Wh/kg); Solidion (380 Wh/kg, target 450); GNE (700 Wh/kg); and Ark Power (over 500 Wh/kg, coin cell) | Fraunhofer ISI, 24 June 2026Reference 5 https://www.isi.fraunhofer.de/en/blog/themen/batterie-update/lithium-schwefel-batterien-europa-forschung-start-ups.html | Sourced (includes company claims and plans) |
| That Li-S Energy claims 498 Wh/kg on first discharge and 456 Wh/kg after formation cycling for its semi-solid GEN3 full-size 10 Ah cells (28 October 2024), its statement that first-discharge values are always significantly higher than practical performance, and that it targets drones, defense and electric aviation | Li-S Energy ASX disclosureReference 6 https://announcements.asx.com.au/asxpdf/20241028/pdf/069n1jdcvn96gc.pdf | Sourced (company claim) |
| That Li-S is placed among the more commercially mature of the next-generation batteries beyond Li-ion, and the purpose of the LiSTAR programme | Robinson et al. 2021 (abstract)Reference 7 https://doi.org/10.1088/2515-7655/abdb9a | Sourced |
| Sulfur's theoretical capacity of about 1,672 mAh/g, the Li2S formula mass of 45.94, about 1,167 mAh/g per total mass of Li and S, a theoretical energy of about 2,450 to 2,570 Wh/kg (2.1 to 2.2 V), and the volume change from 15.5 cm³/mol for S to 27.7 cm³/mol for Li2S (about +79%) | Our calculation. Premises: atomic masses (S 32.06, Li 6.94), the Faraday constant (26,801 mAh/mol), densities (S8 2.07, Li2S 1.66 g/cm³, standard values) and an assumed voltage of 2.1 to 2.2 V. Material-basis values | Our calculation |
| The estimate of energy density versus E/S ratio (336, 249, 151 and 108 Wh/kg and 450, 315, 180 and 126 Wh/L at E/S of 3, 5, 10 and 15 µL/mg); electrolyte making up about 65% of active material plus electrolyte plus inactive parts (E/S 5); electrolyte volume about ten times the sulfur volume; about 13% of the theoretical value even at E/S 3 | Our calculation. Premises (all assumed): sulfur utilization 1,000 mAh/g, sulfur content 70 wt%, remainder at 2.0 g/cm³, lithium 3,861 mAh/g with N/P = 2 and 0.534 g/cm³, electrolyte 1.1 g/cm³, inactive parts 1.0 g/Ah (volume excluded), 2.1 V. Not the design or a prediction of a real cell | Our calculation |
| That numbers cannot be compared unless sulfur loading, sulfur content, electrolyte amount and N/P ratio are aligned; the contradiction that the division of labor among materials (carbon host, binder, catalyst, separator layer) adds weight; the anode degradation by polysulfides specific to lithium-sulfur; the four questions; the trade-off among mass, volume and lifetime; and the reading that competition is harder in passenger cars | This article's own organization and commentary based on published material. Not views expressed by any company or institution | Commentary |
| Cell-performance values measured and published by an independent third party, companies' published E/S ratios and cycle life, practical values for a standard liquid-electrolyte Li-S cell, an independent safety assessment of this battery, and companies' mass-production records | Not stated here because no published primary source within this investigation could confirm them | Commentary |
| Whether plans such as Lyten's gigafactory or the passenger-car use around 2030 will be realized | Company plans, not results (ISI's summary); an outlook that has not been confirmedReference 5 https://www.isi.fraunhofer.de/en/blog/themen/batterie-update/lithium-schwefel-batterien-europa-forschung-start-ups.html | Not yet confirmed |
| That Figs. 1, 2, 3, 5 and 6 are explanatory drawings, not real reaction paths, cell cross-sections, design drawings or measurement results, and that the hero image and Fig. 4 are AI-generated images | A note by this article | Commentary |
Last updated 10 October 2026. Sources are limited to primary material (peer-reviewed papers, an open-access review, a research institute's survey and a company's stock-exchange disclosure). Company announcements are treated as company claims and kept apart from independent surveys. Because the article includes structural readings and materials-design interpretations, those are marked as Commentary and kept separate from sourced fact. Independent third-party measurements of cell performance, companies' published E/S ratios and cycle life, practical values for a standard liquid-electrolyte cell, an independent safety assessment and companies' mass-production records are not stated here because no published primary source could confirm them. The estimate in Chapter 8 is a calculation under assumptions and not the design or a prediction of a real cell. All figures are explanatory concept graphics. Figs. 1, 2, 3, 5 and 6 are vector drawings; the hero image and Fig. 4 are AI-generated images, and none of them shows a real cross-section, measured data or physical product.