TECHNOLOGY EXPLAINER
Redox Flow Batteries
— Sizing power and energy separately: what matters in the liquid and the membrane
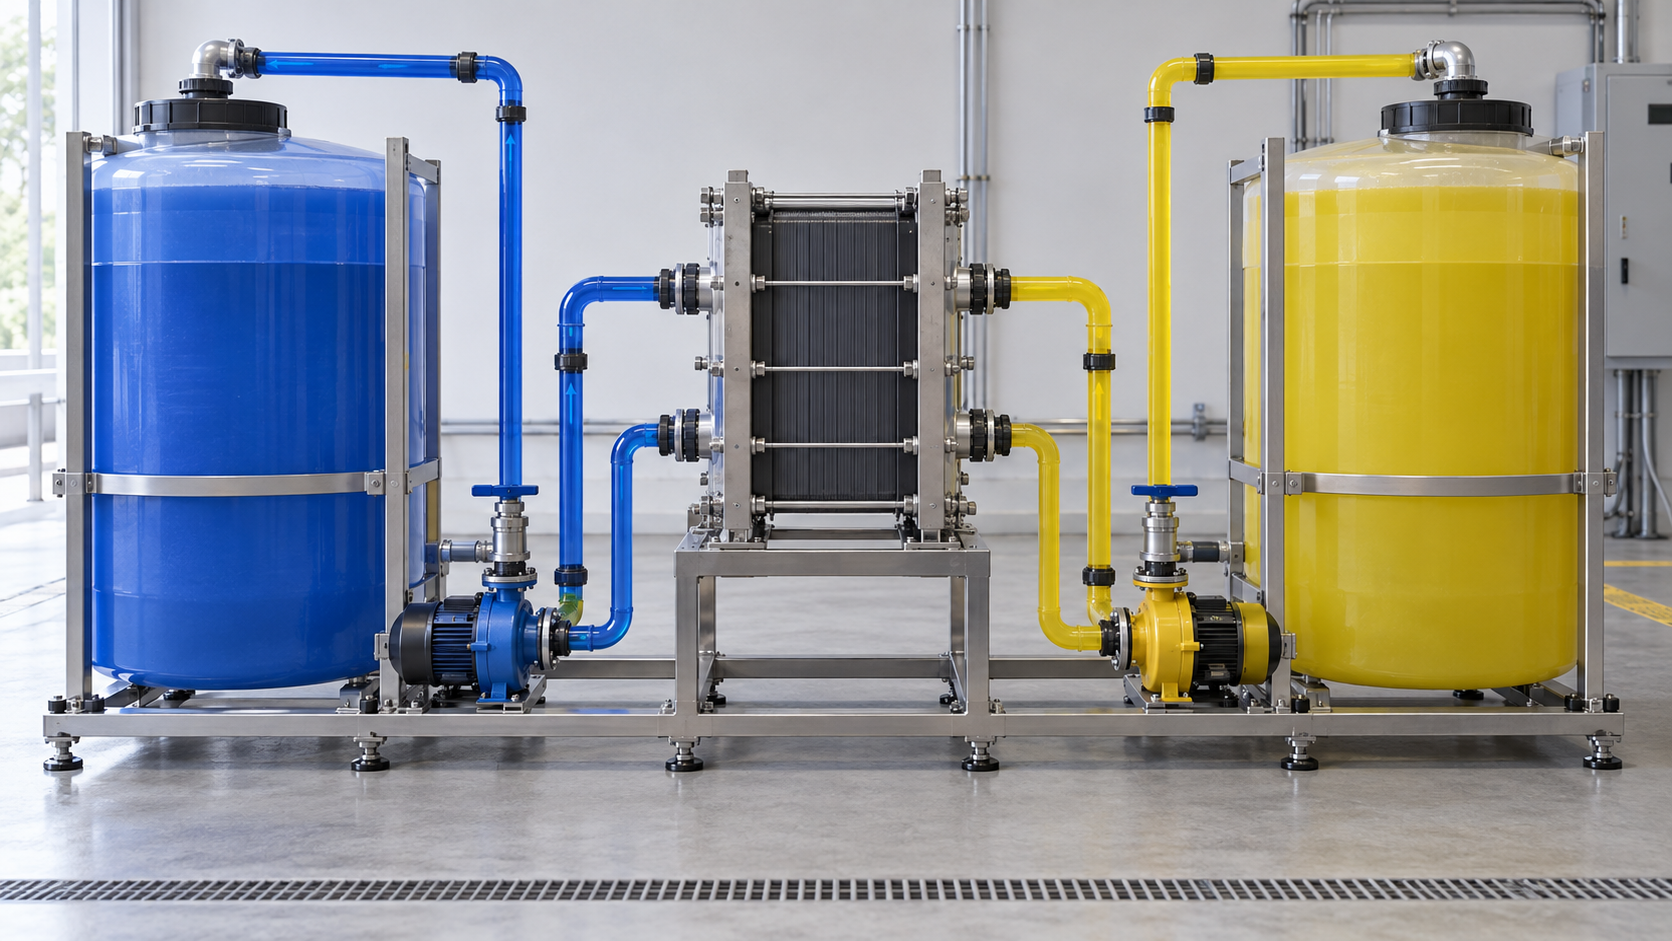
A redox flow battery keeps the active material dissolved in liquid in external tanks and pumps it through a cell stack to charge and discharge. Power is set by the stack and energy by the volume of liquid, so the two can be designed independently. Vanadium chemistry dominates, and Sumitomo Electric Industries has operated a 15 MW × 4 h (60 MWh) system in Hokkaido. On the other hand, Pacific Northwest National Laboratory (PNNL) in the United States estimates the grid-level round-trip efficiency at about 65% (about 83% for lithium-ion LFP), and its installed-cost estimate for 100 MW and 10 hours is not below that of LFP. This article takes a materials engineer's view of what is hard about the electrolyte, the membrane and the electrodes.
- What a redox flow battery is (the short version)
- How it works: tanks separated from the stack
- Our calculation: what grows when power is fixed and duration is extended
- A materials engineer's view 1: is the electrolyte really "non-degrading"?
- A materials engineer's view 2: the ion-exchange membrane trade-off
- Electrodes, bipolar plates and stack design
- Beyond vanadium: iron-chromium, zinc-bromine, iron and organic systems
- Efficiency and cost structure
- Track record: what official sources confirm
- Limits, and what could not be confirmed
- How to read evaluations and standards
- Glossary
- References
- Claim-to-source audit
Sourced = stated in a published source (source linked)
Our calculation = a value this article calculated from stated assumptions
Not yet confirmed = a plan, target or outlook for which no result has been confirmed
Readings about materials and structure are marked as commentary. Inference marks a reading that was not confirmed in a primary source.
Manufacturer values are labelled "manufacturer's stated value" with the object (module, cell, system) and conditions. PNNL figures are estimates based on developer surveys, not market prices.
This article is a technical explainer. It is not advice on operating or safety of equipment, or on investment or procurement.
1. What a redox flow battery is (the short version)
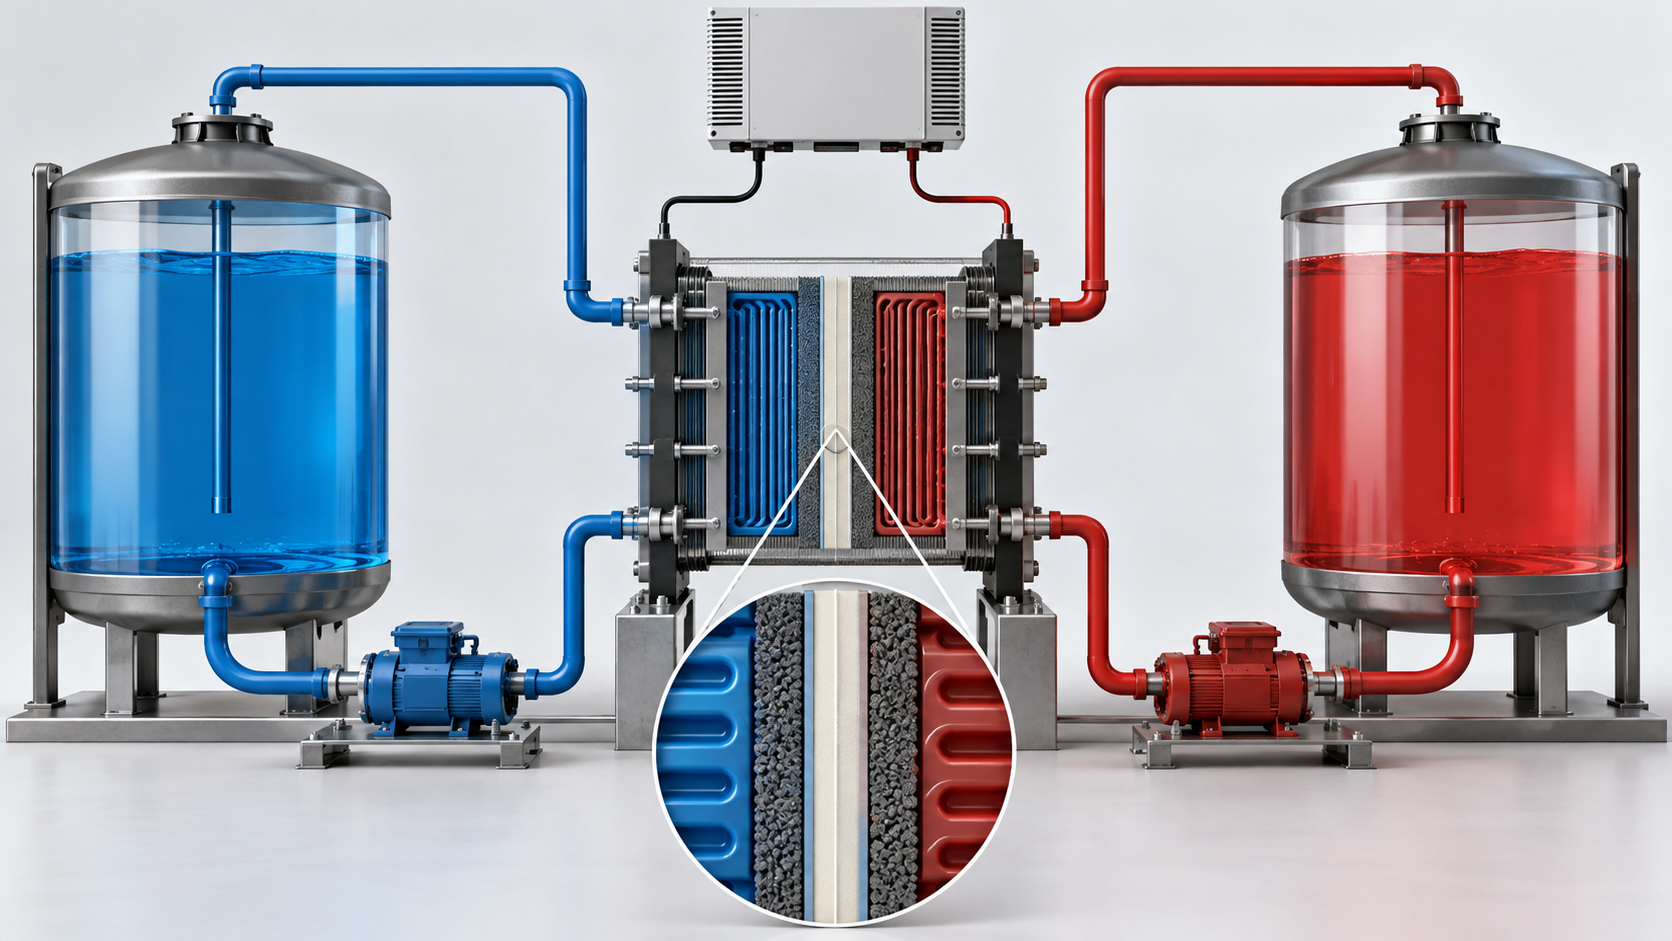
- How it works: Sumitomo Electric Industries describes it as a storage battery charged and discharged by redox reactions of ions in an aqueous solution containing the active material. The electrolyte sits in external positive and negative tanks and is pumped through the cell. Capacity (kWh) is set by the amount of vanadium in the tanks and output (kW) by the cell size (area × number of cells), so output and capacity can be designed independently Sourced [Ref. 3].
- Where it stands: vanadium/vanadium (V/V) chemistry is the worldwide mainstream Sourced [Ref. 3]. Large grid-connected examples include 15 MW / 60 MWh at Hokkaido Electric Power (online December 2015) [Ref. 2] and 100 MW / 400 MWh in Dalian, China (a Chinese Academy of Sciences article reported the grid connection in 2022) [Ref. 11].
- Weak points: because of solubility limits in water, energy density is lower than in other batteries (Sumitomo Electric paper) Sourced. In PNNL's estimate, round-trip efficiency is lower than LFP's, and the price and purity of vanadium and the ion-exchange membrane (fluorinated, such as Nafion) drive cost and performance [Ref. 4, 15].
2. How it works: tanks separated from the stack
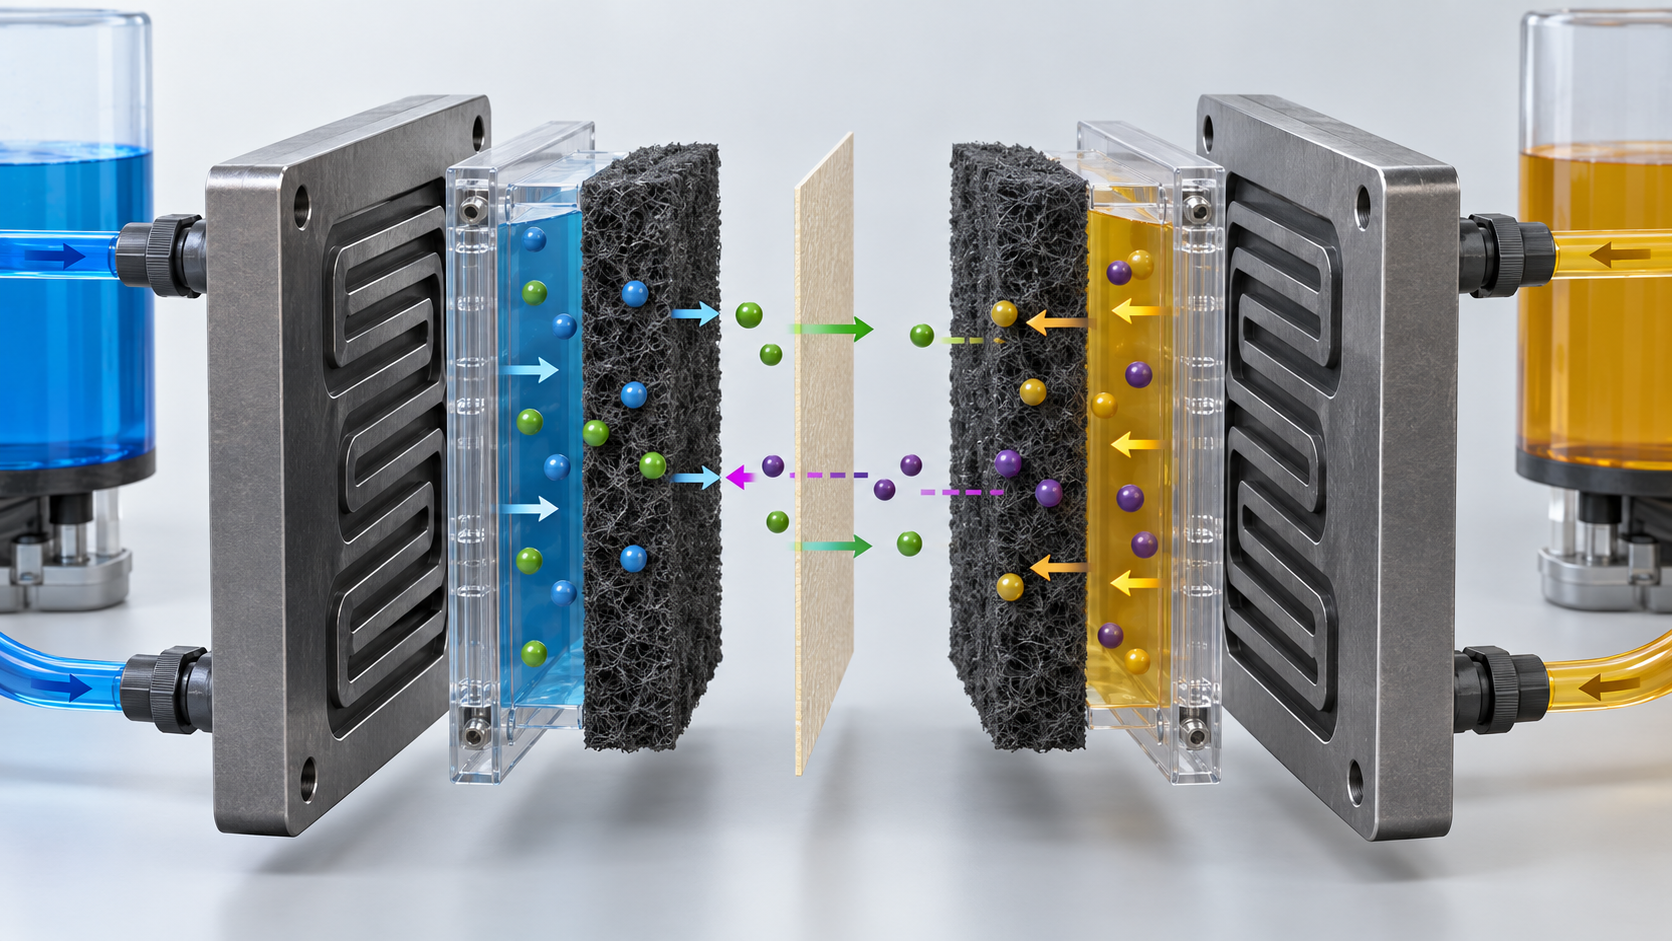
In the vanadium system, only the oxidation state of vanadium changes at both electrodes. Sumitomo Electric's technical paper gives the reactions as follows Sourced (charging is to the right) [Ref. 3].
- Positive electrode: VO²⁺ + H₂O ⇄ VO₂⁺ + 2H⁺ + e⁻
- Negative electrode: V³⁺ + e⁻ ⇄ V²⁺
The measured electromotive force is about 1.4 V Sourced. Because the cell reaction is only a change of ion valence, with no electrode dissolution or plating, Sumitomo Electric says there is in principle no limit on the number of charge-discharge cycles Sourced. It adds that because liquid is fed to every stack from one tank, the state of charge is the same across stacks, and the state of charge can be read accurately from the electrolyte potential (Sumitomo Electric product page and technical paper) [Ref. 1, 3].
View the original SVG schematic and exact annotations
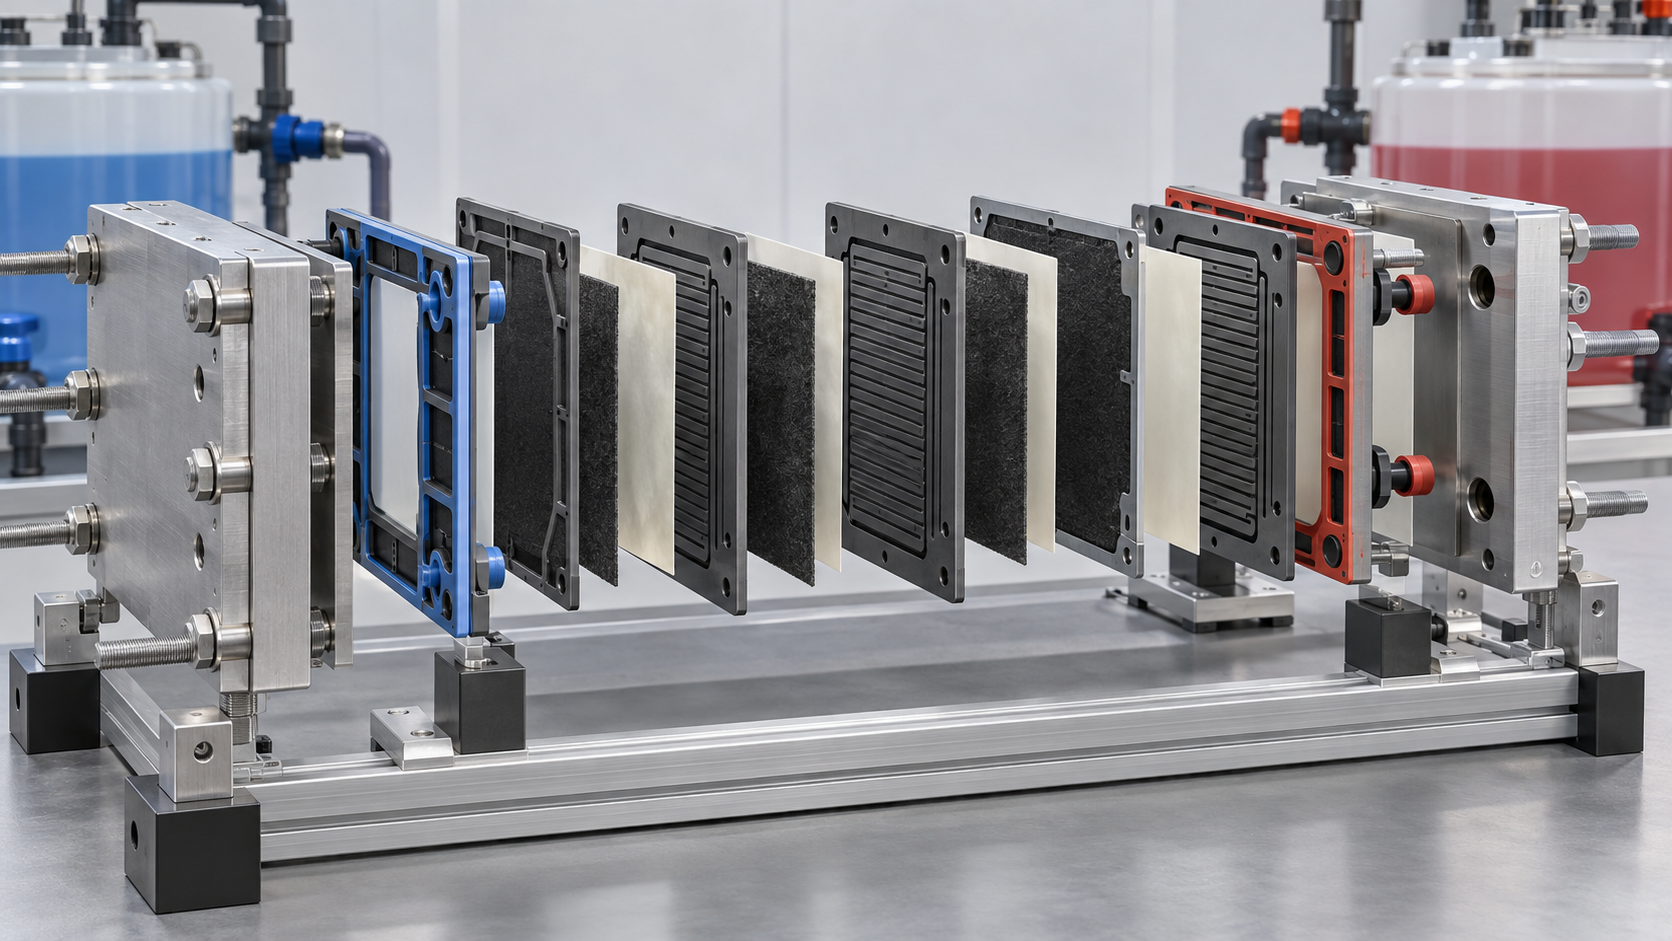
The inside of the stack is flat electrodes, an ion-exchange membrane and bipolar plates stacked together. The electrodes are carbon materials whose shape and surface treatment are chosen to suit the liquid. The membrane lets the charge-carrying ion through while keeping the positive and negative active materials apart [Ref. 3].
View the original SVG schematic and exact annotations
3. Our calculation: what grows when power is fixed and duration is extended
This estimates the electrolyte volume when the duration is extended at a fixed output of 10 MW Our calculation.
- Assumptions: vanadium concentration 1.6 mol/L on both sides, cell voltage 1.4 V, one electron per vanadium ion, equal positive and negative tank volumes, and a usable state-of-charge (SOC) window of 80% (10 to 90%). The 1.6 mol/L is this article's assumption; no official figure for a real plant could be confirmed.
- Calculation: 1 L of liquid holds 1.6 × 96,485 C = 154,376 C. Multiplied by 1.4 V this is 216,126 J = 60.0 Wh per litre of one electrolyte. For both tanks together it is 30.0 Wh/L. With an 80% window this is about 24.0 Wh/L (= 24.0 kWh/m³).
- Result: 10 MW × 2 h (20 MWh) needs about 833 m³; 4 h (40 MWh) about 1,666 m³; 6 h (60 MWh) about 2,499 m³; 10 h (100 MWh) about 4,164 m³. The output (stack) stays the same and only the liquid volume grows in proportion to duration.
- Cross-check: Sumitomo Electric's technical paper gives 23.5 kWh/m³ as an energy density "equivalent to the V/V system" for a small Ti/Mn cell (9 cm² electrode, laboratory test) Sourced. Using it, 10 MW × 4 h comes to about 1,702 m³, within about 2% of the calculation above.
Assumptions and limits: this is close to an upper bound, the theoretical charge of the liquid times the SOC window; it ignores voltage drop, auxiliaries and tank margin. PNNL says that to hold rated power across the full SOC range some designs carry more energy in the liquid than the rated energy: 25% more for mixed-acid and 82% more for sulfuric-acid electrolyte Sourced [Ref. 4]. The 80% window above matches the mixed-acid case (1/0.8 = 1.25); for a sulfuric-acid system with a 20-75% window the liquid volume would be about 1.5 times larger (1.82 / 1.25 = 1.46) Our calculation.
Invinity's data sheet (VS3-022, January 2023 edition) gives a rated 230 kWh per module (a 6,058 × 2,438 × 2,591 mm container) and a flooded weight of 24,600 kg (manufacturer's stated values) Sourced. From these one can calculate about 9.3 Wh/kg and about 6.0 kWh/m³ of external volume Our calculation (230,000 Wh / 24,600 kg; external volume 38.3 m³). These are values for the whole container, not for the electrolyte or a battery pack, so they should not be compared directly with other batteries. The same data sheet lists continuous discharge of "29 kW for 8 h, 52 kW for 4 h, 75 kW for 2.25 h" per module Sourced. Multiplying out, the energy delivered is 232 kWh, 208 kWh and 169 kWh, so the higher the power, the less energy can be taken out Our calculation (8 h × 29 kW = 232, 4 h × 52 = 208, 2.25 h × 75 = 169; how these relate to the rated 230 kWh is not stated in the data sheet and could not be confirmed) [Ref. 9].
4. A materials engineer's view 1: is the electrolyte really "non-degrading"?
Sumitomo Electric says "the electrolyte itself also does not degrade" (its product page; the company's design life is 20 years) Sourced [Ref. 1]. Invinity's data sheet likewise calls it an aqueous solution that never degrades, yet its specification lists annual capacity degradation below 0.5% and cycle life above 20,000 cycles (manufacturer's stated values) Sourced [Ref. 9]. "Does not degrade" and "capacity falls slightly each year" are about different things.
PNNL quotes developer reports of electrolyte degradation of "1% after 7,000 cycles on average", "1% over 25 years" and "minimal degradation beyond 100,000 cycles" (all developers' claims) Sourced [Ref. 4]. A peer-reviewed review (Xu Lin et al., 2026) names the causes of capacity fade as (1) a volume imbalance between the positive and negative liquids from uneven transport across the membrane, (2) inactivation and decomposition of the active species, (3) electrode degradation (including hydrogen and oxygen evolution) and (4) a valence imbalance from side reactions. It says the volume imbalance can be reversed by remixing and the valence imbalance by chemical reduction or electrolysis Sourced [Ref. 7].
There is experimental evidence too. Wang et al. (2026) report that in a small vanadium cell (Nafion 212, 1.70 M on both sides, 200 mA/cm², 28 ± 3 °C) capacity fell by 67.9% over 400 cycles, but replacing the electrolyte restored both capacity and voltage efficiency completely Sourced [Ref. 6]. In that experiment the loss was not because the vanadium was destroyed but because the positive/negative balance had been lost.
From the materials side, "the liquid lasts almost forever" reads as saying that the vanadium ions are chemically hard to decompose, not that no management (balance adjustment) is needed to keep operating (commentary).
Electrolyte composition and the usable window
- Mixed acid versus sulfuric acid: PNNL notes that mixed-acid electrolytes have a wider state-of-charge window (10-90%, against 10-80% or 20-75% for sulfuric acid) and higher concentration, giving about twice the energy density Sourced. It also notes that at low SOC discharge performance suffers, while at high SOC bipolar-plate corrosion and gas evolution shorten the life of the stack and electrolyte [Ref. 4].
- Precipitation: at extreme SOC and temperature the active species can precipitate in both liquids, which mixed acid mitigates, according to PNNL Sourced. Invinity's data sheet gives an ambient temperature range of -5 to 45 °C (manufacturer's stated value) [Ref. 4, 9].
- Electrolyte cost: in PNNL's 2021 estimate, the electrolyte cost on the energy side falls, with low-grade (low-purity) vanadium pentoxide and a 10-90% SOC window, from US$180/kWh to US$105/kWh for mixed acid; for sulfuric acid (20-75% window) it is US$150/kWh Sourced. A low case that assumes vanadium recovered from coal ash is US$50/kWh (PNNL's assumption) [Ref. 4].
- Raw-material supply: USGS puts world vanadium mine production in 2025 at about 110,000 tonnes (estimate), of which China is about 82,000 tonnes. More than 90% of U.S. vanadium consumption is as an alloying agent in steel. The average Chinese vanadium pentoxide price in 2025 was US$5.02 per pound (US$5.44 in 2024). USGS lists high capital cost and limited supply of high-purity vanadium feedstock as challenges for flow batteries Sourced [Ref. 15]. PNNL also describes electrolyte-leasing models, which move the cost into operating expense, and vertical integration from vanadium supply to electrolyte and stacks under one company [Ref. 4].
5. A materials engineer's view 2: the ion-exchange membrane trade-off
Chemours describes the ion-exchange membrane (IXM) as a key enabler of flow batteries: it prevents mixing of the positive and negative electrolytes while allowing non-reactive ionic species to pass. The company says ionic conductivity is the most important factor, with a long lifetime and chemical and physical resistance also expected Sourced. Nafion is a copolymer of tetrafluoroethylene (TFE) and perfluorinated monomers carrying sulfonic acid groups; thicknesses range from 25 to 210 µm, and PTFE-reinforced membranes exist (Chemours product overview) [Ref. 5].
Across the four points in the figure (NR211, NR212, N115 and N117), the thicker the membrane, the higher the areal resistance (45 to 220 mΩ·cm²) and the lower the VO²⁺ transport (6.3 to 0.8 ×10⁻⁴ cm/min) (Chemours stated values) Sourced. Higher resistance means a larger voltage loss at a given current, which lowers voltage efficiency. Higher transport means more vanadium crossing the membrane, causing self-discharge and volume drift. Choosing a membrane is a balance between the two (commentary).
- Which membranes are used: Wang et al. state that almost all commercially available membranes for acidic aqueous flow batteries are Nafion-based, and that large water channels and poor ion selectivity are the problem (the authors' statement) Sourced [Ref. 6]. The membrane material in Sumitomo Electric's real systems could not be confirmed from its public material.
- Moving away from fluorinated membranes: PNNL lists using a microporous separator instead of a fluorinated membrane as a cost-reduction driver (developer information) Sourced. ESS Tech's iron flow battery also uses a porous separator [Ref. 4, 12].
- Working around the membrane limit with the electrolyte: Wang et al. report that "balanced-state electrolytes", with asymmetric concentration and valence on the two sides, reduced capacity fade for a 15 µm reinforced membrane (NC700) to 0.015% per cycle over 1,000 cycles, from 0.061% per cycle for a 183 µm Nafion 117 with a conventional electrolyte. In the same study, with balanced-state electrolytes a 51 µm Nafion 212 reached a coulombic efficiency of 97.79% (50 mA/cm²), above the 95.90% of Nafion 117 with a conventional electrolyte. All of this is from small-cell experiments, and the authors estimate that the capital cost of a 1 MW / 4 MWh system could fall by more than 41.7% (the authors' estimate) Sourced [Ref. 6].
Nafion is a perfluorosulfonic acid (PFSA) polymer with carbon-fluorine bonds in both backbone and side chains. Because it contains –CF₂– units, it appears to fall within the OECD definition that our series' explainer on fluoropolymers and PFAS cites (a fluorinated substance with a fully fluorinated methylene group) (this article's reading). That explainer describes the EU PFAS restriction proposal, as of October 2026, as "under evaluation by the committees of the European Chemicals Agency (ECHA), neither adopted nor in force". How membranes for flow batteries are treated within that proposal (whether an exemption is needed) could not be confirmed from official material.
For a materials engineer there are two questions. (1) Performance of alternative membranes: can hydrocarbon or microporous membranes survive thousands to tens of thousands of cycles in acidic, oxidizing liquid? (2) Handling after use: can the membrane be recovered separately from the electrolyte and removed from the stack easily? (PNNL writes that at end of life the electrolyte and stacks can be removed separately [Ref. 4].)
6. Electrodes, bipolar plates and stack design
- Electrodes: carbon materials are the norm, with shape and structure chosen for the redox system and surface modification to raise reactivity (Sumitomo Electric paper) Sourced.
- Flow fields: for low-reactivity systems such as Fe/Cr, flow-through designs that force liquid through the electrode are effective; for highly reactive systems, flow-by designs that rely on diffusion with low pressure loss are also used. Designs that put flow channels in the bipolar plate, following fuel-cell practice, have also been proposed Sourced. For higher power, low internal resistance and low pressure loss are desirable [Ref. 3].
- Stack voltage and shunt current: PNNL describes a design in which liquid between stacks connected in series can carry leakage current (shunt current), so each series block has its own tank and each stack is held to about 50 V DC (developer information) Sourced. One developer reports a nominal 1,000 V DC with a move to 1,500 V DC planned [Ref. 4].
- Life and replacement: PNNL puts the calendar life of stacks at 10 to 20 years (most estimates in the middle) and uses 12 years in its assessment. Pump mean time between failures is 12 to 13 years, but pumps are normally replaced every 10 years in scheduled maintenance. One developer reports replacing 20% of stacks after 10 years to keep agreed performance, and another replaces all of them (developers' claims) Sourced [Ref. 4]. Sumitomo Electric wrote that its 15 MW × 4 h system in Hokkaido, after a three-year demonstration, kept operating with no notable change in discharge capacity or system efficiency, and that its 20-year design life was being verified (as of 2019). It also says the 15 MW system can run at twice its rating, 30 MW, for short-period fluctuations Sourced [Ref. 3].
7. Beyond vanadium: iron-chromium, zinc-bromine, iron and organic systems
Many chemistries besides vanadium have been studied and some built at scale. The table gives what could be confirmed and where each stands. It is not a ranking of chemistries.
| System | Active materials | What could be confirmed | Status within what was confirmed |
|---|---|---|---|
| Vanadium / vanadium | V²⁺/V³⁺ and V⁴⁺/V⁵⁺ | Because both sides use the same element, mixing through the membrane does not cause "capacity loss" and side reactions are few (Sumitomo Electric) [Ref. 3] | The worldwide mainstream. Volume and valence drift is nevertheless reported in research (section 4) |
| Iron / chromium | Fe²⁺/Fe³⁺ and Cr²⁺/Cr³⁺ | Proposed by NASA in the 1970s and developed in Japan in the 1980s. Sumitomo Electric built a 60 kW × 8 h system with Kansai Electric Power (1989) [Ref. 3]. EnerVault began a field demonstration of 250 kW / 1 MWh in California in 2014, with a more than tenfold reduction in side-reaction rates and "dynamic rebalancing" (the company's presentation) [Ref. 13] | EnerVault's later business status could not be confirmed within this article's scope |
| Zinc / bromine | Zn and Br₂/Br⁻ | Developed in Japan's national project in the 1980s together with Fe/Cr, Zn/Cl and NaS [Ref. 3] | Australia's Redflow Limited entered voluntary administration on 23 August 2024 (ASX disclosure). The reasons were not checked here [Ref. 14] |
| Iron (all-iron) | Fe²⁺/Fe³⁺ and Fe/Fe²⁺ (iron plating) | ESS Tech describes Fe²⁺ oxidized to Fe³⁺ at the positive electrode and reduced to iron metal at the negative, with a porous separator limiting mixing. It uses its own "Proton Pump" for pH and says a 20,000-cycle design has no capacity fade, but states that this rests on lab-scale results [Ref. 12] | Revenue for the year to December 2025 was US$1.6 million (US$6.3 million the year before) and net loss US$63.4 million. The company discloses substantial doubt about its ability to continue as a going concern. It no longer offers Energy Warehouse or Energy Center and focuses on Energy Base [Ref. 12] |
| Organic (quinone-based and others) | Anthraquinones plus a halogen, among others | Huskinson et al. (2014) reported a metal-free organic-inorganic aqueous flow battery. Sumitomo Electric describes quinones as a plant-derived, safe system expected to be cheap to make in future [Ref. 8, 3] | The state of commercialization could not be confirmed within this article's scope |
| Titanium / manganese | TiO²⁺/Ti³⁺ and Mn²⁺/Mn³⁺ | Under development at Sumitomo Electric (2019). The EMF is about 1.4 V, the same as the V system. The challenge is that Mn³⁺ disproportionates to solid MnO₂ and agglomerates; mixing in Ti suppresses it, and a 10 kW-class stack ran stably for more than 140 cycles [Ref. 3] | A research-stage report (as of 2019). Later developments could not be confirmed |
Table 1 Main flow-battery chemistries other than vanadium (Sourced; sources in each cell). Company statements are the company's claims and have not been verified by third parties.
8. Efficiency and cost structure
| Item | Vanadium RFB | LFP (lithium-ion) |
|---|---|---|
| Round-trip efficiency (DC-DC, including auxiliaries and DC-DC conversion) | 71% | 89.55% |
| Round-trip efficiency (AC-AC, including inverter and transformer) | 65% | 82.59% |
| Total installed cost (100 MW, 10 h, 2021) | US$385/kWh | US$356/kWh |
| Assumed calendar life | 12 years for stacks (electrolyte effectively unlimited) | About 10-15 years (typical range for battery systems) |
Table 2 PNNL's 2022 report (estimates for 2021) [Ref. 4]. Sourced. These are "derived point estimates" from developer surveys, not market prices or bids. The transformer-level round-trip efficiency assumes 0.98 each way for inverter and transformer.
PNNL separates power-side costs (DC-DC converter 60, PCS 73, EMS 7.8, grid integration 25 US$/kW) from energy-side costs (storage block, balance of system, system integration, EPC and project development). The left bars of Fig. 6 add up PNNL's line items for 10 MW as a function of duration (the power-side total of US$165.8/kW divided by hours and added) Our calculation. The longer the duration, the more the power-side cost is diluted and the lower the energy-side unit cost, so US$762/kWh at 2 hours becomes US$408 at 10 hours and US$329/kWh at 100 hours. In the same PNNL estimate, however, the 100 MW, 10-hour total is US$356/kWh for LFP and US$385/kWh for vanadium RFB, so it is not an estimate in which RFB comes out cheaper Sourced (the left 408 and right 385 are for different scales, 10 MW and 100 MW, and are not like-for-like). RFB would gain at still longer durations or if electrolyte cost fell sharply (commentary).
To deliver 1 MWh to the grid takes 1 / 0.65 = 1.538 MWh of charging at 65% round-trip efficiency and 1 / 0.8259 = 1.211 MWh at 82.59%, a difference of 0.328 MWh Our calculation. At a charging price of US$20/MWh that is about US$6.6/MWh; at US$50/MWh, about US$16.4/MWh.
Assumptions and limits: the efficiencies are PNNL's 2021 estimates (AC-AC, transformer level) and change with real operating conditions (power, temperature, SOC). The charging prices are this article's assumptions. Levelized cost of storage (LCOS) and investment judgments are covered in our series' explainer on storage economics.
9. Track record: what official sources confirm
| Party | Project / content | What could be confirmed |
|---|---|---|
| Sumitomo Electric Industries | Hokkaido Electric Power, Minami-Hayakita substation: 15 MW / 60 MWh | Under the Ministry of Economy, Trade and Industry (METI)'s large-scale energy storage urgent demonstration project. Online December 2015; demonstration period fiscal 2013-2018, with operation continuing afterward. Used for short- and long-period fluctuation suppression and for "down-margin" shortage countermeasures [Ref. 2] |
| Sumitomo Electric Industries | Hokkaido Electric Power Network: 17 MW / 51 MWh | Online April 2022. Short-period fluctuation suppression and down-margin shortage operation [Ref. 2] |
| Sumitomo Electric Industries | San Diego Gas & Electric (SDG&E), USA: 2 MW / 8 MWh | A New Energy and Industrial Technology Development Organization (NEDO) project. Online March 2017. The charge-discharge section (cell stack) obtained the first UL safety certification, and the system first entered the CAISO wholesale market in December 2018. A 500 kW / 4 MWh system followed in September 2024 [Ref. 2] |
| Invinity Energy Systems | Product: VS3 (2023 data sheet) | 230 kWh rated per module, maximum DC output 78 kW, cycle life above 20,000, annual capacity degradation below 0.5%, maximum DC round-trip efficiency 75%, UL 1973 listing and UL 9540A testing, among others (manufacturer's stated values) [Ref. 9] |
| Invinity Energy Systems | 2025 annual report | More than 2,000 batteries delivered and more than 9 GWh dispatched (company statement). Copwood in the UK (20.7 MWh) is planned to connect to the grid in late 2026 Not yet confirmed. The company says it was selected for a Swiss project of up to 1.5 GWh Not yet confirmed [Ref. 10] |
| Dalian, China | Dalian Flow Battery Energy Storage Peak-shaving Power Station: 100 MW / 400 MWh | A Chinese Academy of Sciences feature article (in its 2022 section) reports grid connection on 29 September and operation expected from mid-October. Approved by the National Energy Administration in April 2016, with a final plan of 200 MW / 800 MWh. The system was built by Rongke Power [Ref. 11] |
| Xinjiang, China (news reports) | 200 MW / 1,000 MWh | Operation has been reported (January and June 2026). The developer named differs between reports and this article could not confirm it from official material [Ref. 16, 17] |
Table 3 Operating and delivered projects, and plans. Each row is as stated in its source. The Sumitomo Electric case page lists a Minamikyushu project as "250 kW, 1,125 MWh"; the combination looks inconsistent, so this article does not use it.
10. Limits, and what could not be confirmed
(1) Membrane and electrolyte specifications of real systems
Which membrane (material, thickness) and which electrolyte composition (vanadium concentration, type of acid) are used in real Sumitomo Electric or Invinity systems could not be confirmed from public material. The concentration in section 3 is this article's assumption.
(2) Round-trip efficiency of real systems
Invinity's "maximum DC round-trip efficiency of 75%" is a DC-side maximum, not the grid-side (AC) efficiency. PNNL's 65% (AC-AC) is an estimate. No official measured values compared under identical conditions could be confirmed.
(3) Large Chinese projects
Dalian (2022) could be confirmed in a Chinese Academy of Sciences article, but the 200 MW / 1 GWh project in Xinjiang rests on news reports only, and they differ on the date and developer. It is not treated as a track record until official material is found.
(4) Regulation and alternative materials
This article did not confirm how the EU PFAS restriction proposal treats membranes for flow batteries. It also could not confirm long-term track records for alternative membranes.
(5) Division of labour with other explainers
Our series covers battery chemistries and comparisons in "Next-generation battery chemistries and comparison", economics in "Storage economics", grid-scale operation and safety in "Grid-scale battery energy storage systems", iron-air and zinc systems in "Long-duration storage", and PFAS in "Fluoropolymers and PFAS".
- Power is set by the stack and energy by the liquid volume, and the two are designed independently. Stretching 10 MW from 4 to 10 hours raises the liquid volume about 2.5 times (about 1,666 to 4,164 m³) Our calculation
- "The liquid does not degrade" means the active material is robust; the volume and valence balance does drift. In an experiment, replacing the liquid restored capacity Sourced
- The membrane is a thickness trade-off (45 to 220 mΩ·cm² against VO²⁺ transport of 6.3 to 0.8). The standard is fluorinated Nafion, tied to the PFAS debate Sourced
- In PNNL's estimate, round-trip efficiency is about 65% (about 83% for LFP) and the 100 MW, 10-hour installed cost is not below LFP's. Long duration and electrolyte cost are the keys Sourced
- Track records are confirmed for Sumitomo Electric, Invinity and Dalian, while the iron-flow and zinc-bromine companies have had business difficulties. This records how hard the business is, not a ranking of chemistries Sourced
11. How to read evaluations and standards
Before comparing which number is larger, align the basis of comparison in the following order. This is an editorial reading checklist, not a set of test conditions or acceptance limits prescribed by a standard.
- 1. What was measured?
- round-trip efficiency, power density, capacity and operating cost. Check the units and whether the result describes a material, component or complete system.
- 2. Under which conditions?
- cell, stack or system boundary, pump electricity, temperature and electrolyte concentration. Treat results under different conditions as separate results before comparing them.
- 3. The comparison trap
- Do not equate stack efficiency with system efficiency including pumps and auxiliaries.
- 4. What does the standard cover?
- Check the identifier, title, edition and scope in the issuing body’s material. Distinguish test methods, safety, interoperability and management requirements. Naming a standard alone does not establish that a test, conformity assessment or certification has been completed.
Keep a comparison note containing the object, units, conditions, sample count and variation, comparator, standard edition and unresolved points. Do not invent numerical conditions or acceptance limits from a public abstract of a standard.
12. Glossary
- Redox flow battery (RFB)
- A battery that stores liquid containing the active material in external tanks and pumps it through a cell stack to charge and discharge.
- VRFB
- Vanadium redox flow battery. Both sides use changes in vanadium oxidation state.
- Cell stack
- The stacked electrodes, ion-exchange membranes and bipolar plates where the reaction takes place. It sets the power (kW).
- Electrolyte
- The acid aqueous solution in which the active material (vanadium ions) is dissolved. Energy (kWh) follows the liquid volume.
- SOC (state of charge)
- The fraction of electricity stored in the battery. It can be read from the liquid potential.
- Crossover
- Movement of ions (such as vanadium) that should not cross the membrane between the positive and negative sides.
- Nafion
- Chemours' trade name for perfluorosulfonic acid (PFSA) membranes and resins.
- PFSA
- Perfluorosulfonic acid: a polymer with a carbon-fluorine backbone and side chains carrying sulfonic acid groups.
- Bipolar plate
- A plate that connects adjacent cells, carries current and separates the liquids. It corrodes more readily at high SOC.
- Flow-through / flow-by
- Pumping liquid through the electrode / flowing it along the electrode surface.
- Shunt current
- Leakage current carried by the liquid between stacks connected in series.
- Round-trip efficiency (RTE)
- Energy that can be discharged divided by the energy used to charge. DC-DC and AC-AC values differ.
- Storage block (SB)
- PNNL's cost category for the battery proper (for RFB, stacks, electrolyte and tanks).
- PCS
- Power conversion system: converts between battery DC and grid AC.
13. References
- Sumitomo Electric Industries"Features of redox flow batteries" (in Japanese) — sumitomoelectric.com
- Sumitomo Electric Industries"Redox flow battery: installation cases" (in Japanese) — sumitomoelectric.com
- Toshio Shigematsu (Sumitomo Electric Industries)"Recent development trends of redox flow batteries", SEI Technical Review No. 195, July 2019 (in Japanese, PDF) — sei.co.jp
- Pacific Northwest National Laboratory (PNNL)"2022 Grid Energy Storage Technology Cost and Performance Assessment" (PNNL-33283, August 2022) — pnnl.gov
- Chemours"Nafion Ion Exchange Materials: Nafion Membranes — The Right Choice for Your Flow Battery Technology" (product overview, © 2024, PDF) — chemours.com
- Wang et al."Balanced-state electrolytes overcome crossover in vanadium redox flow batteries", Nature Communications 17, 4470 (2026), DOI 10.1038/s41467-026-70872-8 — doi.org
- Xu Lin et al."Capacity Degradation Mechanisms, Recovery Strategies, and Challenges of Flow Batteries", Nano-Micro Letters 19, 44 (2026), DOI 10.1007/s40820-026-02345-y — doi.org
- Huskinson et al."A metal-free organic–inorganic aqueous flow battery", Nature 505, 195–198 (2014), DOI 10.1038/nature12909 — doi.org
- Invinity Energy Systems"Invinity VS3-022 Six Pack Vanadium Flow Battery Data Sheet" (MAR00016, January 2023 edition, PDF) — invinity.com
- Invinity Energy Systems plc"2025 Annual Report & Financial Statements" (year ended 31 December 2025, PDF) — invinity.com
- Chinese Academy of Sciences (CAS)"World's Largest Flow Battery Energy Storage Station Connected to Grid" — english.cas.cn
- ESS Tech, Inc. (U.S. SEC filing)Form 10-K for the year ended 31 December 2025 (filed 2026) — sec.gov
- U.S. Department of Energy (DOE) / EnerVault"Long-Duration, Grid-Scale Iron-Chromium Redox Flow Battery Systems" (2014 DOE Energy Storage Peer Review, PDF) — energy.gov
- Disclosure on the ASX (Australian Securities Exchange)Redflow Limited, "Redflow enters Voluntary Administration" (23 August 2024) — marketindex.com.au
- U.S. Geological Survey (USGS)"Mineral Commodity Summaries 2026: Vanadium" (February 2026, PDF) — pubs.usgs.gov
- News report (pv magazine; used only as a pointer to primary sources)"China connects world's largest vanadium flow battery project" (7 January 2026) — pv-magazine.com
- News report (The Beijing News; used only as a pointer to primary sources)Report on the largest vanadium flow battery storage station in China entering commercial operation (in Chinese, 25 June 2026) — bjnews.com.cn
14. Claim-to-source audit
| Claim in the text | Basis | Type |
|---|---|---|
| Principle: capacity follows the vanadium in the tanks and output follows cell size (area x number of cells), designed independently. The reactions (positive VO²⁺ to VO₂⁺, negative V³⁺ to V²⁺), the EMF of about 1.4 V, and V/V as the current mainstream. That in V/V both sides use the same element so mixing through the membrane does not cause capacity loss. That the cell reaction is only a valence change with no theoretical limit on cycles. Examples: the large 15 MW x 4 h operation and short-term operation at twice rated power (30 MW). Ti/Mn development (disproportionation, 10 kW-class stack, 23.5 kWh/m³). Electrode material, flow-field and membrane descriptions. The 2019 operating result (no notable change after the three-year demonstration) | Toshio Shigematsu (Sumitomo Electric Industries) Reference 3 https://sei.co.jp/technology/tr/bn195/pdf/195-01.pdf | Sourced |
| The electrolyte is non-flammable and does not ignite if the liquids mix; no electrode dissolution or plating, so no electrode or electrolyte degradation; design life of 20 years; output set by the number of cell stacks and duration by liquid volume, independently; one tank feeding every stack keeps the state of charge uniform (all company statements). UL 1973 certification | Sumitomo Electric Industries Reference 1 https://sumitomoelectric.com/jp/products/redox/features | Sourced |
| Installation cases: Hokkaido Electric Power Minami-Hayakita 15 MW / 60 MWh (online December 2015, demonstration fiscal 2013-2018, operation continuing), Hokkaido Electric Power Network 17 MW / 51 MWh (April 2022), SDG&E 2 MW / 8 MWh (March 2017, first UL safety certification for the charge-discharge section, first CAISO market entry in December 2018), 500 kW / 4 MWh (September 2024) | Sumitomo Electric Industries Reference 2 https://sumitomoelectric.com/jp/products/redox/cases | Sourced |
| PNNL's statements: the definition of RFB, independent power and energy, SOC windows for mixed-acid and sulfuric-acid (10-90%, 10-80%, 20-75%) and the 25% and 82% extra liquid energy, precipitation and mixed acid, bipolar-plate corrosion and gassing at high SOC, a separate tank per series block and about 50 V, 1,000 V to 1,500 V, electrolyte cost (180 to 105 US$/kWh, sulfuric acid 150, coal-ash case 50), leasing and vertical integration, microporous separators, stack life of 10-20 years (12 in the assessment), pumps, developer-reported electrolyte degradation (1% in 7,000 cycles, 1% in 25 years, over 100,000 cycles), RTE (DC-DC 71%, AC-AC 65%), LFP RTE (89.55%, 82.59%), 100 MW 10-hour installed cost (RFB 385, LFP 356, NMC 405, lead 409), the 10 MW line items (Table 4.7), power-side costs (60, 73, 7.8, 25 US$/kW), and separate removal of electrolyte and stacks at end of life | Pacific Northwest National Laboratory (PNNL) Reference 4 https://www.pnnl.gov/sites/default/files/media/file/ESGC%20Cost%20Performance%20Report%202022%20PNNL-33283.pdf | Sourced |
| Chemours' statements: the IXM as a key enabler with ionic conductivity the most important factor, the make-up of Nafion (copolymer of TFE and perfluorinated monomers with sulfonic acid groups), thickness 25-210 µm, PTFE reinforcement, Table 1 (thickness, areal resistance and VO²⁺ flux constant of NR211, NR212, N115 and N117) | Chemours Reference 5 https://www.chemours.com/en/-/media/files/nafion/nafion-flow-battery-brochure.pdf | Sourced |
| Wang et al.: Nafion-type membranes as the commercial mainstream, the ion-selectivity problem, capacity loss in a small cell (67.9% in 400 cycles) and recovery on replacing the electrolyte, the reduction of capacity fade with balanced-state electrolytes (0.061 to 0.015% per cycle over 1,000 cycles), coulombic efficiency of 97.79% for Nafion 212 against 95.90% for Nafion 117, the authors' estimate of a 41.7% or greater capital-cost reduction, and the order of diffusion ease | Wang et al. Reference 6 https://doi.org/10.1038/s41467-026-70872-8 | Sourced |
| Xu Lin et al. review: causes of capacity fade (volume imbalance, inactivation and decomposition of active species, electrode degradation, valence imbalance from side reactions) and remedies (remixing, chemical reduction, electrolysis) | Xu Lin et al. Reference 7 https://doi.org/10.1007/s40820-026-02345-y | Sourced |
| The existence and title of the Huskinson et al. paper (a metal-free organic-inorganic aqueous flow battery) | Huskinson et al. Reference 8 https://doi.org/10.1038/nature12909 | Sourced |
| Invinity VS3-022 data sheet: dimensions, flooded weight of 24,600 kg, 230 kWh rated, maximum DC output 78 kW, continuous discharge (29 kW for 8 h, 52 kW for 4 h, 75 kW for 2.25 h), cycle life above 20,000, annual capacity degradation below 0.5%, maximum DC round-trip efficiency 75%, temperature range -5 to 45 °C, certifications and tests (manufacturer's stated values) | Invinity Energy Systems Reference 9 https://invinity.com/wp-content/uploads/2023/03/Invinity-VS3-022-Vanadium-Flow-Battery-Data-Sheet-MAR00016-2023-01.pdf | Sourced |
| Invinity 2025 annual report: more than 2,000 batteries delivered, more than 9 GWh dispatched, Copwood (20.7 MWh) planned to connect in late 2026, selection for a Swiss project of up to 1.5 GWh (company statements and plans) | Invinity Energy Systems plc Reference 10 https://invinity.com/wp-content/uploads/2026/06/Invinity-Energy-Systems-plc-2025-Annual-Report.pdf | Sourced Not yet confirmed |
| Dalian 100 MW / 400 MWh grid connection (29 September), National Energy Administration approval in April 2016, final plan of 200 MW / 800 MWh, built by Rongke Power | Chinese Academy of Sciences (CAS) Reference 11 https://english.cas.cn/Special_Reports/rd/2022/202410/t20241031_693355.shtml | Sourced |
| ESS Tech's statements: the iron flow reactions and porous separator, Proton Pump, 20,000-cycle design (based on lab-scale results), revenue of US$1.6 million (US$6.3 million the previous year) and net loss of US$63.4 million for the year to December 2025, substantial doubt about going concern, withdrawal of Energy Warehouse and Energy Center and focus on Energy Base | ESS Tech, Inc. (U.S. SEC filing) Reference 12 https://www.sec.gov/Archives/edgar/data/1819438/000181943826000012/ghw-20251231.htm | Sourced |
| EnerVault iron-chromium: 250 kW / 1 MWh field demonstration (from June 2014), more than tenfold reduction in side reactions, dynamic rebalancing, and NASA studies in the 1970s and 80s | U.S. Department of Energy (DOE) / EnerVault Reference 13 https://www.energy.gov/sites/default/files/2015/01/f19/01_2014Storage_PeerRev_Nevins_Sheri_IRON-CHROMIUM_REDOX.pdf | Sourced |
| That Redflow Limited entered voluntary administration on 23 August 2024 (ASX disclosure) | Disclosure on the ASX (Australian Securities Exchange) Reference 14 https://www.marketindex.com.au/asx/rfx/announcements/redflow-enters-voluntary-administration-2A1542820 | Sourced |
| USGS: 2025 world vanadium mine production (about 110,000 tonnes, China about 82,000), more than 90% of U.S. consumption in metallurgy, the average Chinese vanadium pentoxide price (US$5.02 per pound in 2025, US$5.44 in 2024), and the flow-battery challenges (high capital cost, limited supply of high-purity feedstock) | U.S. Geological Survey (USGS) Reference 15 https://pubs.usgs.gov/periodicals/mcs2026/mcs2026-vanadium.pdf | Sourced |
| Reports of a 200 MW / 1,000 MWh project entering operation in Xinjiang (the developer named differs between reports) | News report (pv magazine; used only as a pointer to primary sources) Reference 16 https://www.pv-magazine.com/2026/01/07/china-connects-worlds-largest-vanadium-flow-battery-project/ News report (The Beijing News; used only as a pointer to primary sources) Reference 17 https://www.bjnews.com.cn/detail/1782338347189266.html | Commentary |
| Section 3 calculations (liquid volume: 1.6 mol/L, 1.4 V, 80% SOC window, about 24.0 Wh/L, 833 / 1,666 / 2,499 / 4,164 m³), the cross-check at 23.5 kWh/m³, about 1.46 times for sulfuric acid, VS3 at about 9.3 Wh/kg and about 6.0 kWh/m³, continuous-discharge energy (232, 208 and 169 kWh), the sum of 10 MW line items (762, 542, 467, 430, 408, 356 and 329 US$/kWh), and the efficiency gap (0.328 MWh, about US$6.6 and 16.4 per MWh) | Our calculation. The vanadium concentration of 1.6 mol/L, the 80% SOC window, equal positive and negative tank volumes and charging prices of US$20 and 50 per MWh are assumptions set by this article. The 10 MW total adds PNNL Table 4.7 line items (SB, BOS, system integration, EPC and project development, each in US$/kWh) to the power-side US$165.8/kW divided by hours, and may not match the totals PNNL itself publishes | Our calculation |
| The reading that "the active material is robust but the liquid balance drifts", the reading of the membrane-thickness trade-off, that Nafion contains -CF2- and appears to meet the PFAS definition, the conditions under which RFB would gain, the summary of electrode, flow-field and stack design, and the way Tables 1 and 3 are organized | Our summary and commentary based on published content. Not views expressed by the institutions or companies | Commentary |
| Real-system membrane and electrolyte specifications, measured round-trip efficiency under identical conditions, official information on the large Xinjiang project, the treatment of flow-battery membranes in the EU PFAS proposal, EnerVault afterwards, and the commercialization of organic and Ti/Mn systems | Could not be confirmed in published primary sources within the scope of this article, so not stated | Commentary |
| That Figs. 1, 2, 3, 5 and 6 are explanatory drawings (Figs. 3 and 6 include our calculations) and that the hero image and Fig. 4 are AI-generated images | Our note | Commentary |
Last updated October 2026. Sources are limited to primary material (company official material, technical papers, SEC filings, reports of US national laboratories and USGS, an article of the Chinese Academy of Sciences, and peer-reviewed papers). News reports were used only as pointers to primary sources. No market-research estimates were used. Readings about materials and structure are marked as commentary and kept separate from sourced fact. The membrane and electrolyte specifications of real systems, measured round-trip efficiency under identical conditions, official information on the large Xinjiang project, and the treatment of flow-battery membranes in the EU PFAS proposal could not be confirmed in published primary sources and are therefore not stated. The calculations in this article are derived from the formulas and stated assumptions and are not forecasts for any particular project or plant. Figs. 1, 2, 3, 5 and 6 are explanatory vector drawings (Figs. 3 and 6 include our calculations); the hero image and Fig. 4 are AI-generated images, and none of them shows a real facility, component or product.