TECHNOLOGY EXPLAINER
Resins for 3D Printing
— the distance between "it can be layered" and "it can be used as a material"
3D printing (additive manufacturing, AM) is a process that solidifies resin one layer at a time. How it is solidified differs by route — melt and cool, cure with light, melt powder and fuse it — and each time the properties demanded of the material change too. This article sorts out, from a materials engineer's point of view, how routes match resins, cure shrinkage and post-cure in photocurable resins, degradation and reuse of powder, anisotropy in material extrusion, high-performance materials such as PEEK, and how to write up the data.
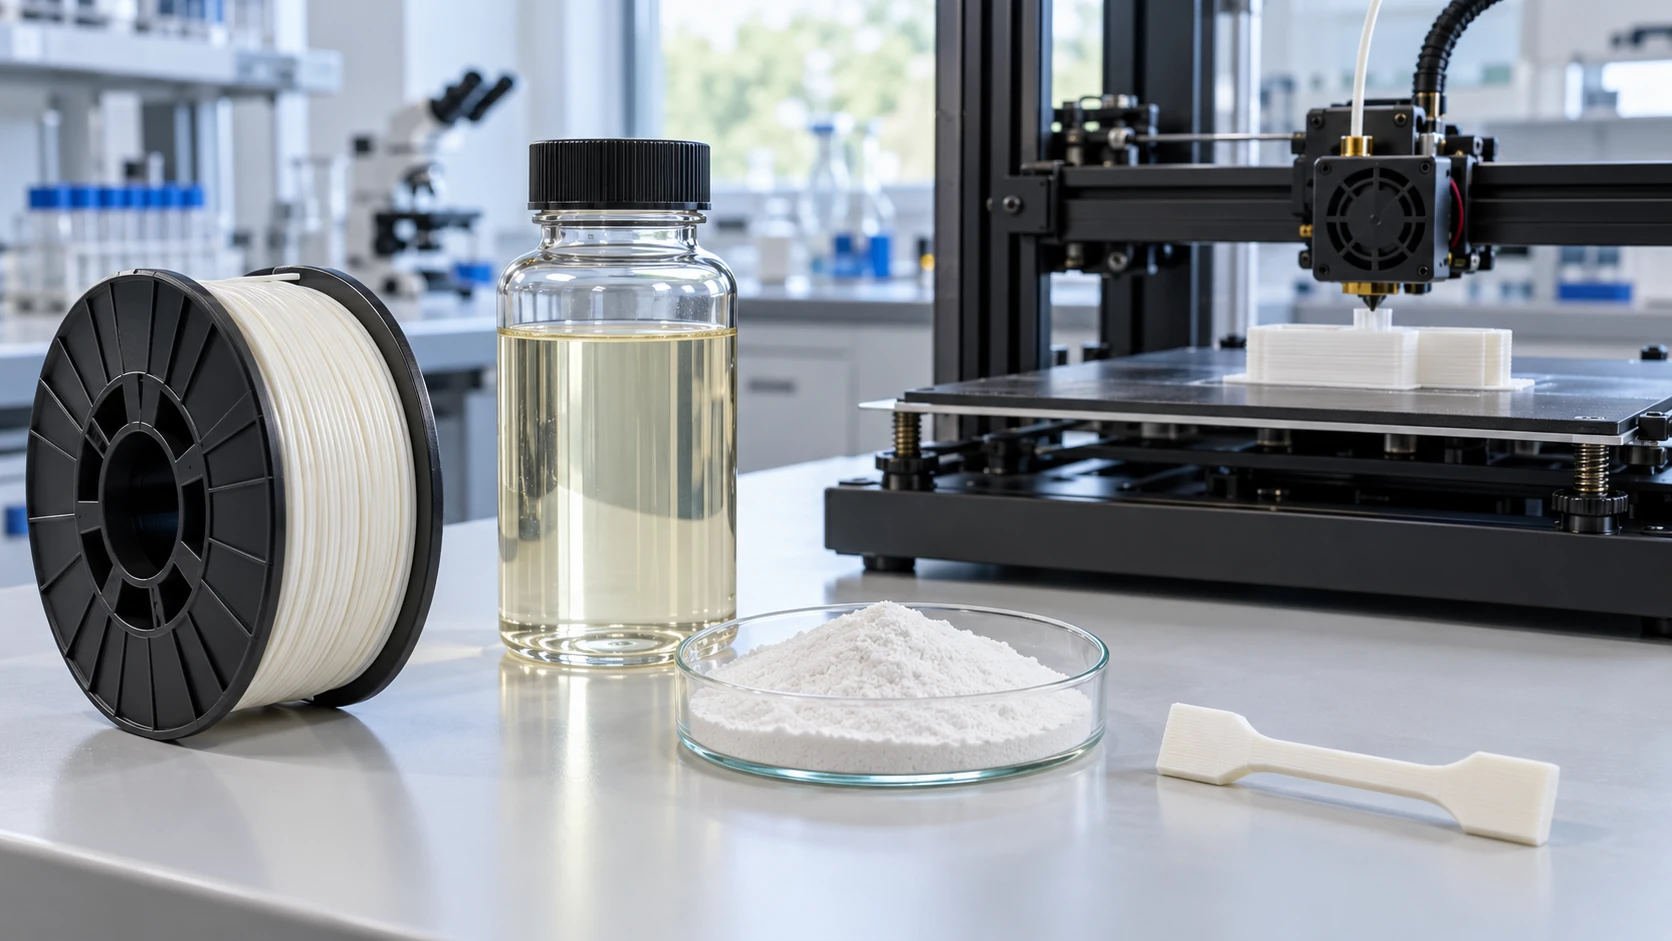
- What resins for AM are (the short version)
- Routes and feedstock forms — four ways of solidifying
- Photocurable resins — solidifying liquid with light
- Our calculation: the working curve, and the size of cure shrinkage
- A materials engineer's view (1): "curing" has two stages — post-cure and unreacted groups
- Powder bed fusion — powder changes every time it is used
- Our calculation: powder refresh rate and powder "history"
- A materials engineer's view (2): powder is a feedstock with a thermal history
- Material extrusion — interlayer bonding and anisotropy
- High-performance materials such as PEEK — the thermal environment becomes part of the material
- A materials engineer's view (3): data without build conditions cannot be used
- Standards and how to write data
- Challenges as materials, and what we could not confirm
- Glossary / References / Claim-to-source audit
Sourced = content stated in a standards body's page or a peer-reviewed paper (link given)
Our calculation = a figure this article derived, with the assumptions spelled out
Not yet confirmed = a plan, target or outlook with no confirmed track record
Structural readings and materials-design interpretations are marked separately as Commentary.
Property values are always shown together with test method, conditions and source. A value for a particular formulation or machine in one paper is an example for that sample and machine, not a value for commercial materials in general.
1. What resins for AM are (the short version)
- The route decides the form of the resin: ISO/ASTM 52900 sorts AM into seven process categories (binder jetting, directed energy deposition, material extrusion, material jetting, powder bed fusion, sheet lamination and vat photopolymerisation)Sourced (the classification is introduced in the paper by Ciesielska-Wrobel et al.). Resin is supplied in the feedstock forms of filament, liquid resin, powder and droplets (our summary)
- The strength is "design freedom"; the weakness is "assurance as a material": building by photopolymerisation is said to give wide latitude in optical, chemical and mechanical properties thanks to the variety of monomer and oligomer chemistry (Bagheri and Jin)Sourced. On the other hand, a printed part changes in properties with build orientation, conditions and post-processing, and is not set by the "material value" alone (our commentary)
- The difficulty is that chemistry, processing and evaluation are linked: shrinkage on photocuring, thermal degradation of powder, adhesion between layers, the thermal environment for high-performance materials — all can be explained from the basics of polymers: molecular motion, crystallisation and crosslinking (our commentary)
A "material value" for AM is not the value in the material's datasheet; it is the value of a test specimen made from that material on a particular machine under particular conditions and then post-processed. In the study by Ahn et al. (Rapid Prototyping Journal, 2002), the tensile strength of ABS built by FDM was 65 to 72% of that of injection-moulded ABS, and the compressive strength was 80 to 90%Sourced. The same resin becomes a different material depending on build orientation and conditions (our commentary).
The basics of thermoplastics and thermosets are in our explainer on thermoplastics and thermosets, the glass transition in our explainer on glass transition and creep, PEEK and similar materials in our explainer on PEEK and super engineering plastics, polyamides in our explainer on polyamides, fibre reinforcement in our explainer on CFRP and composite materials, and blends and fillers in our explainer on polymer blends and fillers.
2. Routes and feedstock forms — four ways of solidifying
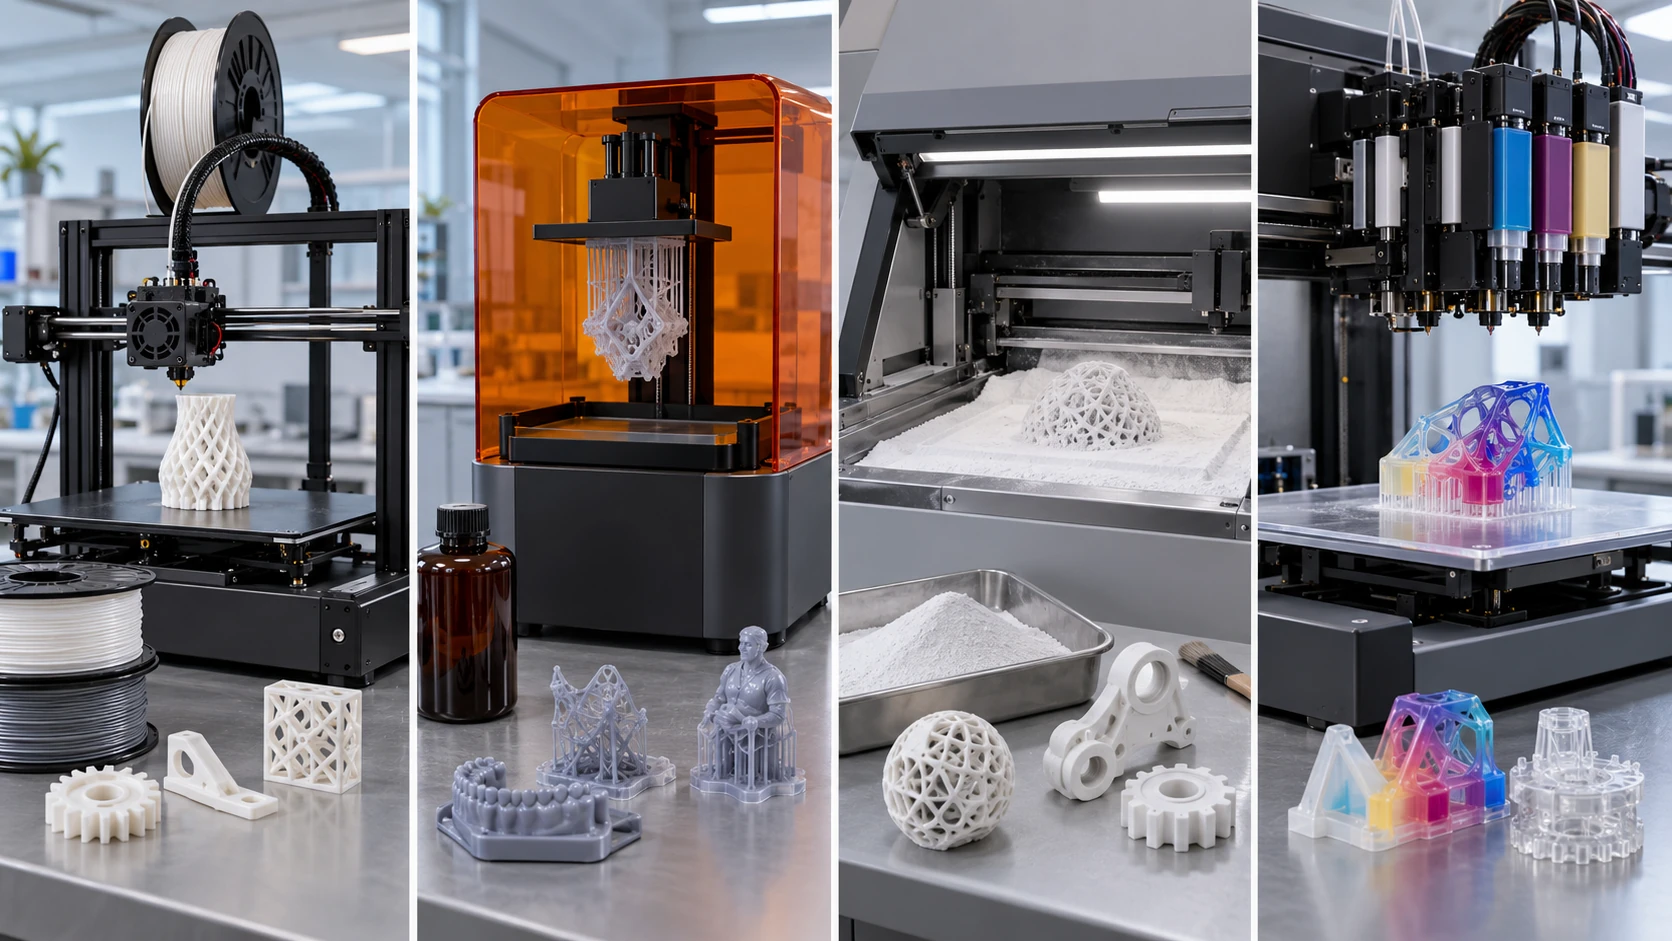
ImageGen conceptual illustration (not a real photograph or measurement). See the original diagram for exact values, names and structure.
Show original diagram with exact annotations and values
ISO/ASTM 52900:2021 is the standard that defines AM terminology; its second edition was issued in November 2021 and reviewed and confirmed in 2025Sourced. The paper by Ciesielska-Wrobel et al. (Polymers, 2026) introduces that the standard divides AM into seven categories — binder jetting, directed energy deposition, material extrusion, material jetting, powder bed fusion, sheet lamination and vat photopolymerisation — and that PolyJet is a kind of material jetting, in which droplets of build material are selectively deposited and photopolymerised layer by layerSourced.
3. Photocurable resins — solidifying liquid with light
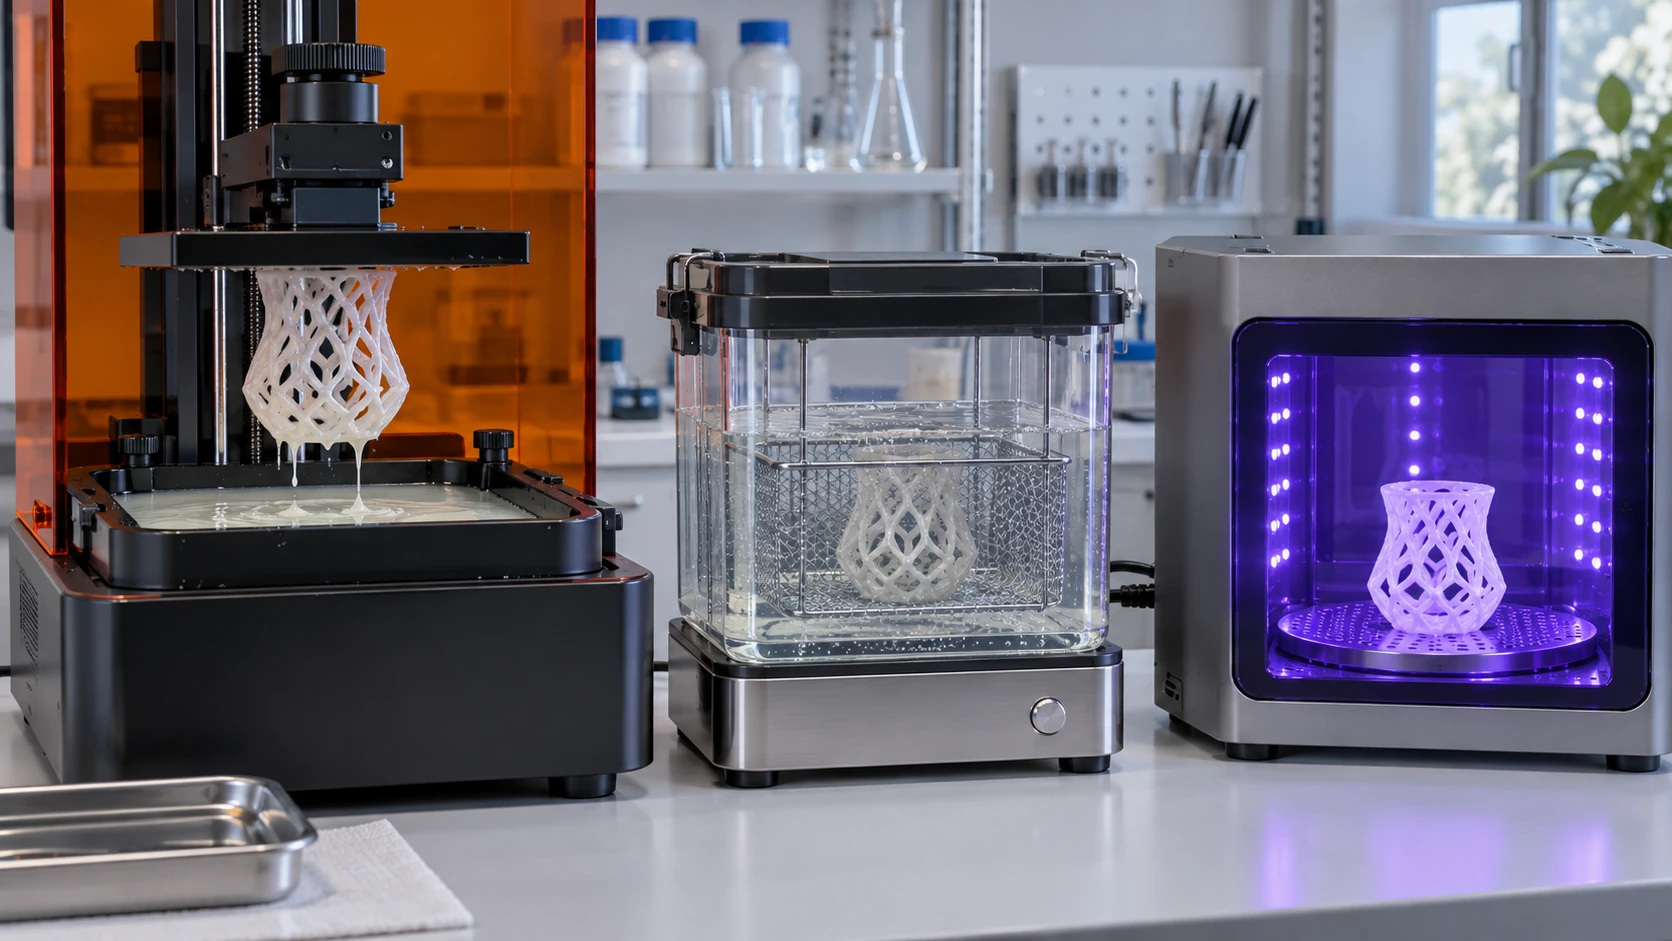
The review by Bagheri and Jin (ACS Applied Polymer Materials, 2019) sorts out 3D printing that uses photopolymerisation (stereolithography, DLP and others) as followsSourced.
- Photopolymerisation is a strategy in which liquid monomers or oligomers (containing a photoinitiator) are polymerised by light sources of different wavelengths through a radical or cationic mechanism; the variety of polymer chemistry gives wide latitude in optical, chemical and mechanical properties
- A challenge for conventional photopolymer resins is that they are limited to initiation by ultraviolet light. Remedies such as photosensitising initiators with red-shifted absorption, and applications of reversible addition-fragmentation chain-transfer (RAFT) polymerisation, are discussed
The review by Stansbury and Idacavage (Dental Materials, 2016) says that 3D printing, drawing on the great variety of in situ photopolymerisation and the variety of preformed processable polymers, is aimed mainly at making polymer parts and models, and sorts out the differences between the routes used and how they match monomer and polymer materialsSourced.
The viscosity window
For routes that handle a liquid, viscosity is the first constraint on the material. The review by Šimunović et al. (Polymers, 2025) gives the following ranges in the context of dental photopolymer resinsSourced (25 to 30 °C, shear rate about 10 to 100 s-1).
| Route | Typical viscosity (25 to 30 °C) | Notes |
|---|---|---|
| SLA (laser) | about 0.5 to 3 Pa·s typical; up to about 5 Pa·s reported for conventional SLA | The upper limit for conventional systems is about 5,000 mPa·s; above that only dedicated line-scanning systems |
| DLP (projection) | about 0.1 to 2 Pa·s typical | Up to about 3 Pa·s is possible with heating and very slow peeling |
| MSLA (LCD) | about 0.1 to 1.5 Pa·s typical | Many resins in vendor datasheets are 300 to 520 mPa·s, with an example of a flexible resin at about 2 Pa·s |
All Sourced (the table in the review by Šimunović et al. [Reference 5]. This is an organisation in the context of dental resins, and does not necessarily generalise to resins in other fields). The same review states that most commercial dental resins keep viscosity down to a few hundred mPa·s, and that reactive diluents (such as TEGDMA) lower viscosity and improve flow but, if overused, increase polymerisation shrinkage and brittleness and lower crosslink density and Tg.
4. Our calculation: the working curve, and the size of cure shrinkage
In vat photopolymerisation, cure depth Cd as a function of exposure E is given by the working curve Cd = Dp ln(E/Ec), where Dp is a constant representing the depth of light penetration and Ec is the critical exposure at which curing begins (a model that starts with Jacobs 1992 and is introduced in the review by Šimunović et al.)Sourced. The same review gives a guide for the relation between layer thickness and optical Dp of Dp ≈ 1.1 to 1.5 times the layer thicknessSourced.
Assumptions (set by this article)Our calculation
- Consider the exposure at which cure depth Cd exactly equals layer thickness t (adhesion to the layer below and over-cure are not considered)
- Dp = 1.1 to 1.5 × t. Then Cd / Dp = t / Dp = 0.91 to 0.67
The exposure needed is E = Ec × exp(t / Dp). For Dp = 1.1 t, E = Ec × 2.48; for Dp = 1.5 t, E = Ec × 1.95. In other words, curing exactly one layer thickness takes about 2 to 2.5 times the critical exposure. If you want to cure to twice the layer thickness, E = Ec × exp(2 / Dp × t) = Ec × 3.8 to 6.2, so the exposure rises by about 2 to 2.5 times (doubling the depth takes roughly 2 to 2.5 times the exposure).
Assumptions and limits: Dp changes with resin, wavelength, pigment and filler content (Šimunović et al. state that filler and pigment scatter and absorb light and lower Dp), and real exposure settings are calibrated machine by machine. This calculation is meant to give a feel for the order of magnitude of exposure.
The study by Chen et al. (Materials, 2026) reports, for a photocurable resin for LCD 3D printing (THEICTA/DMAA system), that volume shrinkage rose from 7.2±0.6% to 15.4±0.7% as the content of the reactive diluent DMAA increased (from the density difference, VS = (ρ2 − ρ1) / ρ2 × 100, with ρ1 the liquid and ρ2 the cured solid). The optimised formulation is given as having a viscosity of 78.7 mPa·s, tensile strength of 80.9 MPa, flexural strength of 166.1 MPa, a glass transition temperature of 176.2 °C, heat deflection temperatures of 168.1 °C (1.80 MPa) and 187.3 °C (0.45 MPa), and shrinkage under 10%Sourced (values for this laboratory's formulation).
Assumption (set by this article)Our calculation: shrinkage is isotropic, and for a volume shrinkage v the linear shrinkage = 1 − (1 − v)^(1/3).
| Volume shrinkage v | Linear shrinkage | For a 100 mm part | Scale-up needed to compensate |
|---|---|---|---|
| 7.2% (reported lower end) | about 2.5% | about 2.5 mm | about 1.025 times |
| 10% (upper end of "under 10%") | about 3.4% | about 3.4 mm | about 1.036 times |
| 15.4% (reported upper end) | about 5.4% | about 5.4 mm | about 1.057 times |
A volume shrinkage of a few per cent to ten-odd per cent means a few per cent in linear dimensions. If the same shrinkage happened uniformly, the design data could be scaled up to compensate, but in practice shrinkage differs from place to place, and stress remains against constrained layers (a cause of distortion and warpage; our commentary).
Assumptions and limits: real shrinkage is not isotropic, shrinkage during the build is made up by uncured liquid, and it continues in post-cure. The linear shrinkage above is a guide for free shrinkage and does not predict real dimensional error. The volume shrinkage is the result of measurement on one formulation system and is not a value for photocurable resins in general.
5. A materials engineer's view (1): "curing" has two stages — post-cure and unreacted groups
A printed part of photocurable resin is not yet fully cured when the build ends. It is common to wash it after printing and carry out a post-cure with light or heat (our commentary). The study by Kirby et al. (Polymers, 2024) took a photocurable resin for dental models (MSLA, one commercial dental model resin), post-cured it for 15 and 45 minutes in four types of post-cure unit, and measured the double-bond conversion (degree of conversion, DC) by FTIRSourced.
- The highest mean conversion overall was 69.6% (Phrozen Cure V2, 45 min)
- The lowest at 15 minutes was 66.2% (Triad 2000), and the lowest at 45 minutes was 68.2% (a home-built UV LED unit)
- There was no statistically significant difference between unit types, but the difference between 15 and 45 minutes was significant
If conversion is 66.2 to 69.6%, then the unreacted double bonds are from 100 − 69.6 = 30.4% to 100 − 66.2 = 33.8%Our calculation. This is the value for one resin for dental models, and does not mean that 30% remains in every resin.
A common explanation in polymer chemistry for why about 30% remains is that, as crosslinking proceeds, the glass transition temperature rises and the system approaches a hard glassy state in which the remaining functional groups can no longer move (vitrification) (our commentary. The study did not investigate the reason). In a system whose glass transition after cure is 176.2 °C, like the formulation of Chen et al. [Reference 6], vitrification is thought to set in early for a build at room temperature (commentary). The idea of thermal post-cure is that heating lets the residual groups, now able to move, react.
The review of dental crown materials (Aldawood et al., Polymers, 2026) sorts out the conditions and effects of post-cure as followsSourced (a statement in the context of dental materials, which does not necessarily generalise to materials for other uses).
- Exposure time must be long enough to cure the whole part; for a crown up to 15 mm thick, 20 to 30 minutes is enough
- A high post-cure temperature (60 to 80 °C) speeds curing and thermal initiation can convert unreacted species. A nitrogen or vacuum atmosphere prevents oxygen inhibition and avoids a tacky surface and under-cure
- Inadequate post-cure can leave flexural strength 30 to 50% lower than in a properly post-cured part. Dimensional stability worsens, and residual reactive groups polymerise slowly and cause shrinkage and distortion. Leaching of uncured monomer is also more likely
- Over-doing post-cure can also cause surface embrittlement and susceptibility to microcracks, and thermal degradation from high temperature or long time. Dimensions should be measured and adjusted after post-cure, not before
Oxygen inhibition is known as a factor that affects polymerisation rate in UV curing generally. The review by Decker (Macromolecular Rapid Communications, 2002) says that in acrylate UV curing, initiation efficiency, oligomer structure, light intensity and the inhibiting effect of oxygen affect polymerisation rateSourced. We took up the same reference in our explainer on barrier properties and coatings.
6. Powder bed fusion — powder changes every time it is used
Powder bed fusion, such as SLS (selective laser sintering) and MJF (multi jet fusion), heats a layer of powder and fuses it selectively. After the build, the powder that did not fuse (the part cake) is reused. That powder changes because it is exposed to high temperature in every build. ASTM F3091 is a specification for the requirements of plastic parts made by powder bed fusion and for ensuring part integrity, and it also covers formulations containing fillers, functional additives (such as flame retardants) and reinforcementsSourced.
- Molecular weight goes up: the study by Wudy et al. (Additive Manufacturing, 2019) says that for PA12 part-cake material, high temperature and long build times cause chemical and physical ageing, and reports from gel permeation chromatography (GPC) that average molecular weight rises with build time and build chamber temperature, with build time having the larger effect, that the Mark-Houwink plot shows linear chain growth, suggesting solid-state polycondensation, and that longer chains lower the crystallisation temperature (DSC)Sourced
- Particles break: the study by Alo et al. (MATEC Web of Conferences, 2022) reports that with reuse of PA12, the share of fine particles rises as cumulative build time increases (cracking and fragmentation from repeated exposure to high temperature), that an orange-peel surface appeared slightly at a cumulative build time of 36.4 hours, and that beyond that surface defects were conspicuous and part thickness and width deviated from the design valuesSourced
- Compensate by mixing: the study by Eggers et al. (Powders, 2023) reports a strategy of compensating for powder ageing by mixing fresh and reused powder in a fixed ratio, and that when PA12 is used repeatedly at a fixed refresh rate, powder density and part properties fall with the number of cyclesSourced
7. Our calculation: powder refresh rate and powder "history"
Assumptions (a simple model set by this article)Our calculation
- The total amount of powder is constant. After each build, the whole is mixed well and a share r of the powder is replaced with fresh powder (corresponding to the part that became printed parts and the part discarded)
- Powder ageing is taken to be proportional to the number of thermal exposures, one per build (Wudy et al. state that the thermal exposure of the whole part cake matters)
In steady state, the average number of builds a powder experiences before replacement is 1 / r (an average of 5 for r = 0.2). The share of powder that survives n or more builds is (1 − r)n.
| Refresh rate r | Average number of builds (1 / r) | Share of powder through 10 or more builds, (1 − r)10 |
|---|---|---|
| 0.5 | 2 | about 0.1% |
| 0.3 | about 3.3 | about 2.8% |
| 0.2 | 5 | about 10.7% |
| 0.1 | 10 | about 34.9% |
Halving the refresh rate from 0.2 to 0.1 doubles the average number of builds (5 to 10) and raises the share of powder through 10 or more builds more than threefold (10.7% to 34.9%). Even where the average looks moderate, a fixed share of powder with a long history remains, and this can be a cause of scatter in quality (our commentary).
Assumptions and limits: in practice powder does not mix perfectly, thermal exposure differs by position in the part cake, and ageing is not simply proportional to the number of builds (Wudy et al. report the effects of build time and chamber temperature). Actual refresh rates also differ with the machine maker's operating material, which we have not checked. This calculation is meant to show the idea of a distribution of history.
8. A materials engineer's view (2): powder is a feedstock with a thermal history
The results of Wudy et al. show a characteristic of polymers: even prolonged heating below the melting point raises the molecular weight of PA12. Because polyamide end groups can react with each other, it is suggested that chains may lengthen while still solid (solid-state polycondensation) (our commentary; the paper says only "suggests"). Higher molecular weight raises melt viscosity and lowers crystallisation temperatureSourced.
- A powder "lot" is defined not on arrival but by its history of use: even from the same bag, properties differ with how many builds it has been through and how many hours at what temperature. The fact that thermal history changes the state of the material feels the same as annealing or ageing in metals
- The indicators to evaluate are different: besides molecular weight and particle size distribution at goods-in inspection, you need to keep watching the molecular weight distribution (GPC) and particle size distribution of reused powder, and melt flow (Alo et al. report increased fine particles and surface defects)
- Attach the state of the powder to the data: property values of printed parts cannot be reproduced unless they come with the number of powder reuses and the refresh rate (Section 11)
The same thinking as managing oxygen content and particle size drift of powder in metal-powder AM is needed for polymer powder (our commentary. We do not cover metal-powder management itself).
9. Material extrusion — interlayer bonding and anisotropy
Material extrusion (FDM / FFF) melts a thermoplastic filament, pushes it out of a nozzle and stacks it in layers. The review by Turner et al. (Rapid Prototyping Journal, 2014 and 2015) sets out systematically the process design and modelling of extrusion-based AM such as FDM (Part I) and its materials, dimensional accuracy and surface roughness (Part II)Sourced.
The study by Ahn et al. (Rapid Prototyping Journal, 2002) varied the build conditions (raster orientation, air gap, bead width, colour and model temperature) by design of experiments for ABS built on a Stratasys FDM machine (FDM 1650), and compared the tensile and compressive strengths of specimens made in different orientations with injection-moulded FDM ABS P400 materialSourced. With a road (bead) overlap of 0.003 inch (about 0.076 mm), tensile strength was 65 to 72% of injection-moulded ABS and compressive strength 80 to 90%Sourced. From the experimental results, the study draws up several design rules for FDM parts.
The review by Goryl et al. (Polymers, 2026) says of material extrusion of reinforced thermoplastic composites that the layer-by-layer thermal history — the deposited road is cooled quickly, reheated repeatedly by later deposition, and cools unevenly as part of a growing structure — can cause residual stress, warpage, detachment from the build plate, delamination, dimensional error and loss of mechanical performance. It explains the stress through constrained thermal contraction, crystallisation shrinkage, anisotropic stiffness, the restraint on deformation by fibres, porosity and the thermal-expansion mismatch between fibre and matrix, and also says that reinforcement may suppress visible deformation but increase the stress left in the stiffened structureSourced.
10. High-performance materials such as PEEK — the thermal environment becomes part of the material
When a high-performance semi-crystalline polymer such as PEEK is printed by material extrusion, the build space itself becomes part of the material. The study by McCrickard et al. (Polymers, 2026) made filament from PEEK (glass transition 143 to 148 °C, melting point 300 to 340 °C) and PEI (glass transition 217 °C), one of the few miscible pairs of a semi-crystalline and an amorphous high-performance polymer, and printed with itSourced (the values are those from sources the paper cites).
- At all PEEK/PEI weight ratios (100/0, 80/20, 70/30, 60/40, 50/50, 40/60, 20/80, 0/100), DSC showed a single glass transition, so the blends were miscible
- For high-performance polymers printed at high temperature, shrinkage and warpage are a problem, and blending is mentioned as one way of easing it
- The 80/20 blend was judged the best in terms of crystallinity (35% normalised to the PEEK fraction) and retention of mechanical properties, with a mean tensile strength of 75.6 MPa and Young's modulus of 1,338 MPa, and reduced warpage and better printability were reported (ISO 527-2 type 5A specimens; values for this machine and these conditions)
Assumptions (the settings of McCrickard et al. and the PEEK values that paper cites)Our calculation
- Nozzle 380 °C − melting point 300 to 340 °C = 40 to 80 °C higher
- Bed 180 °C − glass transition 143 to 148 °C = 32 to 37 °C higher
- Nozzle 380 °C − chamber 75 °C = a difference of 305 °C (a guide to the temperature range over which a deposited road cools)
PEEK leaves the nozzle 40 to 80 °C above its melting point and lands on a layer below that is kept warm by the bed. The paper refers to several researchers' remarks that a higher chamber temperature advances PEEK crystallisation, and shows that a 70/30 sample built with the infrared heater at 410 °C and the bed at 150 °C had a cold-crystallisation peak, meaning that crystallinity had not reached its maximum during the buildSourced. In other words, the temperature history during the build sets crystallinity, an internal state of the material.
Assumptions and limits: the numbers are an example from one machine and one paper. The paper does not give, in a form we can confirm, a comparison of strength with PEEK made by other methods such as injection moulding. We do not compare the tensile strength of 75.6 MPa and modulus of 1,338 MPa with values for other PEEK.
11. A materials engineer's view (3): data without build conditions cannot be used
As we have seen, the properties of an AM part are not set by the chemistry of the material alone (our organisation).
| Route | Factors that move properties (examples shown here) | Conditions to attach to data (commentary) |
|---|---|---|
| Photocuring | Exposure (working curve), amount of reactive diluent and shrinkage, post-cure time, temperature and atmosphere, conversion | Exposure, layer thickness, build orientation, washing, post-cure conditions, measured conversion and Tg |
| Powder bed fusion | Number of powder reuses and refresh rate, build time, chamber temperature (changes in molecular weight, crystallisation temperature and particle size) | Powder history (fresh powder ratio, cumulative build time), position in the build, build orientation |
| Material extrusion | Road overlap, raster orientation, interlayer bonding, nozzle, bed and chamber temperature, crystallisation | Nozzle / bed / chamber temperature, speed, layer thickness, infill, raster angle, specimen orientation |
ASTM F2971 sets out a standard format for reporting the results of testing and evaluating specimens made by AM. Its purposes are to establish requirements for data reporting and to inform the design of material property databasesSourced. It is the same habit as pairing sintering conditions with density in powder metallurgy of metals and ceramics. Writing not "tensile strength of ABS" but "tensile strength of ABS built on an FDM 1650 with a road overlap of 0.003 inch and raster direction X" is the minimum description in AM (our commentary).
12. Standards and how to write data
| Standard | Title / subject | As stated on the official page |
|---|---|---|
| ISO/ASTM 52900:2021 | Additive manufacturing — General principles — Fundamentals and vocabulary | Defines the terms used in AM technology and classifies them by application area. Second edition (November 2021), reviewed and confirmed in 2025 |
| ASTM F2971 | Standard Practice for Reporting Data for Test Specimens Prepared by Additive Manufacturing | A standard format for reporting results for specimens made by AM. Its purposes are to establish requirements for data reporting and to provide design information for material property databases |
| ASTM F3091/F3091M | Standard Specification for Powder Bed Fusion of Plastic Materials | Sets out requirements for plastic parts made by powder bed fusion and for part integrity. Also covers formulations containing fillers, functional additives and reinforcements |
| ISO 527-1:2019 | Plastics — Determination of tensile properties — Part 1: General principles | The general principles for finding the tensile properties of plastics and composites. McCrickard et al. printed type 5A specimens of ISO 527-2 in the same series |
All Sourced (the official pages of ISO/ASTM 52900 [Reference 1], ASTM F2971 [Reference 17], ASTM F3091 [Reference 18] and ISO 527-1 [Reference 19]). We have not checked the text of the standards.
13. Challenges as materials, and what we could not confirm
(1) Where photocurable resin goes after use is a challenge
The review by Aldawood et al. says that digital dental crown production cuts the waste of conventional methods, but that 3D printing uses petroleum-derived photopolymer resins and the options for disposal after use are in doubt. It says there are resins using vegetable-oil-derived methacrylates, with some products containing 30 to 50% bio-based contentSourced (a statement in the context of dental materials). Crosslinked photocured resin cannot be remelted. The recycling view is covered in our explainers on plastic recycling, chemical recycling and bioplastics.
(2) We do not cover the details of material jetting (PolyJet and others)
For material jetting we stay with the introduction (Ciesielska-Wrobel et al.) that it selectively deposits droplets and photopolymerises them; we have not confirmed, within the scope of this research, the properties of the material, the durability of printed parts, or the details of multi-material printing.
(3) We give no table of property values by material
The tensile strength, modulus and so on of commercial AM resins (photocurable resins, PA12 powder, filaments) depend strongly on build conditions, orientation and post-processing, and we could not confirm primary sources that allow comparison under matched conditions. We therefore only introduce values for the individual samples and machines in papers, as examples.
(4) We have not confirmed actual powder refresh rates, or comparisons of PEEK with other processes
We could not confirm official material on the powder refresh or reuse rates recommended by machine makers, so the calculation in Section 7 stays with a simple model. We also have not confirmed a comparison of the strength of printed PEEK with injection-moulded material.
(5) We do not cover the safety or biocompatibility of photocurable resins
Handling of uncured resin, leaching of monomer and photoinitiator, effects on skin and other safety matters, and evaluation of biocompatibility are outside the scope of this research (Aldawood et al. say that uncured monomer leaches more readily if post-cure is inadequate). For these, refer to the assessments of regulators and each product's safety data sheet. We have not used market-size or other estimates from research firms.
- The AM route is decided by the form of the feedstock. Filament, liquid resin, powder and droplets are the main forms of resin (the ISO/ASTM 52900 classification)Sourced
- In photocuring, curing exactly one layer thickness takes about 2 to 2.5 times the critical exposure, and a volume shrinkage of 7.2 to 15.4% for one formulation corresponds to about 2.5 to 5.4% in linear dimensionsOur calculation
- Even after post-cure, about 30% of the double bonds are unreacted in one dental model resinOur calculation
- PA12 powder, when reused, gains molecular weight, loses crystallisation temperature and accumulates fine particlesSourced. When the refresh rate goes from 0.2 to 0.1, the share of powder through 10 or more builds rises from 10.7% to 34.9%Our calculation
- The tensile strength of FDM-built ABS was 65 to 72% of injection moulded (Ahn et al.)Sourced. Data without build conditions cannot be used.
- In printing PEEK, the nozzle (380 °C) is 40 to 80 °C above the melting point (300 to 340 °C), and the temperature history during the build sets crystallinitySourcedOur calculation
14. Glossary
- AM (additive manufacturing)
- Making a solid object by adding material one layer at a time. Nearly synonymous with 3D printing.
- Material extrusion (FDM / FFF)
- A route that pushes molten thermoplastic out of a nozzle and stacks it in layers.
- Vat photopolymerisation (SLA / DLP / LCD)
- A route that selectively solidifies liquid photocurable resin with light.
- Powder bed fusion (SLS / MJF)
- A route that heats a layer of powder to fuse it selectively.
- Material jetting
- A route that selectively deposits droplets of build material and cures them with light (PolyJet and others).
- Working curve
- Cure depth Cd = Dp ln(E/Ec). Expresses the relation between exposure and cure depth.
- Post-cure
- A step after printing that advances curing with light or heat.
- Degree of conversion (DC)
- The share of double bonds that have reacted. Measured by FTIR and other methods.
- Part cake
- In powder bed fusion, the block that remains after the build, including the powder that did not fuse.
- Solid-state polycondensation
- Chains reacting in the solid state below the melting point so that molecular weight increases.
- Anisotropy
- Properties that differ with direction. In layered builds, strength changes with the orientation of the layers.
- Cold crystallisation
- Crystallisation on reheating of a semi-crystalline polymer that was quenched to a nearly amorphous state. Seen as an exothermic peak in DSC.
15. References (primary sources)
- ISO and ASTM ISO/ASTM 52900:2021 Additive manufacturing — General principles — Fundamentals and vocabulary — iso.org
- Ciesielska-Wrobel et al. Mechanical Behavior of 3D PolyJet-Printed Nylon 66/Photopolymer Textile Laminates, Polymers 18, 2136 (2026) — doi.org/10.3390/polym18172136
- Bagheri and Jin Photopolymerization in 3D Printing, ACS Appl. Polym. Mater. 1, 593–611 (2019) — doi.org/10.1021/acsapm.8b00165
- Stansbury and Idacavage 3D printing with polymers: Challenges among expanding options and opportunities, Dent. Mater. 32, 54–64 (2016) — doi.org/10.1016/j.dental.2015.09.018
- Šimunović et al. Rheology of Dental Photopolymers for SLA/DLP/MSLA 3D Printing, Polymers 17, 2706 (2025) — doi.org/10.3390/polym17192706
- Chen et al. Mechanical and Thermal Properties of DCPDA-Modified THEICTA/DMAA Photocurable Resins for LCD 3D Printing, Materials 19, 2845 (2026) — doi.org/10.3390/ma19132845
- Kirby et al. Effect of Different Post-Curing Methods on the Degree of Conversion of 3D-Printed Resin for Models in Dentistry, Polymers 16, 549 (2024) — doi.org/10.3390/polym16040549
- Aldawood et al. A Comprehensive Review of Polymeric Materials and Additive Manufacturing in Dental Crown Fabrication, Polymers 18, 667 (2026) — doi.org/10.3390/polym18060667
- Decker Kinetic Study and New Applications of UV Radiation Curing, Macromol. Rapid Commun. 23, 1067–1093 (2002) — doi.org/10.1002/marc.200290014
- Wudy et al. Aging effects of polyamide 12 in selective laser sintering: Molecular weight distribution and thermal properties, Addit. Manuf. 25, 1–9 (2019) — doi.org/10.1016/j.addma.2018.11.007
- Alo et al. Aging due to successive reuse of polyamide 12 powder during laser sintering: extrinsic powder properties and quality of sintered parts, MATEC Web Conf. 370, 03011 (2022) — doi.org/10.1051/matecconf/202237003011
- Eggers et al. Investigation of the Influence of the Mixing Process on the Powder and Component Properties during Cyclic Reuse of a Polyamide 12 Sinter Material in Selective Laser Sintering, Powders 2, 75–96 (2023) — doi.org/10.3390/powders2010006
- Ahn et al. Anisotropic material properties of fused deposition modeling ABS, Rapid Prototyping J. 8, 248–257 (2002) — doi.org/10.1108/13552540210441166
- Turner et al. A review of melt extrusion additive manufacturing processes: II. Materials, dimensional accuracy, and surface roughness, Rapid Prototyping J. 21, 250–261 (2015) — doi.org/10.1108/rpj-02-2013-0017
- Goryl et al. Residual Stresses and Distortion in Material Extrusion Additive Manufacturing of Reinforced Thermoplastic Composites, Polymers 18, 1796 (2026) — doi.org/10.3390/polym18151796
- McCrickard et al. PEEK/PEI Polymer Blends for Fused Filament Fabrication: Processing, Properties, and Printability, Polymers 18, 113 (2026) — doi.org/10.3390/polym18010113
- ASTM International ASTM F2971 Standard Practice for Reporting Data for Test Specimens Prepared by Additive Manufacturing — store.astm.org
- ASTM International ASTM F3091/F3091M Standard Specification for Powder Bed Fusion of Plastic Materials — store.astm.org
- ISO ISO 527-1:2019 Plastics — Determination of tensile properties — Part 1: General principles — iso.org
16. Claim-to-source audit
| Claim in the text | Basis | Label |
|---|---|---|
| That ISO/ASTM 52900:2021 is the standard defining AM terminology, with a second edition (November 2021) reviewed and confirmed in 2025 | ISO official page[Reference 1] https://www.iso.org/standard/74514.html | Sourced |
| That ISO/ASTM 52900 divides AM into seven process categories (binder jetting, directed energy deposition, material extrusion, material jetting, powder bed fusion, sheet lamination, vat photopolymerisation), and that PolyJet is a kind of material jetting that selectively deposits droplets and photopolymerises them layer by layer | Introduction of Ciesielska-Wrobel et al. (2026)[Reference 2] https://doi.org/10.3390/polym18172136 | Sourced |
| That photopolymer 3D printing is a strategy of polymerising liquid monomers or oligomers (with photoinitiator) by a radical or cationic mechanism, with wide latitude in properties; the challenge of ultraviolet-only initiation in conventional resins; and photosensitising initiators with red-shifted absorption and applications of RAFT polymerisation | Abstract of Bagheri and Jin (2019)[Reference 3] https://doi.org/10.1021/acsapm.8b00165 | Sourced |
| That 3D printing draws on the variety of in situ photopolymerisation and of preformed processable polymers, aims mainly at making polymer parts and models, and sorts out how routes match monomer and polymer materials | Abstract of Stansbury and Idacavage (2016)[Reference 4] https://doi.org/10.1016/j.dental.2015.09.018 | Sourced |
| Viscosity guides for SLA, DLP and MSLA (0.5 to 3, 0.1 to 2, 0.1 to 1.5 Pa·s), the conventional upper limit of about 5,000 mPa·s, dental resins at a few hundred mPa·s, increased shrinkage and brittleness from overusing reactive diluents, the working curve Cd = Dp ln(E/Ec), Dp ≈ 1.1 to 1.5 times layer thickness, and the lowering of Dp by filler and pigment | Šimunović et al. (2025)[Reference 5] https://doi.org/10.3390/polym17192706 | Sourced |
| Volume shrinkage of 7.2±0.6% to 15.4±0.7% of THEICTA/DMAA photocurable resin (increasing with DMAA), the optimised formulation's viscosity of 78.7 mPa·s, tensile strength of 80.9 MPa, flexural strength of 166.1 MPa, Tg of 176.2 °C, HDT of 168.1 / 187.3 °C and shrinkage under 10%, and the formula for shrinkage | Chen et al. (2026)[Reference 6] https://doi.org/10.3390/ma19132845 | Sourced |
| Conversion of a dental model resin (MSLA) after post-cure (highest 69.6%, lowest at 15 min 66.2%, lowest at 45 min 68.2%), with no significant difference between units and a significant difference between 15 and 45 min | Abstract of Kirby et al. (2024)[Reference 7] https://doi.org/10.3390/polym16040549 | Sourced |
| Post-cure conditions (20 to 30 min for crowns up to 15 mm, 60 to 80 °C, nitrogen or vacuum), the effects of inadequate post-cure (flexural strength 30 to 50% lower, shrinkage and distortion from residual reactive groups, leaching of uncured monomer), the effects of excessive post-cure, measuring dimensions after post-cure, doubts about disposal of photopolymer resin after use, and resins with 30 to 50% bio-based content | Aldawood et al. (2026, review of dental crown materials)[Reference 8] https://doi.org/10.3390/polym18060667 | Sourced |
| That in acrylate UV curing, initiation efficiency, oligomer structure, light intensity and the inhibiting effect of oxygen affect polymerisation rate | Abstract of Decker (2002)[Reference 9] https://doi.org/10.1002/marc.200290014 | Sourced |
| Ageing of PA12 part cake (average molecular weight rising with high temperature and long times, the larger effect of build time, a suggestion of solid-state polycondensation, lower crystallisation temperature) | Abstract of Wudy et al. (2019)[Reference 10] https://doi.org/10.1016/j.addma.2018.11.007 | Sourced |
| That reuse of PA12 powder increases the share of fine particles, orange peel appears at a cumulative build time of 36.4 hours, and beyond that surface defects and deviations in dimensions occur | Abstract of Alo et al. (2022)[Reference 11] https://doi.org/10.1051/matecconf/202237003011 | Sourced |
| The strategy of compensating for powder ageing by mixing fresh and reused powder in a fixed ratio, and that powder density and part properties of PA12 fall with the number of cycles | Abstract of Eggers et al. (2023)[Reference 12] https://doi.org/10.3390/powders2010006 | Sourced |
| That the tensile strength of FDM-built ABS (FDM 1650, road overlap 0.003 inch) is 65 to 72% and the compressive strength 80 to 90% of injection-moulded ABS P400, and that design rules were drawn up | Abstract of Ahn et al. (2002)[Reference 13] https://doi.org/10.1108/13552540210441166 | Sourced |
| That process design and modelling of extrusion-based AM (Part I) and materials, dimensional accuracy and surface roughness (Part II) are systematically sorted out | Abstract of Turner et al. (2014, 2015)[Reference 14] https://doi.org/10.1108/rpj-02-2013-0017 | Sourced |
| That the layer-by-layer thermal history of material extrusion produces residual stress and can cause warpage, detachment from the build plate, delamination, dimensional error and loss of mechanical performance, and that reinforcement may suppress deformation yet increase residual stress | Abstract of Goryl et al. (2026)[Reference 15] https://doi.org/10.3390/polym18151796 | Sourced |
| A single Tg (miscibility) in PEEK/PEI blends, the Tg of 143 to 148 °C and melting point of 300 to 340 °C of PEEK and the Tg of 217 °C of PEI (values cited in that paper), the build conditions (nozzle 380 °C, bed 180 °C, infrared heater 450 °C, chamber 75 °C, 30 mm/s, layer thickness 0.2 mm, infill 100%), crystallinity of 35%, tensile strength of 75.6 MPa and Young's modulus of 1,338 MPa for the 80/20 blend, ISO 527-2 type 5A, and a cold-crystallisation peak at lower settings | McCrickard et al. (2026)[Reference 16] https://doi.org/10.3390/polym18010113 | Sourced |
| That ASTM F2971 defines a reporting format for results from specimens made by AM | ASTM official page[Reference 17] https://store.astm.org/f2971-13r21.html | Sourced |
| That ASTM F3091 sets out requirements and integrity for plastic parts from powder bed fusion and also covers formulations with fillers, functional additives and reinforcements | ASTM official page[Reference 18] https://store.astm.org/f3091_f3091m-14r21.html | Sourced |
| That ISO 527-1:2019 gives the general principles for the tensile properties of plastics and composites | ISO official page[Reference 19] https://www.iso.org/standard/75824.html | Sourced |
| About 2 to 2.5 times the critical exposure (Dp = 1.1 to 1.5 t), 3.8 to 6.2 times at twice the layer thickness, linear shrinkage (about 2.5, 3.4 and 5.4%), the unreacted share (about 30 to 34%), the refresh rate r with average number of builds (1 / r) and the share through 10 or more builds ((1 − r)10), and the differences between set temperatures and transition temperatures (40 to 80 °C, 32 to 37 °C, 305 °C) | Our calculation. The ratio of Dp to layer thickness, isotropic shrinkage, 100 minus conversion, and the perfectly mixed constant-total refresh model are assumptions set by this article and are not values for any real resin or machine | Our calculation |
| The organisation of routes, feedstock forms, solidification and material issues; the explanation that vitrification stops residual groups from moving after post-cure; the contrast between solid-state polycondensation and annealing of metals; the view of powder history; the table of conditions to record; and the contrast with metal-powder AM | This article's organisation and commentary based on published content. Not views expressed by any company or agency | Commentary |
| Properties and durability of material jetting, a table of property values for commercial AM resins, actual operating refresh rates for powder, comparisons of strength of PEEK with other processes, the safety and biocompatibility of photocurable resins, and the text of the standards | Not stated, because they could not be confirmed in published primary sources within the scope of this article | Commentary |
| That Figs. 1 and 3 to 8 are explanatory drawings rather than real observations or design drawings, and that the hero image and Fig. 2 are AI-generated images | Our note | Commentary |
Last updated 2 October 2026. Sources are limited to primary material (ISO and ASTM standards pages and peer-reviewed papers). Because the article includes structural readings and materials-design interpretations, those are marked as Commentary and kept separate from sourced fact. The details of material jetting, a table of property values for commercial AM resins, actual operating refresh rates for powder, comparison of PEEK with other processes, and the safety and biocompatibility of photocurable resins are not stated here because they could not be confirmed in published primary sources. Values from papers are examples for the sample, machine and conditions of that study, not values for the material in general. We have not used market-size or share estimates from research firms. All figures are explanatory concept graphics. Figs. 1 and 3 to 8 are vector drawings; the hero image and Fig. 2 are AI-generated images, and none of them shows a real printed object, machine or micrograph.