TECHNOLOGY EXPLAINER
Plastic Recycling (Mechanical Recycling)
— a "recycling rate of X%" means nothing until you read the denominator and the numerator
From public sources you can produce two very different figures for the same Japanese plastic waste: 22% and 89%. The OECD, looking at the whole world, gives 9%; Japan's PET bottles come in at 85.1%. None of these is wrong. What differs is what was placed in the denominator and what was counted in the numerator. This article walks through mechanical recycling — melting used plastic and turning it back into resin — in the order of how the numbers are defined, the process, the quality, and the rules.
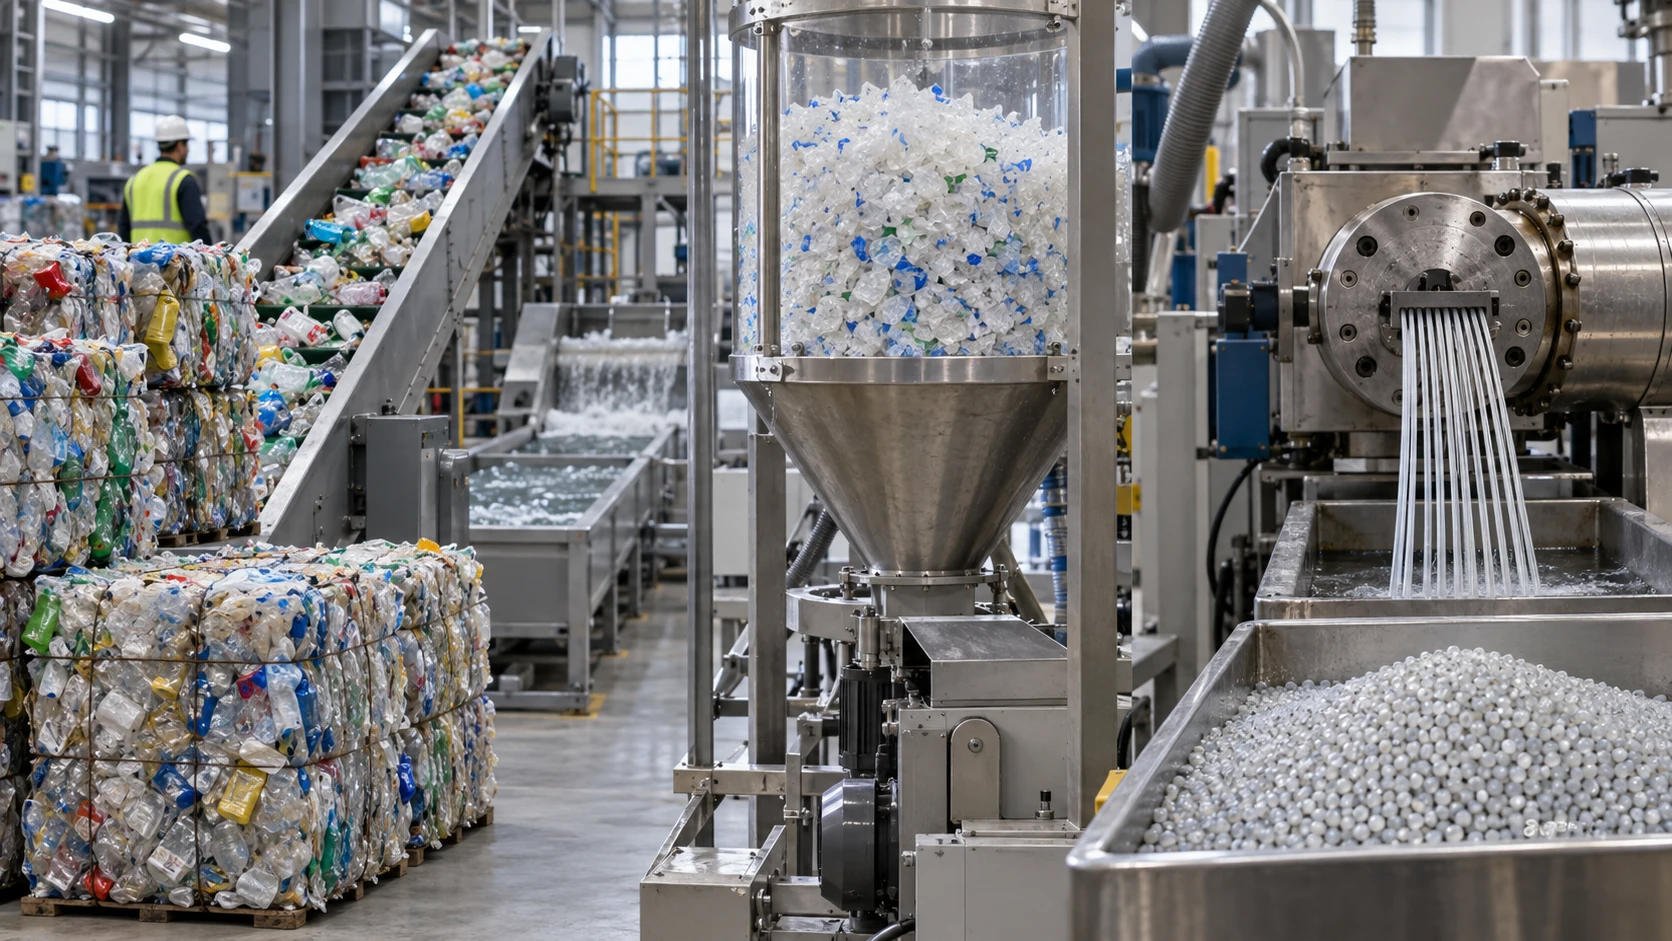
- What plastic recycling is (the short version)
- Where Japan's 7.69 million tonnes of waste plastic go (2023 data)
- Our calculation: the same "recycling rate" changes with the definition
- A materials engineer's view (1): read the denominator and the numerator
- The mechanical recycling process — sorting, size reduction, washing, melting, repelletising
- A materials engineer's view (2): why quality falls and varies
- Closed loop and cascade — the relationship with virgin resin
- A worked example with PET bottles — calculating the denominator and numerator
- Policy: the EU PPWR and Japan's Plastic Resource Circulation Act
- A materials engineer's view (3): recyclability is decided by design
- Open problems, and what we could not confirm
- Glossary / References / Claim-to-source audit
Sourced = content stated by a public body, industry association, statute or peer-reviewed paper (link given)
Our calculation = a figure this article derived from stated assumptions
Not yet confirmed = a statutory schedule, plan or target with no confirmed outcome yet
General explanations of polymer chemistry and processing are marked separately as Commentary. No market estimates from research firms are used.
1. What plastic recycling is (the short version)
- Mechanical recycling means collecting used resin, sorting and washing it, and melting it into resin again (recycled pellets). Japanese statistics count it separately from "thermal" recycling (burning as fuel) and "chemical" recycling (returning the material to chemical feedstock).
- There are many statistics on how much is collected, but their definitions are not aligned. Whether the denominator is "waste generated" or "sales", whether the numerator is "what was collected" or "what became recycled product", and whether exports are included can move the figure several-fold.
- Quality falls and varies because polymer molecules are damaged every time they are processed, and contamination is unavoidable. That is why policy (the EU PPWR and others) is widening from "use X% recycled content" to "design for recyclability".
As covered in our explainer on thermoplastics and thermosets, what recycling can melt down again is mainly thermoplastics. Thermosets and CFRP are touched on in our explainer on CFRP and composites. Methods that return the material to molecules by chemistry are covered in detail in our explainer on chemical recycling.
2. Where Japan's 7.69 million tonnes of waste plastic go (2023 data)
The core of Japan's public statistics is the material flow diagram compiled every year by the Plastic Waste Management Institute (PWMI, an industry body for plastic recycling data). The latest edition we could confirm is the 2023 edition, published in December 2024. It puts total waste plastic generated at 7.69 million tonnes (Mt), of which "effective utilisation" is 6.88 Mt (89%) and unused waste (simple incineration and landfill) is 0.81 Mt (11%)Sourced.
| Category (PWMI classification) | Quantity | Share of total waste plastic generated | Note |
|---|---|---|---|
| Mechanical (material) recycling | 1.71 Mt | 22% | Of which 1.41 Mt from used products and 0.30 Mt from unused material (production and processing losses) |
| Chemical recycling | 0.26 Mt | 3% | Blast-furnace / coke-oven feedstock; gasification (chemical feedstock use); oil recovery |
| Thermal recycling (energy recovery) | 4.92 Mt | 64% | Solid fuel / cement kilns 1.95, gasification (fuel use) 0.14, incineration with power generation 2.36, incineration with heat use 0.47 (Mt) |
| Unused (simple incineration + landfill) | 0.81 Mt | 11% | Simple incineration 0.58 Mt, landfill 0.24 Mt (does not sum exactly because of rounding) |
Quantities, shares and notes are PWMI's published values [Reference 1]. Thermal 4.92 Mt and 64% are PWMI's four categories added together (Our calculation): 1.95 + 0.14 + 2.36 + 0.47 = 4.92, and 4.92 / 7.69 = 64%.
In PWMI's accounting, "effective utilisation" includes heat recovery (thermal recycling), which makes up about 4.92 Mt of the 6.88 MtOur calculation. Mechanical recycling, in which the material becomes resin again, is 1.71 Mt (22% of total generation)Sourced.
Moreover, that 1.71 Mt includes 0.30 Mt derived from unused offcuts and rejects generated inside factories (production and processing losses)Sourced. Counting used products alone gives 1.41 Mt, which is about 20% of PWMI's "used-product waste of 7.10 Mt"Our calculation (1.41 / 7.10 = 19.9%). Feeding offcuts back in inside a factory and reprocessing products after consumption (post-consumer) have entirely different material histories. This distinction is why the EU recycled-content rules discussed in Section 9 limit themselves to material "derived from post-consumer waste" (Commentary).
In a note explaining how it calculates the "recycled resin input" that is used again in Japan, PWMI writes as follows. The 2022 recycled volume of 1.75 Mt, less 1.22 Mt of exports and 0.04 Mt of waste PET bottles reused as fibre, leaves 0.48 Mt as the figure for the year (our paraphrase of the Japanese note)Sourced. That statement concerns the 2022 recycled volume, and the export share is about 70% of the 1.75 MtOur calculation (1.22 / 1.75 = 69.7%). In other words, much of what Japan counts as "mechanical recycling" is recycled overseas as plastic scrap or recycled material. This figure is the prior-year value given in a note to the 2023 edition and changes from year to year.
3. Our calculation: the same "recycling rate" changes with the definition
Let us set out the figures from the opening. Each is a published value from a public body or industry association, but because the denominator and numerator are placed differently, they cannot be compared directly.
| Figure | Source (year) | Denominator | Numerator | Caution |
|---|---|---|---|---|
| 22% / 89% | PWMI (2023 data, published December 2024) | Total waste plastic generated 7.69 Mt | Mechanical 1.71 Mt / mechanical + chemical + thermal 6.88 Mt | "Effective utilisation" includes heat recovery. Mechanical includes 0.30 Mt from unused offcuts |
| 9% | OECD Global Plastics Outlook (2019) | World plastic waste 353 Mt | "40% of the 15% collected becomes residue", so recycling is 9% | A world total. Large differences between countries |
| 9% (cumulative) | Geyer et al. (2017, cumulative 1950-2015) | Cumulative waste 6,300 Mt | Recycled about 600 Mt (9%). Of this, 10% was recycled more than once | Cumulative figure. Incinerated 12%, landfilled or in the environment 79% |
| 85.1% | Council for PET Bottle Recycling (FY2024) | Designated PET bottles sold 652,294 t | Domestic recycling 445,416 t + overseas recycling 109,779 t | Includes overseas recycling. Calculated by multiplying yield by recycling rate |
| 55% (target) | EU Packaging Waste Directive (Eurostat explanation) | Plastic packaging waste generated | Input to recycling (by weight) | Minimum target for 2030. In 2023 only Belgium (59.5%) and Latvia (59.2%) had reached it |
All Sourced (sources are References 1, 2, 3, 5 and 13). The 2030 target is a statutory goal, a Not yet confirmed aim.
4. A materials engineer's view (1): read the denominator and the numerator
Wherever a recycling rate is used (internal target setting, procurement, environmental claims), you need to check the following five points behind the number (the framing is this article's).
- What is the denominator? Waste generated, sales, or collection. Japan's PWMI uses "total waste plastic generated", the PET bottle council uses "sales", and Eurostat uses "packaging waste generated"Sourced
- At what point is the numerator counted? EU statistics count by default the input to the recycling process, and allow the output of a sorting plant to be used instead where it passes to recycling without lossSourced. The OECD's 9% excludes the portion thrown away as residue after collection (40% of what was collected)Sourced.
- Are exports included? The PET bottle figure of 85.1% includes 109,779 t recycled overseas. Counting only domestic recycling gives 445,416 / 652,294 = about 68%Our calculation.
- What does "recycled" mean? Melting back into resin (mechanical), or using as fuel or chemical feedstock (thermal, chemical)? Japan's 89% includes both.
- Post-consumer or in-factory? Is the re-feeding of offcuts counted? Of Japan's 1.71 Mt of mechanical recycling, 0.30 Mt comes from unused materialSourced.
What this shows is that even under the same words "recycling rate", the definition differs from one statistic to the next. Japan's PWMI counts quantities by treatment category, the PET bottle council counts recycled quantity against sales, and the EU counts input to recycling against packaging waste generated. The point is not which is "correct" but to choose the definition that suits your own question, and when quoting a figure to give source, year, denominator and numerator together (Commentary).
5. The mechanical recycling process — sorting, size reduction, washing, melting, repelletising
The process divides broadly into five steps. The Council for PET Bottle Recycling explains the terms as follows. Flake is PET bottle crushed into small pieces of roughly 8 mm square, washed thoroughly and dried; pellet is flake that has been melted once and formed into small granules (our paraphrase of the Council's Japanese explanation)Sourced.
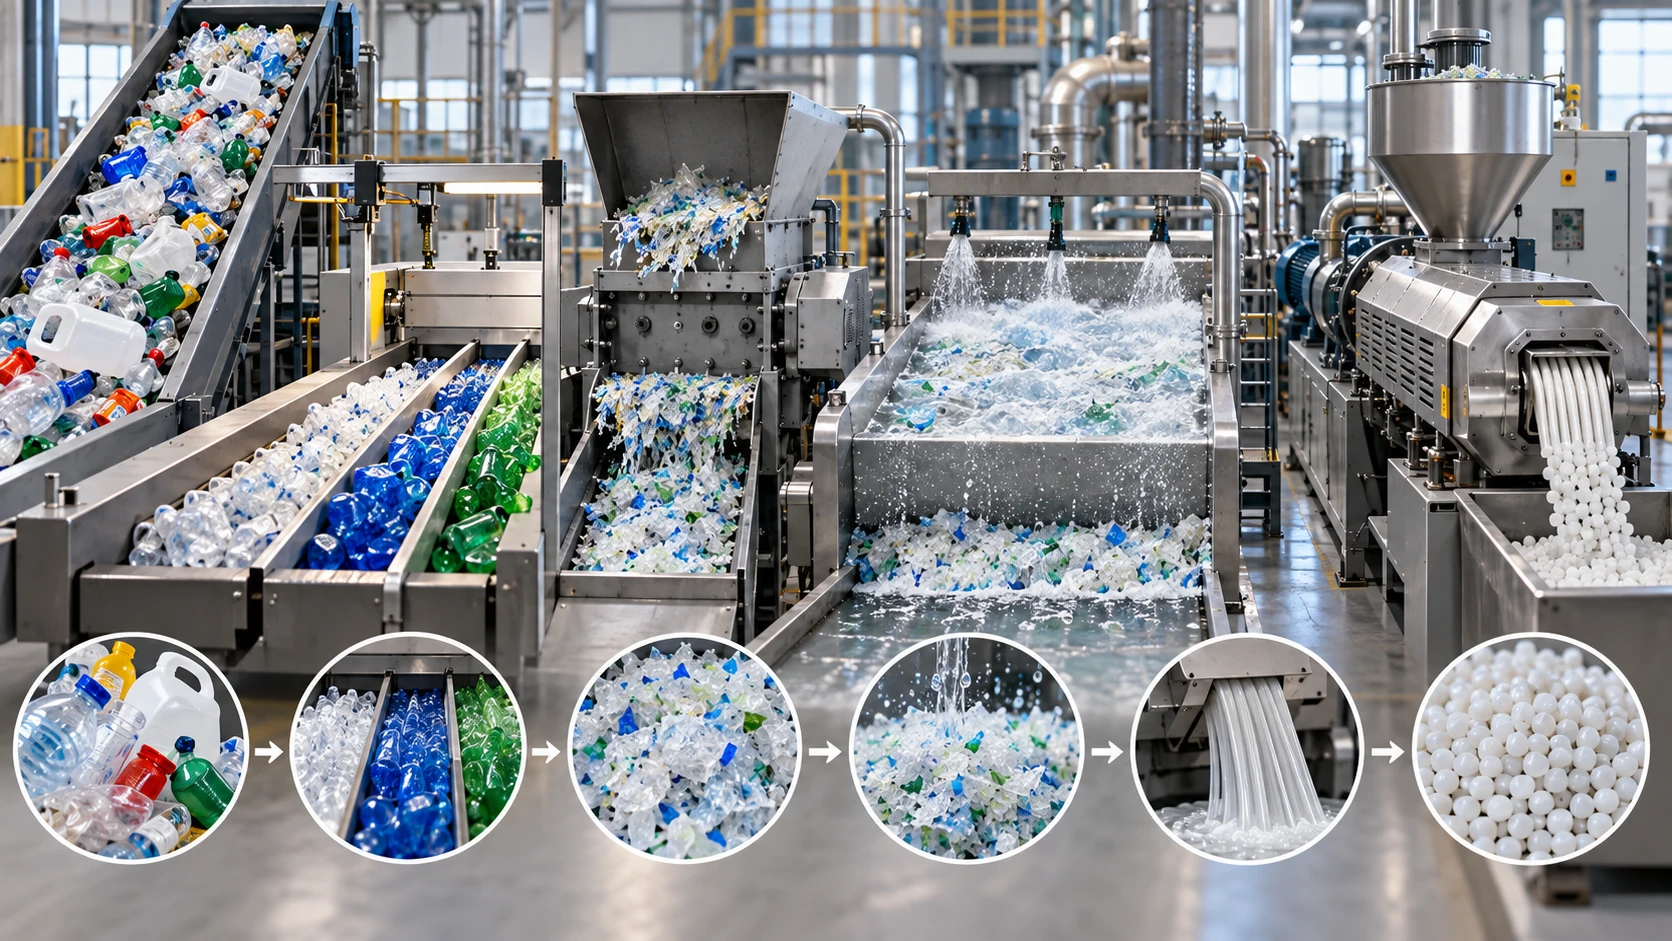
ImageGen conceptual illustration (not a real photograph or measurement). See the original diagram for exact values, names and structure.
Show original diagram with exact annotations and values
The International Organization for Standardization (ISO) publishes ISO 15270:2008, "Plastics — Guidelines for the recovery and recycling of plastics waste" as guidance for collecting and recycling plastic waste. According to ISO's catalogue entry, the standard sets out the recovery options for pre-consumer (in-factory) and post-consumer waste, and gives the quality requirements to consider across the whole recovery chain, together with general recommendations to be written into material standards, test standards and product specificationsSourced. The entry also records that the standard was reviewed and confirmed in 2018 and remains current, and that a revised multi-part version (ISO/DIS 15270-1 to 15270-4 and ISO 15270-5:2025) is in preparationSourced. The text of the standard is paid, so this article limits itself to the title and the stated scope.
6. A materials engineer's view (2): why quality falls and varies
The 2021 review by Schyns and Shaver covers the mechanical recycling of the five main packaging resins: PET, polyethylene, polypropylene, polystyrene and poly(vinyl chloride). It concludes that current mechanical recycling is limited by cost, degraded mechanical properties and inconsistent quality (our paraphrase of the abstract)Sourced. The review also discusses the mechanisms of degradation on reprocessing, polymer blends in mixed waste, and applications for low-quality recycled materialSourced.
What follows is a general account of polymer chemistry (Commentary by this article). Specific values vary greatly with material, grade and conditions, so none are given.
- Condensation polymers such as PET and polyamides: the ester and amide bonds in the backbone hydrolyse when they meet water at high temperature. If moisture remains during melting, molecular weight falls and so does melt viscosity (measured as intrinsic viscosity, IV). For recycled PET, steps such as solid-state polymerisation after melting are sometimes used to recover molecular weight.
- Polyolefins such as polyethylene and polypropylene: the carbon-carbon backbone resists hydrolysis, but heat, shear and oxygen cause chain scission, branching and crosslinking. Scission raises the melt flow rate (MFR) and crosslinking lowers flowability. Which dominates depends on the resin and conditions.
- Mixed resins: most different resins are immiscible. Even PE and PP, which look alike, phase-separate when mixed, and the interface becomes a weak point that tends to lower impact strength. A very small amount of another resin (for example PVC in PET) is often explained as decomposing at processing temperature and causing discolouration and degradation.
- Accumulation of additives: pigments, flame retardants, plasticisers and fillers do not disappear in recycling. The more waste from different applications is mixed, the further the composition of the recycled material drifts from any design.
- Variable supply: virgin resin has its composition controlled at a single plant, but the feedstock for recycled material changes in composition with collection source, season and region. The essence of "variation" lies less in degradation itself than in this diversity of feedstock.
Broader molecular-weight distribution, more impurities and duller colour combine to produce variation in the mechanical properties, appearance and processability of recycled material. Virgin resin is a material "made to a specification"; recycled material tends to be one where you work out the specification of what you have received, then use it accordingly (Commentary by this article).
Food-contact use is a separate hurdle
In the EU, recycled plastic that touches food is governed by Commission Regulation (EU) 2022/1616 (dated 15 September 2022). The regulation covers the placing on the market of food-contact materials containing waste-derived plastic, the development and operation of recycling technologies, processes and installations, and the use of recycled plastic in contact with food. Its preamble records that the previous Regulation (EC) No 282/2008 left some recycling technologies, such as chemical depolymerisation and the use of offcuts, outside its scope, so the new regulation rebuilds the framework to include themSourced. Bottle-to-bottle recycling of PET presupposes this kind of food-contact authorisation.
7. Closed loop and cascade — the relationship with virgin resin
The Council for PET Bottle Recycling explains that the mechanical recycling of PET bottles takes two forms, "cascade recycling" and "horizontal recycling", and that bottle-to-bottle is "horizontal recycling"Sourced. The Council promotes horizontal recycling, in which used PET bottles are made into PET bottles again, and sets a target of a 50% bottle-to-bottle share by fiscal 2030Not yet confirmed.
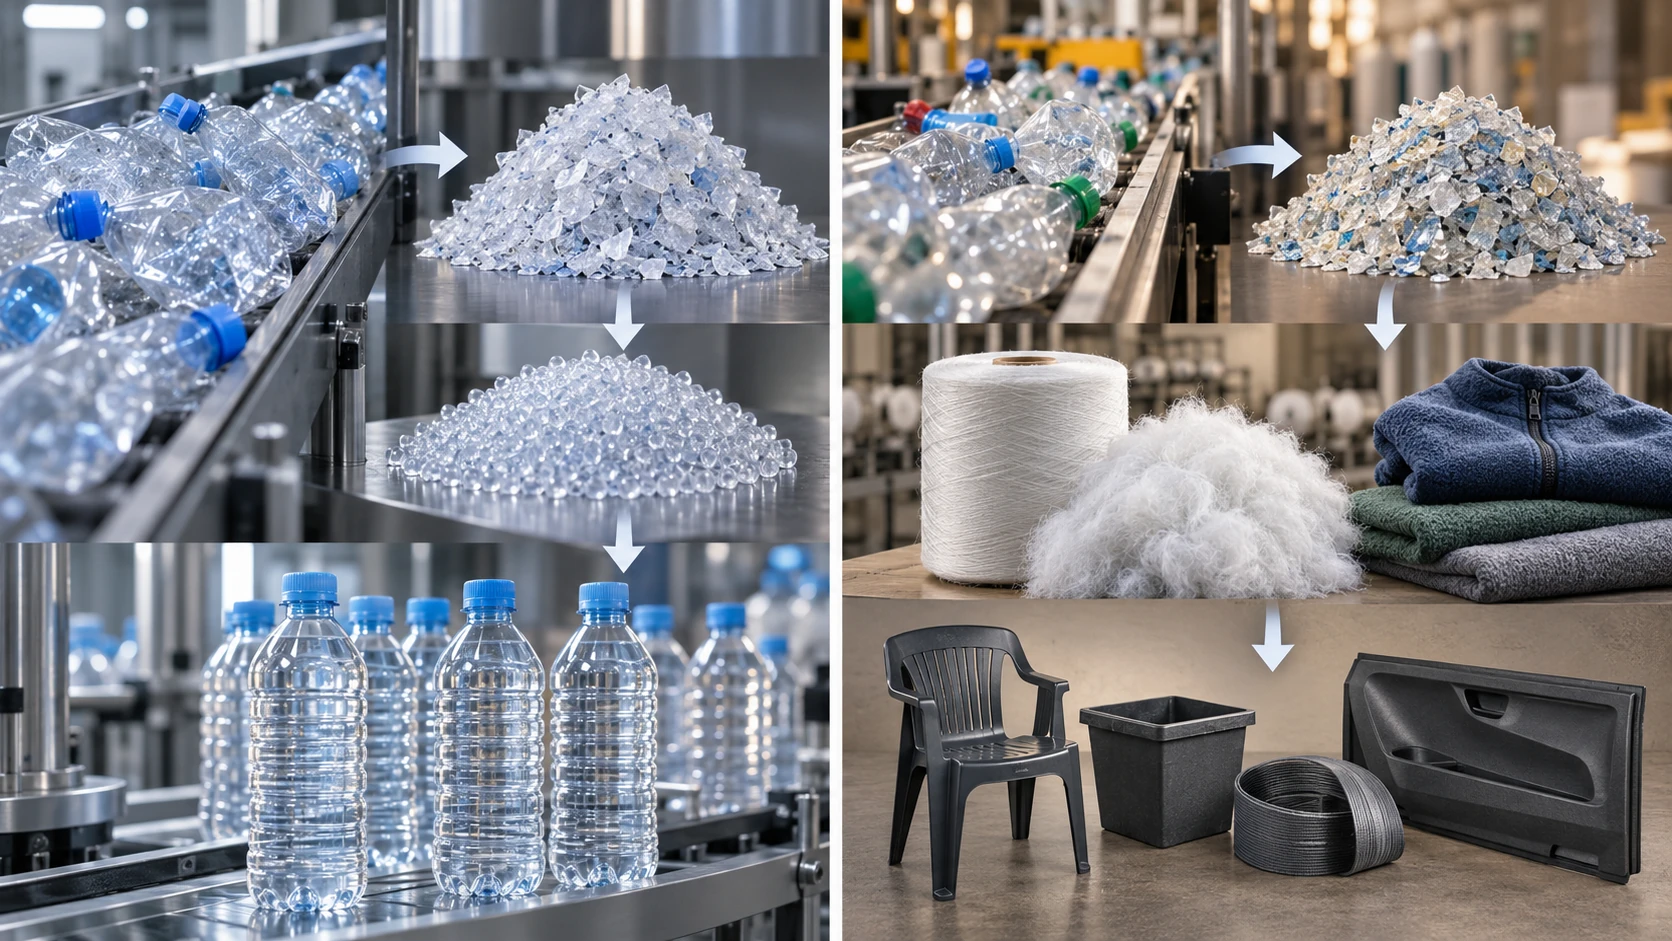
ImageGen conceptual illustration (not a real photograph or measurement). See the original diagram for exact values, names and structure.
Show original diagram with exact annotations and values
Using the Council's statistics on the uses of recycled PET resin [Reference 6], we can calculate the share of bottle-to-bottle in the domestic recycled flake by use.
The composition by use in fiscal 2024 is bottle-to-bottle 57.7%, sheet 25.5%, fibre 7.8% and moulded products 6.8%Sourced. Because a bottle touches food directly, it is the use with the strictest regulation (a framework like EU Regulation 2022/1616 in the previous section) and the strictest purity and molecular-weight requirements (Commentary). That the share rose from around 13% in fiscal 2012 to 57.7% in fiscal 2024 suggests that sorting, washing and decontamination, together with recovery of molecular weight, have reached a level that works in mass production (our reading). At the same time, the Council's statistics explain that China's ban on imports of solid waste from January 2018 reduced exports of used PET bottles and raised domestic recyclingSourced. So it is not only technology but also a change in trade that has pushed up the share of horizontal recycling.
The relationship with virgin resin
According to the OECD (2022), global production of recycled (secondary) plastics rose from 6.8 Mt in 2000 to 29.1 Mt in 2019, but this is only 6% of total plastics production, and most of the plastic in use today is virgin resin (derived from crude oil and gas). The OECD says recycled plastics are still regarded as a substitute for virgin resin, and points out that setting recycled-content targets and investing in recycling technology could make the market competitiveSourced. Dividing 29.1 Mt by the world production of 460 Mt in 2019 gives about 6.3%Our calculation.
In PWMI's diagram, the domestic input of recycled resin is given as 0.48 MtSourced. Against the domestic resin input of 8.32 Mt in the same diagram, that is a scale of about 5.8% (0.48 / 8.32; the scope of "input" follows the diagram's definition)Our calculation. The amount by which recycled material actually replaces virgin resin is smaller than the "rate" figures suggest, which is the background to demand-side measures, such as recycled-content mandates, being introduced in many countries (Commentary by this article).
8. A worked example with PET bottles — calculating the denominator and numerator
PET bottles are the best-documented example of mechanical recycling in Japan. The Council publishes the details of its calculation: the recycling rate for fiscal 2024 was 85.1%, the denominator (designated PET bottles sold) was 652 thousand tonnes (652,294 t), and the numerator was domestic recycling of 445 thousand t + overseas recycling of 110 thousand t = 555 thousand t in totalSourced. (Here "designated PET bottles" means the PET bottles covered by Japan's container and packaging recycling system.)
| Stage | Quantity / rate (FY2024) | Note |
|---|---|---|
| [Denominator] Designated PET bottles sold | 652,294 t | Domestic products 648,831 t + imported products 3,463 t |
| Municipal collection (meeting the separation standard) | 334,369 t | Ministry of the Environment preliminary data |
| Business-sector bottle collection | 300,556 t | Council survey |
| Share processed domestically | Municipal 95.0% / business 83.9% | The rest goes overseas |
| Recycling rate (against domestically directed collection) | Municipal 84.7% / business 69.9% | Not everything collected becomes recycled product |
| [Numerator] Domestic recycled quantity | 445,416 t | 317,745 x 84.7% + 252,246 x 69.9% |
| [Numerator] Overseas recycled quantity | 109,779 t | Calculated from exported flake of 123,035 t and other data, using yield rates |
| Recycled quantity / rate | 555,195 t / 85.1% | 555,195 / 652,294 |
All Sourced (Council for PET Bottle Recycling, calculation of the recycling rate [Reference 5]). The same page notes that figures may not add up exactly because of rounding.
Our calculation We check the following relationships using only the published values.
- Share from domestic recycling alone: 445,416 / 652,294 = about 68.3% (excluding the overseas part)
- Overseas share of the numerator: 109,779 / 555,195 = about 19.8%
- Loss on domestically directed collection: for municipal collection (domestic) 100 - 84.7 = about 15%, and for business-sector collection (domestic) 100 - 69.9 = about 30% falls outside the definition of the recycling rate
- Cross-check: 317,745 x 0.847 + 252,246 x 0.699 = about 269,100 + 176,300 = about 445,400. This agrees closely with the published 445,416 t (the rates are rounded to one decimal place)
Premises and limits: the "recycling rate" is a rate the Council set by survey, and this page does not let us read off exactly how it takes its denominator and numerator. The losses above probably reflect mainly caps, labels, foreign matter and dirt removed during sorting and washing, but the page publishes no breakdown, so we cannot say so definitively (Commentary).
9. Policy: the EU PPWR and Japan's Plastic Resource Circulation Act
EU: the Packaging and Packaging Waste Regulation (PPWR)
Regulation (EU) 2025/40 (dated 19 December 2024, published in the Official Journal on 22 January 2025) replaces the 1994 Packaging Directive. According to the European Commission, it entered into force on 11 February 2025 and applies from 12 August 2026Sourced. For plastic packaging it rests on two pillars.
- Article 7: minimum recycled content. An obligation to include recycled material "recovered from post-consumer plastic waste" by 2030 (or three years after the entry into force of the implementing act, whichever is later), at 30% for contact-sensitive PET packaging (other than single-use beverage bottles), 10% for contact-sensitive packaging of other plastics, 30% for single-use beverage bottles and 35% for other plastic packaging. By 2040 the figures are 50%, 25%, 65% and 65% respectivelySourced. This obligation is a statutory schedule and depends on the implementing legislation being put in placeNot yet confirmed.
- Article 6: recyclable packaging. All packaging must be recyclable. The conditions are that the design is suited to recycling (from 1 January 2030, or 24 months after the delegated act enters into force, whichever is later) and that the packaging can be collected, sorted and recycled at scale (from 1 January 2035; for the at-scale requirement, from 1 January 2035 or five years after the implementing act enters into force, whichever is later). Performance is expressed in grades A, B and C, and from 1 January 2038 packaging other than grade A or B cannot be placed on the marketSourced.
How recycled content is counted matters even more. Article 7 provides that the European Commission will adopt, by 31 December 2026, an implementing act setting the method for calculating and verifying recycled content, and a delegated act setting sustainability criteria for recycling technologies. Only material recycled by technologies that meet the criteria (in the EU, or in a third country under equivalent criteria) counts as recycled contentSourced. We could not confirm this implementing act or delegated act at the time of our research. It bears on how chemical recycling is treated, and we return to it in our explainer on chemical recycling.
EU: the Single-Use Plastics Directive and the food-contact regulation
- Directive (EU) 2019/904, Article 6(5): an obligation to include at least 25% recycled plastic in beverage bottles whose main component is PET from 2025 and at least 30% in all beverage bottles from 2030 (calculated as an average across each member state's market)Sourced.
- Regulation (EU) 2022/1616: the framework for recycled plastic in contact with food (previous section).
Japan: the Plastic Resource Circulation Act
The Act on Promotion of Resource Circulation for Plastics (the Plastic Resource Circulation Act) was enacted in June 2021 (Reiwa 3) and came into force on 1 April 2022 (Reiwa 4)Sourced. Its aim is to promote "3R + Renewable" (reduce, reuse, recycle, plus the use of renewable resources) among every party at every stage from product design to waste treatment, and it provides the following five measures.
| Stage | Measure (Ministry of the Environment / METI pamphlet) | Main parties |
|---|---|---|
| Design and manufacture | Design guidelines for plastic products (with a certification scheme for conforming designs) | Manufacturers etc. |
| Sale and provision | Rationalised use of designated single-use plastic products (12 items) | Retailers and service providers etc. |
| Discharge, collection and recycling | Separate collection and recommercialisation by municipalities | Municipalities |
| Discharge, collection and recycling | Voluntary collection and recycling by manufacturers and sellers | Manufacturers, sellers etc. |
| Discharge, collection and recycling | Waste reduction and recycling by waste-generating businesses | Waste-generating businesses |
All Sourced (Ministry of the Environment / METI pamphlet [Reference 15]; overview from the Ministry of Agriculture, Forestry and Fisheries [Reference 16]).
A feature of the Japanese framework is that the body of the law has no recycled-content obligation like the EU's; the emphasis is on design guidelines (the use of recycled plastic is one item in them) and on building collection and recycling systems (Commentary by this article). Numerical targets appear in the 2019 Plastic Resource Circulation Strategy, for example "double recycling by 2030" and "effectively use 100% of used plastic through reuse, recycling and so on by 2035"Not yet confirmed (the strategy outline as given in the pamphlet; our paraphrase).
10. A materials engineer's view (3): recyclability is decided by design
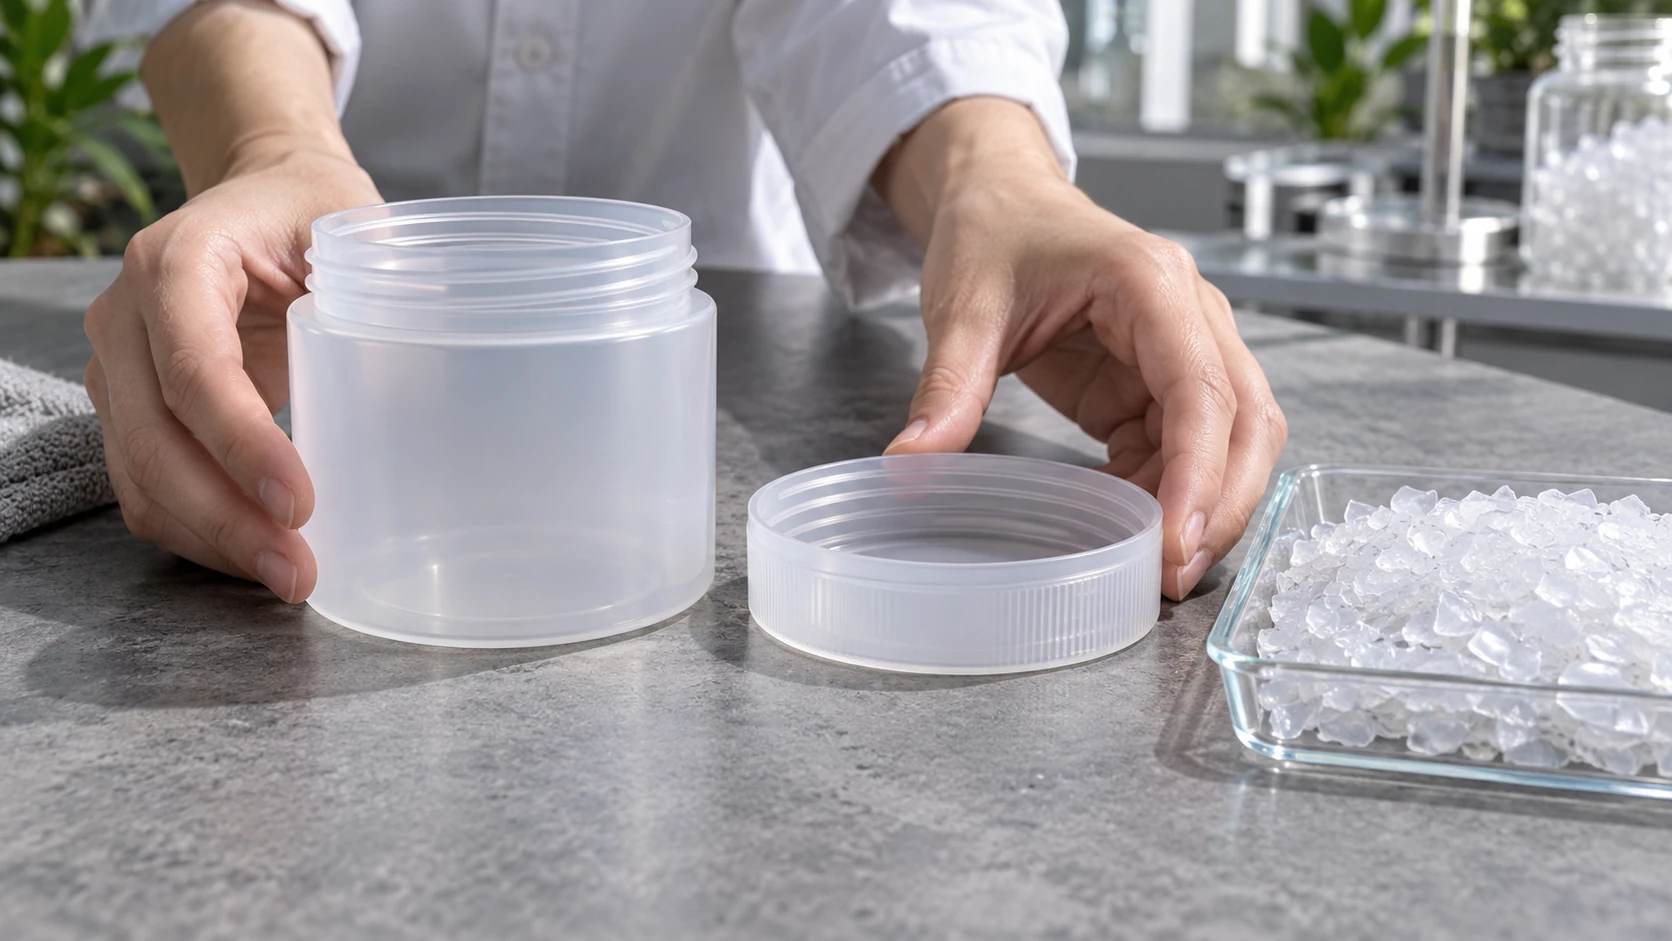
The design guidelines from the Ministry of the Environment and METI list the following matters to addressSourced. Structure: weight reduction, simpler packaging, longer use and longer life, parts that are easy to reuse, single-material construction and the like, easier disassembly and separation, easier collection and transport, easier crushing and incineration. Materials: substitution by non-plastic materials, use of materials that are easy to recycle (fewer kinds of material; avoiding additives that obstruct recycling), use of recycled plastic, and use of bioplastics. The guidelines also note that these can trade off against one another, and call for an overall assessment of environmental impact across the product life cycleSourced.
Read from the materials side, the guidelines are the mirror image of the reasons for falling quality in the earlier sections (Commentary by this article).
- Single-material construction: do not create at the outset a mixture that sorting cannot remove. Laminating immiscible resins can deliver function but becomes a weak point on recycling.
- Multilayer films: stacking different resins to achieve barrier properties means that, in recycling, other resins end up mixed in. It is a trade-off with barrier performance (covered in our explainer on barrier properties and coatings).
- Additives: pigments, flame retardants and plasticisers cannot be removed downstream. Avoiding additives that obstruct recycling means solving, through formulation design, a problem the recycling process cannot solve.
- Marking: labelling the material helps sorting. The guidelines include marking the type of material usedSourced.
The PET bottle industry adopted this thinking early. The Council for PET Bottle Recycling explains that for over 30 years it has operated its voluntary design guideline for designated PET bottles (in Japanese) as "design for easily recycled products"Sourced. The lesson for materials engineers is that the surest way to raise the quality of recycled material lies not in technology after collection but in design before use (Commentary by this article).
11. Open problems, and what we could not confirm
(1) Definitions are not aligned, so figures cannot be compared
As Section 3 showed, the denominator and numerator differ by country, body and scope. The PPWR leaves the method of counting recycled content to implementing legislation due by the end of 2026Not yet confirmed.
(2) Quality of recycled material, and demand
The OECD points out that recycled material cannot avoid degradation and variation and tends to be regarded as a substitute for virgin resinSourced. That is the background to demand-side measures (recycled-content obligations), but how far quality can be secured while meeting the obligation will not be known until implementation.
(3) What we could not confirm
- The 2024-data edition of Japan's material flow diagram: the edition we could confirm covers 2023 data (published December 2024). A newer edition may have been issued.
- The PPWR implementing and delegated acts: adoption is scheduled by 31 December 2026, but we could not confirm whether they had been adopted at the time of our research (October 2026).
- Numerical properties of recycled material: specific property values for recycled PET, PE, PP and others (tensile strength, the fall in intrinsic viscosity and so on) are not given, because setting side by side published values obtained under different conditions would mislead.
- The content of ISO 14021 (self-declared environmental claims, including recycled content): we confirmed from ISO's catalogue that the 2016 edition has been withdrawn and a 2026 edition published, but the text is paid and we have not gone into its content.
- Environmental impact across the whole life cycle: whether recycling is better for the environment is a comparison covered in our explainer on microplastics and life cycle assessment.
- Of Japan's 7.69 Mt of waste plastic, mechanical recycling is 1.71 Mt (22%), and most of the 89% "effective utilisation" is heat recoverySourced.
- The 1.71 Mt includes 0.30 Mt from unused offcuts; counting post-consumer products alone, it is about 20%Our calculation.
- The PET bottle figure of 85.1% includes overseas recycling; domestic recycling alone is about 68%Our calculation.
- Lower quality and variation come from molecular damage and the diversity of feedstock, and measures at the design stage (single-material construction and so on) are effective (Commentary).
- The EU PPWR applies from 12 August 2026 and sets recycled-content levels and recyclability grades. The method for counting recycled content is left to implementing legislation due by the end of 2026Sourced.
12. Glossary
- Mechanical (material) recycling
- Melting used resin and so on to turn it into a resin material again. Japanese statistics also call it "recycling for reuse".
- Thermal recycling
- Treatment that recovers energy as fuel, power generation or heat. Japanese statistics include it in "effective utilisation".
- Chemical recycling
- Returning material to feedstock or monomers by chemical reaction. Includes blast-furnace feedstock, gasification and oil recovery.
- Effective utilisation rate
- The recycling rate plus the heat recovery rate (excluding simple incineration and landfill). The PET bottle council's definition.
- Flake
- Small pieces of PET bottle crushed to about 8 mm square, washed and dried.
- Pellet
- Flake and the like melted once and formed into small granules.
- Horizontal recycling
- Making PET bottles again from used PET bottles (bottle-to-bottle).
- Cascade recycling
- Recycling that is handed on through successively lower uses.
- Post-consumer
- Waste discharged after use by consumers. Distinguished from in-factory offcuts (pre-consumer).
- PPWR
- The EU Packaging and Packaging Waste Regulation (Regulation (EU) 2025/40). Applies from 12 August 2026.
- 3R + Renewable
- The basic principle of Japan's plastics policy: reduce, reuse and recycle, plus the use of renewable resources.
- MFR
- Melt flow rate. A measure of how readily molten resin flows, and a guide to changes in molecular weight.
13. References
- Plastic Waste Management Institute (PWMI) "Production, disposal, recycling and treatment of plastic products in Japan: Material Flow Diagram 2023", published December 2024 (PDF, in Japanese) — pwmi.or.jp
- OECD "Plastic pollution is growing relentlessly as waste management and recycling fall short, says OECD", 22 February 2022 (press release for the Global Plastics Outlook) — oecd.org
- Geyer, Jambeck, Law “Production, use, and fate of all plastics ever made”, Science Advances 3, e1700782 (2017). DOI 10.1126/sciadv.1700782 — pmc.ncbi.nlm.nih.gov
- Schyns, Shaver “Mechanical Recycling of Packaging Plastics: A Review”, Macromolecular Rapid Communications 42, 2000415 (2021). DOI 10.1002/marc.202000415 — pubmed.ncbi.nlm.nih.gov
- Council for PET Bottle Recycling "Calculation of the recycling rate (FY2024)" (in Japanese) — petbottle-rec.gr.jp
- Council for PET Bottle Recycling "Uses of recycled PET resin" (in Japanese) — petbottle-rec.gr.jp
- Council for PET Bottle Recycling "Material recycling" (in Japanese) — petbottle-rec.gr.jp
- Council for PET Bottle Recycling "Recommercialisation (for businesses)" (in Japanese) — petbottle-rec.gr.jp
- Council for PET Bottle Recycling "Basic terms (keywords)" (in Japanese) — petbottle-rec.gr.jp
- European Parliament and Council Regulation (EU) 2025/40 on packaging and packaging waste, 19 December 2024 (Official Journal, 22 January 2025) — eur-lex.europa.eu
- European Commission, Directorate-General for Environment "Packaging waste" — environment.ec.europa.eu
- European Parliament and Council Directive (EU) 2019/904 on the reduction of the impact of certain plastic products on the environment, 5 June 2019 — eur-lex.europa.eu
- Eurostat "Packaging waste statistics" (Statistics Explained) — ec.europa.eu/eurostat
- European Commission Regulation (EU) 2022/1616 on recycled plastic materials and articles intended to come into contact with foods, 15 September 2022 — eur-lex.europa.eu
- Ministry of Economy, Trade and Industry (METI) and Ministry of the Environment "About the Act on Promotion of Resource Circulation for Plastics" (pamphlet, PDF, in Japanese) — plastic-circulation.env.go.jp
- Ministry of Agriculture, Forestry and Fisheries "Overview of the Act on Promotion of Resource Circulation for Plastics (Act No. 60 of 2021)" (PDF, in Japanese) — maff.go.jp
- ISO ISO 15270:2008 “Plastics — Guidelines for the recovery and recycling of plastics waste” — iso.org
14. Claim-to-source audit
| Claim in the text | Basis | Label |
|---|---|---|
| For 2023: total waste plastic generated 7.69 Mt, effective utilisation 6.88 Mt (89%), unused 0.81 Mt (11%). Mechanical recycling 1.71 Mt (22%), chemical 0.26 Mt (3%), solid fuel / cement kilns 1.95 Mt, gasification (fuel use) 0.14 Mt, incineration with power generation 2.36 Mt, incineration with heat use 0.47 Mt, simple incineration 0.58 Mt, landfill 0.24 Mt. The 1.71 Mt of mechanical recycling splits into used products 1.41 Mt (82.5%) and unused material (production and processing losses) 0.30 Mt. Used-product waste 7.10 Mt. Recycled resin input 0.48 Mt, domestic resin input 8.32 Mt. The note that the 1.75 Mt recycled volume less 1.22 Mt of exports and 0.04 Mt of waste PET bottles reused as fibre leaves 0.48 Mt. PWMI's allocation to "thermal" and "chemical" (gasification is split by end use). Published December 2024 | PWMI Material Flow Diagram 2023, Reference 1https://www.pwmi.or.jp/flow_pdf/flow2023.pdf | Sourced |
| World plastic waste 353 Mt (2019), recycling 9% (40% of the 15% collected becomes residue), incineration 19%, landfill 50%, mismanaged 22%. World production of recycled plastic rising from 6.8 Mt in 2000 to 29.1 Mt in 2019, 6% of total production. Total production 460 Mt (2019). That most is virgin resin and recycled material is regarded as a substitute. That setting recycled-content targets and investing in recycling technology could make the secondary market competitive. That microplastics are defined as synthetic polymers under 5 mm | OECD press release (22 February 2022), Reference 2https://www.oecd.org/en/about/news/press-releases/2022/02/plastic-pollution-is-growing-relentlessly-as-waste-management-and-recycling-fall-short.html | Sourced |
| Of the cumulative 6,300 Mt of plastic waste generated in 1950-2015, about 9% was recycled, 12% incinerated and 79% landfilled or in the environment. Of the roughly 600 Mt recycled, 10% was recycled more than once. The point that before 1980 plastic recycling and incineration were negligible | Geyer et al. (2017), Reference 3https://pmc.ncbi.nlm.nih.gov/articles/PMC5517107/ | Sourced |
| That the review covers the mechanical recycling of PET, PE, PP, PS and PVC, and that current processes are limited by cost, degraded mechanical properties and inconsistent quality. That it discusses degradation mechanisms on reprocessing, polymer blends in mixed waste, and uses for low-quality recycled material | Schyns and Shaver (2021), abstract, Reference 4https://pubmed.ncbi.nlm.nih.gov/33000883/ | Sourced |
| PET bottle recycling rate for FY2024 of 85.1%. Denominator 652,294 t (domestic products 648,831 t + imported products 3,463 t). Numerator 555,195 t (domestic 445,416 t + overseas 109,779 t). Municipal collection 334,369 t, business-sector collection 300,556 t, domestic processing shares of 95.0% and 83.9%, recycling rates of 84.7% and 69.9%, domestically directed collection of 317,745 t and 252,246 t, exported flake 123,035 t. The explanation that China's ban on solid waste imports from January 2018 reduced exports and increased domestic recycling | Council for PET Bottle Recycling, calculation of the recycling rate, Reference 5https://www.petbottle-rec.gr.jp/data/calculate.html | Sourced |
| Trend in domestic recycled flake by use (thousand t), FY2012-2024: total 206.2 to 426.2, bottle-to-bottle 27.1 to 246.0. FY2024 composition (bottle-to-bottle 57.7%, sheet 25.5%, fibre 7.8%, moulded products 6.8%, packaging film and labels 1.0%). The note that from FY2012 "bottle-to-bottle" is the quantity used for food-use PET bottles | Council for PET Bottle Recycling, uses of recycled PET resin, Reference 6https://www.petbottle-rec.gr.jp/data/use.html | Sourced |
| That PET bottle mechanical recycling has two forms, "cascade recycling" and "horizontal recycling", and that bottle-to-bottle is horizontal recycling | Council for PET Bottle Recycling, material recycling, Reference 7https://www.petbottle-rec.gr.jp/more/material.html | Sourced |
| That flake is PET bottle crushed to small pieces of about 8 mm square, washed well and dried, and that pellet is flake melted once and formed into small granules | Council for PET Bottle Recycling, recommercialisation (for businesses), Reference 8https://www.petbottle-rec.gr.jp/more/recycling.html | Sourced |
| The definition of horizontal recycling (making PET bottles again from used PET bottles). The target of a 50% bottle-to-bottle share by FY2030. The definition of the effective utilisation rate (the recycling rate plus the heat recovery rate). That a voluntary design guideline has been operated for over 30 years | Council for PET Bottle Recycling, basic terms, Reference 9https://www.petbottle-rec.gr.jp/basic/keyword.html | Sourced |
| The PPWR's full title and dates (dated 19 December 2024, Official Journal 22 January 2025). Article 6 (all packaging to be recyclable; design from 1 January 2030 or 24 months after the delegated act enters into force, whichever is later; collection, sorting and recycling at scale from 1 January 2035 or five years after the implementing act enters into force, whichever is later; grades A, B and C; from 2038 only A or B). Article 7 (recycled content of 30%, 10%, 30% and 35%, and in 2040 50%, 25%, 65% and 65%; derived from post-consumer plastic waste; annual average per manufacturing plant; by 31 December 2026 an implementing act on calculation and verification and a delegated act on sustainability criteria for recycling technologies). Application date 12 August 2026 | Regulation (EU) 2025/40, Reference 10https://eur-lex.europa.eu/eli/reg/2025/40/oj/eng | Sourced |
| That the PPWR entered into force on 11 February 2025 and applies from 12 August 2026. That it replaces the 1994 Packaging Directive. That all packaging is to be economically recyclable by 2030 | European Commission, Directorate-General for Environment, Reference 11https://environment.ec.europa.eu/topics/waste-and-recycling/packaging-waste_en | Sourced |
| Article 6(5) of the Single-Use Plastics Directive (25% recycled plastic in PET beverage bottles from 2025 and 30% in all beverage bottles from 2030, as a member-state market average) | Directive (EU) 2019/904, Reference 12https://eur-lex.europa.eu/eli/dir/2019/904/oj/eng | Sourced |
| The EU packaging waste target (55% for plastics by weight by 2030). In 2023, EU packaging waste of 79.7 million t, of which plastic 15.8 million t (19.8%). In 2023 only Belgium (59.5%) and Latvia (59.2%) reached the plastic packaging target; the lowest was Hungary at 23.0%. The rule that the weight of packaging waste recycled is counted as input to the recycling or recovery process, and that the output of a sorting plant may be used instead where it passes to recycling without significant loss | Eurostat, Packaging waste statistics, Reference 13https://ec.europa.eu/eurostat/statistics-explained/index.php?title=Packaging_waste_statistics | Sourced |
| That Commission Regulation (EU) 2022/1616 covers the placing on the market of food-contact materials containing waste-derived plastic, the development and operation of recycling technologies, processes and installations, and the use of recycled plastic in contact with food. That the former Regulation (EC) No 282/2008 left chemical depolymerisation, the use of offcuts and the like outside its scope. Dated 15 September 2022 | Regulation (EU) 2022/1616, Reference 14https://eur-lex.europa.eu/eli/reg/2022/1616/oj/eng | Sourced |
| The purpose of the Plastic Resource Circulation Act (3R + Renewable), its enactment in June 2021, the structure of the measures (design guidelines, 12 designated single-use plastic products, separate collection and recommercialisation by municipalities, voluntary collection and recycling, waste-generating businesses). The items in the design guidelines (single-material construction, easier disassembly and separation, avoiding additives that obstruct recycling, material marking, use of recycled plastic and bioplastics, the reference to trade-offs). The milestones of the Plastic Resource Circulation Strategy (double recycling by 2030, effectively use 100% of used plastic by 2035) | METI and Ministry of the Environment pamphlet, Reference 15https://plastic-circulation.env.go.jp/wp-content/themes/plastic/assets/pdf/pamphlet.pdf | Sourced |
| That the Act came into force on 1 April 2022 (Reiwa 4) and is Act No. 60 of 2021 | Ministry of Agriculture, Forestry and Fisheries overview, Reference 16https://www.maff.go.jp/j/shokusan/recycle/youki/plastic/gaiyou.pdf | Sourced |
| The title of ISO 15270:2008, its scope covering recovery options and quality requirements for pre-consumer and post-consumer waste, that it was confirmed in 2018 and is current, and that revised editions are in preparation. | ISO catalogue page for ISO 15270:2008, Reference 17https://www.iso.org/standard/45089.html | Sourced |
| The PPWR's recycled-content obligations, and the implementing and delegated acts setting sustainability criteria and the calculation method for recycling technologies (adoption scheduled by 31 December 2026). The PET bottle council's 50% bottle-to-bottle target. The milestones of the Plastic Resource Circulation Strategy (2030 and 2035) | Statutory schedules or targets of bodies and governments, not resultshttps://eur-lex.europa.eu/eli/reg/2025/40/oj/eng | Not yet confirmed |
| Thermal recycling 4.92 Mt and 64% (1.95 + 0.14 + 2.36 + 0.47, divided by 7.69). Used-product share 1.41 / 7.10 = 19.9%. Exports 1.22 / 1.75 = 69.7%. 0.48 / 8.32 = 5.8%. Domestic recycling 445,416 / 652,294 = 68.3%. Overseas share 109,779 / 555,195 = 19.8%. About 15% and about 30% as the complement of the recycling rates of 84.7% and 69.9%. The cross-check 317,745 x 0.847 + 252,246 x 0.699 = about 445,400. The bottle-to-bottle ratio (each year's bottle-to-bottle quantity divided by the total). OECD 15% x (1 - 0.40) = 9%. 29.1 / 460 = about 6.3% | Our calculation. Each starts from published values and allows for differences from rounding. The denominators and numerators are each body's own definitions, used as they are | Our calculation |
| The explanations of hydrolysis in PET and polyamides, chain scission and crosslinking in polyolefins, resin immiscibility, accumulation of additives and diversity of feedstock. Steps such as solid-state polymerisation to recover molecular weight. The five-step division of the process and the quality points at each step | General explanation of polymer chemistry and processing. Specific values and conditions vary with material and grade, so no numbers are given | Commentary |
| That there is no standardised definition of the terms "downcycling" and "upcycling". The reading that most of Japan's "recycling for reuse" is fuel use. The proposal that denominator and numerator be quoted together, given the differences between EU and Japanese definitions. The reading of design responses (single-material construction, multilayer films, additives, marking). The reading of why horizontal recycling has grown | This article's framing and commentary based on published content. Not views stated by the bodies concerned | Commentary |
| The 2024-data edition of Japan's material flow diagram, the adoption status of the PPWR implementing and delegated acts, numerical properties of recycled material, the content of the text of ISO 14021, and the life-cycle environmental impact of recycling | Not given because they could not be confirmed from published primary sources within the scope of this article, or are paid or out of scope | Commentary |
| That Figs. 1, 2, 3, 4, 5 and 6 are explanatory drawings rather than original statistical charts, plant drawings or observed images, and that the hero image and Fig. 7 are AI-generated images | Our note | Commentary |
Last updated 2 October 2026. Sources are limited to primary material (statistics and publications from industry associations and public bodies, EU legislation, Japanese ministry documents, peer-reviewed papers and the catalogue page of a standards body). No market estimates from research firms are used. General explanations of polymer chemistry and processing are marked as Commentary and kept separate from sourced fact. The 2024-data edition of Japan's statistics, the adoption status of the PPWR implementing legislation, specific numerical properties of recycled material and the content of ISO 14021 are not stated here because they could not be confirmed. Figs. 1 and 5 are drawings based on published values; Figs. 2, 3, 4 and 6 are vector drawings; the hero image and Fig. 7 are AI-generated images. None of them shows a real plant, product or micrograph.