COMPANY PROFILE / SEMICONDUCTOR BACK-END
ASE Group
The company that became number one in the back end, and what it actually turned out to be
ASE is the world's largest OSAT, a contractor that specialises in semiconductor back-end work, meaning assembly and test. Yet four tenths of its revenue comes not from the back end at all but from contract electronics manufacturing (EMS) for smartphones and automotive equipment. This profile checks what "the world's largest back-end company" really does, and how much of it, using only figures from the statutory filings the company has made with the U.S. Securities and Exchange Commission.
- ASE Group in 30 seconds
- The logo and how the name is written
- What the company actually does: OSAT versus foundry
- Scale: five years of revenue
- Company category and position in the back-end industry
- Sites and the countries where it manufactures
- Leading products and share in semiconductor back-end work
- Current investment plans
- Major corporate partners
- Where the company is heading in this field
- The risks this company carries
- Glossary, references and claim-to-source audit
1. ASE Group in 30 seconds
New York Stock Exchange ASXTraded in the U.S. as ADRs, one ADS representing two ordinary shares
(US$20.6bn)Up 8.4% year on year
(OSAT plus EMS)Runs contract back-end work and contract electronics manufacturing side by side
(US$5.47bn)1.8 times the prior year. The 2026 plan is not disclosed
ASE's revenue splits three ways: packaging 47.8%, test 11.1% and EMS 39.8% Our calculation. Back-end work, that is packaging plus test, is about 59% of revenue. The remaining four tenths is EMS, the business of building smartphone modules and automotive units, which is a different industry from semiconductor packaging. The label "world's largest OSAT" makes the whole company sound like a back-end business, but what it really is, is a back-end company and a contract electronics manufacturer fused together. This article keeps the two apart throughout.
2. The logo and how the name is written

The ASE logo is a registered trademark of the company. Nothing here is redrawn or generated; where the mark is shown it is the official file taken from the company's own website. An AI-drawn approximation of a logo is wrong both as trademark use and as fact.
A note on style: in English the company is ASE or ASE Group, and the holding company is abbreviated ASEH. The cover of its statutory filings carries the company's Chinese-language legal name, with ASE Technology Holding Co., Ltd. presented as the English translation of it Sourced. Coverage in other languages sometimes transliterates the Chinese name instead, but the company's own English-language disclosure uses ASE throughout.
Official site: https://www.aseglobal.com3. What the company actually does: OSAT versus foundry
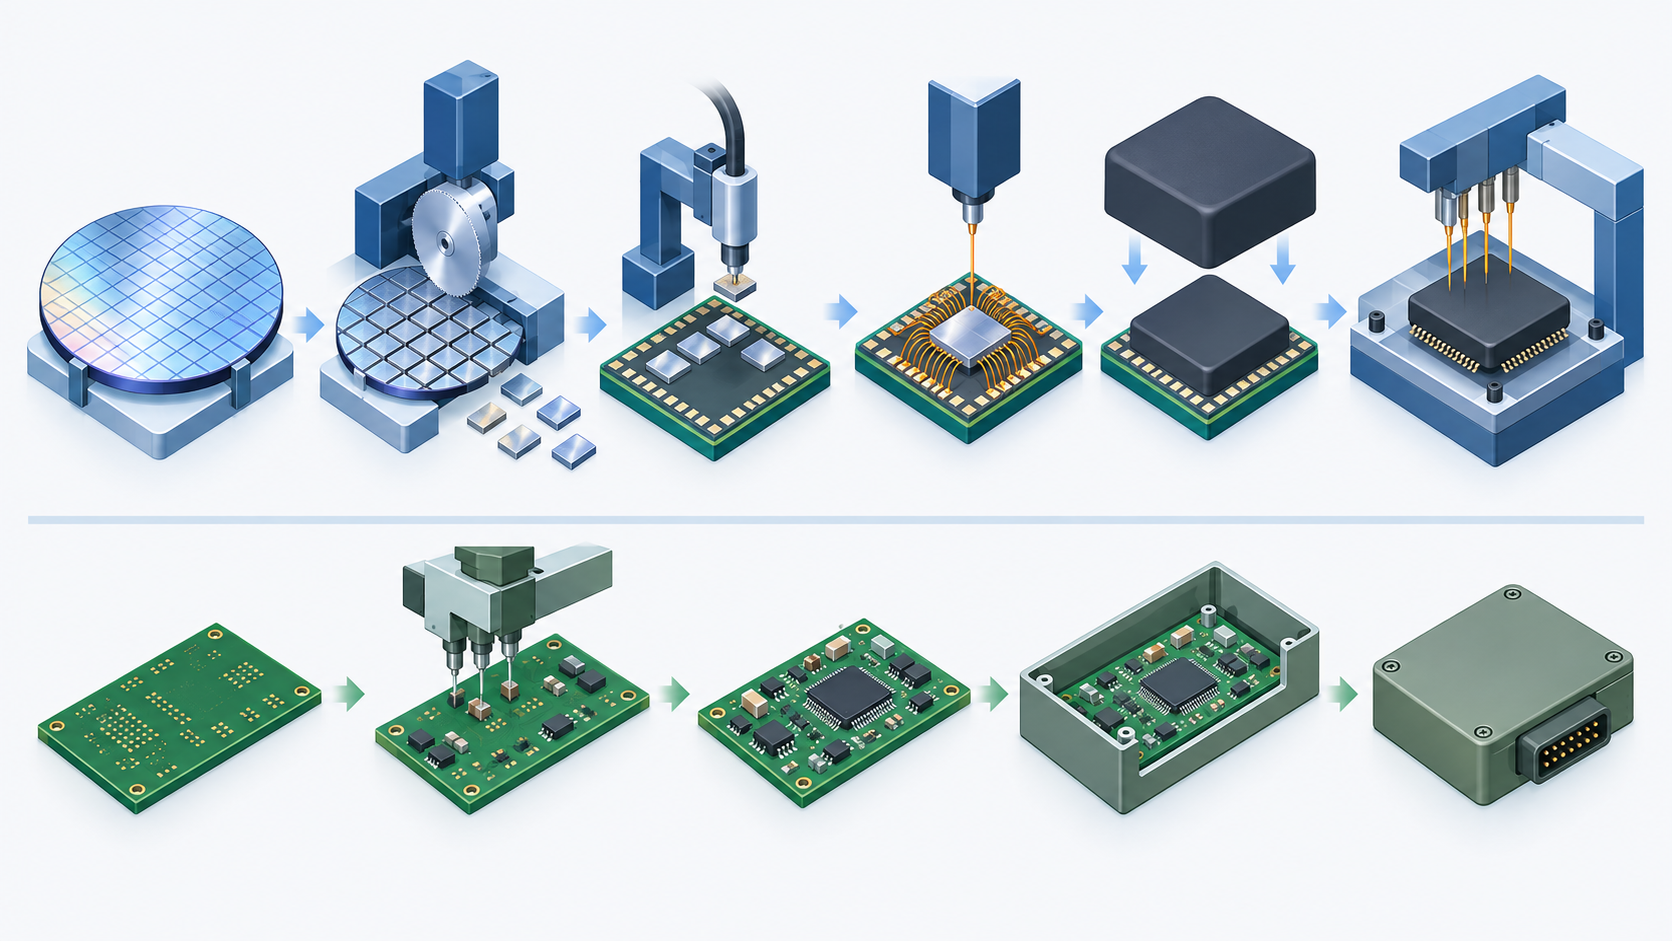
Making a semiconductor divides broadly into a first half and a second half.
| Stage | What happens | What is handled | Who does it |
|---|---|---|---|
| Front end (wafer fabrication) | Transistors and wiring are built onto a silicon disc | Wafers, discs 300mm across | Foundries (TSMC, UMC) and IDMs (Intel, Samsung) |
| Back end (assembly and test) | The wafer is diced, the die is mounted on a substrate, wired, sealed in resin and tested electrically | Individual dies and finished packages | OSATs (ASE, Amkor, SPIL) and the in-house plants of IDMs |
ASE takes on only the second half. It does not make wafers. It receives finished wafers from the customer, or from the foundry that built them on the customer's behalf, and handles everything downstream. That is what an OSAT is: Outsourced Semiconductor Assembly and Test, a firm that does contract back-end work and nothing else.
How this differs from TSMC
This is where readers most often get lost. TSMC does back-end work too, in the form of CoWoS and the rest, so why is an OSAT like ASE needed at all? Three things can be said with confidence from primary material.
- The two are partners to begin with. In its Form 20-F, ASE states that it "has maintained a strategic alliance with TSMC since 1997" and that TSMC has designated ASE as a non-exclusive preferred packaging and testing supplier for semiconductors TSMC manufactures Sourced. This is a division of labour between front end and back end rather than a rivalry.
- The range of parts is different. TSMC's back end concentrates on leading-edge AI packages such as CoWoS. ASE, by contrast, held 25,001 wire bonders and 7,456 testers as of 2025 and serves the whole field: communications, computing, consumer, industrial and automotive Sourced. That tens of thousands of wire bonders, the classic method of joining one metal wire at a time, are still its mainstay equipment is the decisive difference from a foundry's back end.
- By revenue the OSAT is the smaller of the two. ASE's back-end revenue, what it calls ATM, was NT$380.2bn. The envelope of TSMC's non-wafer revenue was NT$536.5bn, which is larger Our calculation. Even "the world's number one in the back end" does not reach TSMC's non-wafer revenue.
In a foundry's back end the package structure and its materials are designed together with the front end, so the choice of material is settled on the foundry's side. An OSAT is in a different position: it assembles substrate, mould compound, underfill and wire to suit each customer's specification. It is telling that ASE writes in its Form 20-F that part of its research spending goes into developing IC substrates, the principal raw material of a BGA package, and that it works closely with leading substrate suppliers in Japan, Taiwan, South Korea and China Sourced. ASE also makes substrates itself, at its ASE Electronics subsidiary in Kaohsiung, which means that for a materials maker it is a customer and a potential competitor at the same time.
4. Scale: five years of revenue
| Year | Revenue (NT$m) | Revenue (US$m) | Operating income (NT$m) | R&D expense (NT$m) | Purchases of property, plant and equipment (NT$m) |
|---|---|---|---|---|---|
| 2021 | 569,997 | 20,548 | 63,314 | 21,054 | 70,906 |
| 2022 | 670,873 | 21,831 | 81,190 | 24,370 | 72,640 |
| 2023 | 581,914 | 19,004 | 41,649 | 25,499 | 54,158 |
| 2024 | 595,410 | 18,158 | 40,339 | 28,830 | 79,522 |
| 2025 | 645,388 | 20,573 | 51,421 | 32,851 | 164,643 |
The last column is "purchases of property, plant and equipment" from the cash flow statement. The capital expenditure table in the Form 20-F, which is on an accrual basis, gives NT$48,759m for 2023, NT$96,208m for 2024 and NT$171,617m for 2025, the last of these shown alongside US$5,470.7m. The most important number in this table is that capital expenditure more than doubled in a single year.
What the 105,947 employees are doing
The breakdown by job type makes it plain that this is a labour-intensive manufacturer Sourced.
| Category | 2023 | 2024 | 2025 |
|---|---|---|---|
| Direct labour (production lines) | 45,826 | 46,829 | 52,173 |
| Indirect labour (manufacturing) | 29,933 | 27,596 | 30,874 |
| Indirect labour (sales and administration) | 8,010 | 8,352 | 8,642 |
| Indirect labour (research and development) | 12,125 | 12,715 | 14,258 |
| Total | 92,894 | 95,492 | 105,947 |
Direct labour is 49.2% of the total Our calculation. That is a completely different shape of workforce from TSMC, where roughly six in ten employees are managers or professionals. Back-end work runs through many process steps and the set-up changes with every part number, so a great deal of it still depends on people. Headcount then reached 114,179 by the end of June 2026, a gain of 8,232 in six months Sourced. That is the most direct evidence there is that the capacity build-out is happening now.
5. Company category and position in the back-end industry
The category is manufacturer. But two businesses of quite different character live inside the one company.
When ASE is introduced as "the world's largest OSAT", the figure being compared is ATM revenue of NT$380.2bn, or US$12.1bn, not the company-wide NT$645.4bn. Drop that distinction and every comparison with Amkor or SPIL later in this series goes wrong. In the second quarter of 2026, incidentally, ATM revenue jumped 36.3% year on year, and the quarterly mix shifted towards the back end at packaging 52%, test 13% and EMS 34% Sourced. The wave of AI demand has begun to reach the OSATs, a year or two behind TSMC.
6. Sites and the countries where it manufactures
ASE has manufacturing sites in 17 countries. Most of them, however, belong to the EMS side; the semiconductor back-end plants are concentrated in Taiwan, China, South Korea, Japan, Singapore, Malaysia, the Philippines and the United States Sourced.
| Country or region | Main back-end sites | Role | Employees (end 2025) |
|---|---|---|---|
| Taiwan | Kaohsiung (ASE Inc., ASE Test Taiwan, ASE Electronics), Zhongli, and Taichung, Changhua, Yunlin and Hsinchu (SPIL) | The core. Kaohsiung leads on flip chip, wafer bumping and fine-pitch wire bonding; SPIL, centred on Taichung, is the second pillar. Floor space is 10,795 thousand sq. ft. at Kaohsiung and 11,429 thousand sq. ft. at SPIL | 67,870 |
| China | Shanghai (ASE Shanghai), Suzhou (SPILSZ and Asteelflash), Wuxi, Kunshan, Huizhou | ASE Shanghai designs and produces packaging materials; SPILSZ does assembly and test. Some mainland sites were sold in 2021 | 19,020 |
| South Korea | Paju (ASE Korea), Cheonan (CHE, acquired August 2024) | Specialised in radio frequency, sensor and automotive devices | 3,053 |
| Malaysia and Singapore | Penang, Singapore | Assembly and test for IDMs, the semiconductor firms that both design and manufacture in house | 3,816 |
| Japan | Takahata, Yamagata Prefecture (ASE Japan) | Mobile handset, consumer and automotive work. Small, at 108 thousand sq. ft. of floor space | 481 |
| United States | California (ISE Labs) | Front-end engineering test and final test, deliberately sited close to the fabless design houses | 715 |
| Philippines and Vietnam | Cavite (acquired August 2024), Haiphong | Cavite does assembly and test; Haiphong does IC mounting for wearables | 3,123 |
Headcount comes from the country table in the Form 20-F. Malaysia 2,880 plus Singapore 936, and the Philippines 818 plus Vietnam 2,305, have each been combined Our calculation. The sites in Poland, France, Germany, Tunisia, the Czech Republic, Hungary, the United Kingdom, Belgium and Mexico, which are left out of the table, all belong to the EMS side.
The 67,870 employees in Taiwan are 64.1% of the total Our calculation. That is not TSMC's 86%, but it is still a concentration in Taiwan. Counting EMS as well, though, ASE manufactures in 17 countries, which is a far wider geographic net than TSMC casts.
7. Leading products and share in semiconductor back-end work
The product family: from wire bonding to 2.5D and 3D
ASE's back-end services run the whole way from the classic methods to the leading edge. These are the main ones the Form 20-F lists Sourced.
- Wire bonding
- The classic method: the pads on the die are joined to the lead frame one gold or copper wire at a time. ASE holds 25,001 wire bonders.
- Flip chip
- The die is turned over and joined straight to the substrate through solder bumps, which allows far more connections than wire.
- FOCoS
- Fan-out Chip-on-Substrate. Redistribution layers link the dies, which are then mounted on a high pin-count BGA substrate. Aimed at HPC and AI work that pairs an ASIC with HBM. Pin counts of 3,000 to 7,000.
- FOCoS-Bridge
- FOCoS with a tiny silicon bridge embedded in it to link chiplets. Pin counts of 3,000 to 14,000.
- 2.5D and 3D IC
- Several dies placed side by side on a silicon interposer (2.5D) or stacked on top of each other (3D). The same ground TSMC's CoWoS occupies.
- CPO
- Co-Packaged Optics, placing optical devices inside the same package. ASE states in its Form 20-F that it has the capability.
The mix by application: AI is starting to tell
On market share, plainly
ASE puts no figure for its world market share in its statutory filings. Numbers of the form "X per cent of the OSAT market" or "Y thousand advanced packages a month" are estimates from research firms or the press, not primary material, and this article does not use them Not yet confirmed. Nor is revenue broken out by method, between wire bonding, flip chip, FOCoS and the rest. Three things can be said from primary sources.
- Annual back-end (ATM) revenue is NT$380.2bn, or US$12.1bn. That is the figure to compare against other OSATs Our calculation
- The equipment count is published: 25,001 wire bonders and 7,456 testers, as of 31 January 2026 Sourced
- The application mix is published: communications 45.8%, computing 24.0%, consumer, industrial and automotive 30.2%, for 2025 Sourced
Where the customers are concentrated
| Measure | 2023 | 2024 | 2025 |
|---|---|---|---|
| Top five customers as a share of revenue, company-wide | 48.0% | 48.4% | 46.5% |
| Customers accounting for more than 10% | 1 | 1 | 1 |
| Top ten customers as a share of accounts receivable | not disclosed | 47% | 50% |
| Customers headquartered in the United States | 63.6% | 60.2% | 56.7% |
ASE does not name its customers. Set against TSMC's 78% for the top ten, ASE's customer base is considerably more scattered, which is what you would expect of an OSAT carrying a large volume of low-volume, high-mix work.
8. Current investment plans
(US$5.47bn)1.8 times the NT$96.2bn of 2024
(US$4.31bn)As of the end of 2025, of which NT$20.6bn had been paid
ASE gives no number for its 2026 capital expenditure. All the Form 20-F says is that 2026 capital expenditure will be funded from cash on hand, operating cash flow and existing credit lines, and that it will consist mainly of additional purchases of machinery and equipment to expand capacity Sourced. The 2026 investment figure is therefore treated here as undetermined Not yet confirmed.
Quarterly actuals are disclosed, however, and in the second quarter of 2026 alone capital expenditure was US$1,695m, of which US$840m went to packaging, US$804m to test and US$49m to EMS Sourced. If quarters continue at that level, the year will finish well above 2025.
On 3 August 2026 ASE announced the pricing of US$1bn of currency-linked zero coupon convertible bonds due 2031 Sourced. By the company's own account the proceeds go to repaying existing borrowings, by way of capital injections into subsidiaries, and to purchasing foreign-currency-denominated materials. They are not designated for capital expenditure as such, but the move does show the balance sheet being arranged around a period of sharply rising investment.
The NT$171.6bn of 2025 capital expenditure breaks down into NT$106.0bn of machinery, NT$65.0bn of buildings and NT$0.6bn of land Sourced. Against the prior year, when machinery was NT$60.3bn and buildings NT$32.0bn, the building line has doubled. Equipment alone can be squeezed into existing plants; putting up buildings means the cleanroom floor area itself is being enlarged. A new back-end building needs a controlled environment, not to front-end standards but controlled all the same, and demand for the substrates, resins and chemicals that go into it starts a little later than the tool deliveries. Seen from the materials side, the 2025 building spend reads as a leading indicator of materials demand in 2026 and 2027 Not yet confirmed.
9. Major corporate partners
| Kind | Counterparty | Substance | Primary source |
|---|---|---|---|
| Strategic alliance | TSMC | An alliance running since 1997. TSMC designates ASE as a non-exclusive preferred packaging and testing supplier for semiconductors TSMC manufactures. ASE lists this in its Form 20-F as one of its strengths | Stated in the Form 20-F Sourced |
| Wholly owned subsidiary | SPIL | Taken to 100% through the share exchange of 30 April 2018. The second pillar of the back-end business, covered in its own instalment of this series | Stated in the Form 20-F Sourced |
| Consolidated subsidiary | The USI group | The core of the EMS business. ASE holds 100% of USI Inc. and 71.6% of USI Shanghai, listed in Shanghai as 601231, as of 31 January 2026 | Stated in the Form 20-F Sourced |
| Equipment suppliers | Teradyne, Tokyo Electron, Advantest | Named by ASE as its principal sources of testers. Test is the most capital-intensive step in the back end | Stated in the Form 20-F Sourced |
| Materials collaboration | Leading substrate suppliers in Japan, Taiwan, South Korea and China | Described as collaboration to raise IC substrate capacity. No individual company is named | In the Form 20-F, but without names Not yet confirmed |
NVIDIA, AMD, Qualcomm and Broadcom are all spoken of as ASE customers, but no customer is named anywhere in ASE's statutory filings. What the Form 20-F gives is ratios: the top five customers at 46.5% of revenue, and one customer above 10%. That is the opposite of TSMC, which named five customers outright in its March 2025 release, and this article therefore identifies no customer by name Not yet confirmed.
10. Where the company is heading in this field
What is established
| Fact | What it implies for the back end |
|---|---|
| ATM revenue in the second quarter of 2026 was up 36.3% year on year | The AI wave has reached the OSATs. The company's own numbers say the stagnation of 2023 and 2024 is over |
| 2025 capital expenditure rose 1.8 times to NT$171.6bn, 96.2% of it for the back end | The company has swung its resources decisively to the back-end side |
| NT$135.2bn of committed capital expenditure is still unspent | High investment through 2026 is the likely outcome |
| Headcount grew by 8,232 in six months, to 114,179 at the end of June 2026 | People are being added as well as tools, which is what happens when the capacity is meant to run |
| The TSMC alliance has held since 1997 | Even as foundries bring back-end work in house, ASE has not been cut out of the supply chain |
| Computing rose from 18.1% to 24.0% of back-end revenue | The shift away from dependence on smartphones is under way |
Outlook
Not yet confirmed Read plainly, the facts above point towards ASE's presence in the back end strengthening for now. The reason is simple: as long as demand for AI accelerators keeps outrunning the supply of leading-edge packaging, whatever TSMC cannot handle itself flows to the OSATs. ASE has the vessels to catch it, in FOCoS, FOCoS-Bridge and 2.5D, and the alliance running since 1997 gives that hand-off an institutional footing.
Not yet confirmed It is hard to imagine ASE taking TSMC's place, though. An OSAT with no leading-edge logic wafers of its own cannot tune yield jointly with the front end. The reading most consistent with the primary material is that ASE's role is not "an alternative to TSMC" but "the catcher for what TSMC leaves behind, and for the generations TSMC no longer builds". Note too that the EMS business, four tenths of revenue, follows a cycle of its own that is not the semiconductor cycle, so company-wide results do not simply reflect back-end performance. Anyone using this company as a back-end indicator has to look at the ATM numbers.
11. The risks this company carries
| Risk | Substance | Supporting figures |
|---|---|---|
| Price competition | The company itself writes that many of its customers source from more than one supplier and that aggressive pricing by competitors may keep raising the level of competition. It also points to Chinese government support for domestic OSATs | Risk factors in the Form 20-F |
| Thin EMS margins | EMS is four tenths of revenue, but its gross margin in the second quarter of 2026 was 8.9%. ATM in the same quarter was 27.3%, three times as wide | Second-quarter 2026 earnings release |
| Recovering the capex | 2025 capital expenditure was 26.6% of revenue, and NT$135.2bn of commitments remain. If demand falls short, fixed costs bite | Capex divided by revenue equals 26.6% Our calculation |
| Cyclicality | Revenue fell 13.3% in 2023. Growth in 2024 was only 2.3%, and 2025 has still not restored the 2022 level | NT$670.9bn in 2022 against NT$581.9bn in 2023 Our calculation |
| Geopolitics | The company lists cross-strait tension among its risk factors. 64.1% of employees, and most of the floor space of its main plants, are in Taiwan | 67,870 in Taiwan out of 105,947 Our calculation |
| Litigation | Criminal insider dealing proceedings connected with the 2015 and 2016 tender offer for SPIL are still live. On 11 February 2026 the Kaohsiung District Court acquitted one officer, and prosecutors appealed on 2 March | Stated in the Form 20-F. The outcome is undetermined |
12. Glossary
- OSAT
- Outsourced Semiconductor Assembly and Test. A company that takes on semiconductor back-end work, meaning assembly and test, on contract and does nothing else. ASE, Amkor and SPIL are examples.
- ATM
- Assembly, Testing and Materials. ASE's own umbrella term for its back-end business, packaging plus test plus materials.
- EMS
- Electronics Manufacturing Services. Contract board assembly and equipment build. Different processes and different customers from the semiconductor back end.
- Wire bonding
- Joining the pads on a die to the external terminals with fine metal wire. The oldest method in the back end and still the leader by unit volume.
- IC substrate
- The small multilayer board that carries the die and routes it out to the external terminals. The principal raw material of a BGA package, and prone to shortage.
- Tester
- The equipment that checks the electrical characteristics of a finished package. The most capital-intensive item in the back end, and expensive per unit.
- ADS and ADR
- American Depositary Share and Receipt, instruments that let a foreign company's shares trade in the United States. ASE is listed on the NYSE with one ADS representing two ordinary shares.
- Form 20-F
- The annual report a foreign company listed in the United States files with the SEC. It is audited and carries legal liability for its contents.
 AI-generated concept
13. References
- ASE Technology Holding Form 20-F for the fiscal year ended December 31, 2025 (filed with the U.S. SEC on 1 April 2026). Legal name, head office address and listing venues, revenue by segment, headcount by job type and by country, the plant list and floor space, capital expenditure, R&D expense, customer concentration, revenue by application and by region, wire bonder and tester counts, the TSMC alliance, the holdings in SPIL and USI, risk factors and litigation. https://www.sec.gov/Archives/edgar/data/1122411/000119312526135585/d50802d20f.htm
- ASE Technology Holding Second quarter 2026 earnings release (Form 6-K, 30 July 2026). Second-quarter revenue, segment mix and gross margins, capital expenditure of US$1,695m, headcount of 114,179 and customer concentration. https://www.sec.gov/Archives/edgar/data/1122411/000095010326011351/dp250868_6k.htm
- ASE Technology Holding Announcement of the pricing of US$1bn of convertible bonds (Form 6-K, 3 August 2026). Currency-linked zero coupon convertible bonds due 2031 and the use of proceeds. https://www.sec.gov/Archives/edgar/data/1122411/000119312526330709/d77314d6k.htm
- U.S. SEC EDGAR XBRL company facts API (CIK 0001122411). Revenue, operating income, R&D expense and purchases of property, plant and equipment for 2021 to 2025, as tagged in each year's Form 20-F. https://data.sec.gov/api/xbrl/companyfacts/CIK0001122411.json
- TSMC Form 20-F for the fiscal year ended December 31, 2025 (filed with the U.S. SEC). The TSMC revenue figures used for the scale comparisons in sections 3 and 5. https://www.sec.gov/Archives/edgar/data/1046179/000162828026025362/tsm-20251231.htm
- ASE Technology Holding Official website, used to check the corporate profile and the brand mark. https://www.aseglobal.com
14. Claim-to-source audit
| Claim in the article | Category | Source |
|---|---|---|
| Legal name, head office address, listing venues (TWSE 3711 and NYSE ASX), holding company incorporated 30 April 2018 | Sourced | Reference 1 https://www.sec.gov/Archives/edgar/data/1122411/000119312526135585/d50802d20f.htm |
| Revenue, operating income, R&D expense and purchases of property, plant and equipment, 2021 to 2025 | Sourced | Reference 4 https://data.sec.gov/api/xbrl/companyfacts/CIK0001122411.json |
| 2025 revenue by segment (packaging 47.8%, test 11.1%, EMS 39.8%, other 1.2%) and ATM of NT$380.2bn | Our calculation | Percentages derived from revenue to external customers in note 41 of reference 1 https://www.sec.gov/Archives/edgar/data/1122411/000119312526135585/d50802d20f.htm |
| 105,947 employees at end 2025, the splits by job type and country, direct labour at 49.2%, Taiwan at 64.1% | Sourced plus our calculation | The employee tables of reference 1; the percentages are ours https://www.sec.gov/Archives/edgar/data/1122411/000119312526135585/d50802d20f.htm |
| 114,179 employees at end June 2026, second-quarter revenue up 26.7%, ATM up 36.3%, segment mix 52/13/34/1%, ATM gross margin 27.3% against EMS 8.9%, capital expenditure of US$1,695m | Sourced | Reference 2 https://www.sec.gov/Archives/edgar/data/1122411/000095010326011351/dp250868_6k.htm |
| Plant locations and floor space (Kaohsiung 10,795 thousand sq. ft., SPIL 11,429 thousand sq. ft. and the rest), manufacturing in 17 countries | Sourced | The plant list in reference 1, as of 31 January 2026 https://www.sec.gov/Archives/edgar/data/1122411/000119312526135585/d50802d20f.htm |
| 25,001 wire bonders and 7,456 testers as of 31 January 2026, and the three named tester suppliers | Sourced | Reference 1 https://www.sec.gov/Archives/edgar/data/1122411/000119312526135585/d50802d20f.htm |
| The TSMC alliance since 1997 and the non-exclusive preferred supplier designation | Sourced | Reference 1 https://www.sec.gov/Archives/edgar/data/1122411/000119312526135585/d50802d20f.htm |
| Application mix (communications 45.8%, computing 24.0%, consumer, industrial and automotive 30.2%), region (United States 56.7%) and top five customers at 46.5% | Sourced | Reference 1 https://www.sec.gov/Archives/edgar/data/1122411/000119312526135585/d50802d20f.htm |
| 2025 capital expenditure of NT$171.6bn (machinery NT$106.0bn, buildings NT$65.0bn, land NT$0.6bn), commitments of NT$135.2bn, back end at 96.2% | Sourced plus our calculation | The capital expenditure table and segment spending in reference 1; the 96.2% is ours https://www.sec.gov/Archives/edgar/data/1122411/000119312526135585/d50802d20f.htm |
| Pricing of US$1bn of convertible bonds due 2031 | Sourced | Reference 3 https://www.sec.gov/Archives/edgar/data/1122411/000119312526330709/d77314d6k.htm |
| 100% of SPIL, 100% of USI Inc. and 71.6% of USI Shanghai | Sourced | Reference 1, as of 31 January 2026 https://www.sec.gov/Archives/edgar/data/1122411/000119312526135585/d50802d20f.htm |
| ASE's ATM revenue of NT$380.2bn is smaller than TSMC's non-wafer envelope of NT$536.5bn | Our calculation | Derived by setting the figures in references 1 and 5 against each other https://www.sec.gov/Archives/edgar/data/1046179/000162828026025362/tsm-20251231.htm |
| Risk factors (price competition, Chinese government support, cross-strait relations) and the live SPIL tender offer litigation | Sourced | Reference 1 https://www.sec.gov/Archives/edgar/data/1122411/000119312526135585/d50802d20f.htm |
| ASE's world market share, advanced packaging capacity and revenue split by method | Not yet confirmed | No primary source exists, so this article states no figure https://www.sec.gov/Archives/edgar/data/1122411/000119312526135585/d50802d20f.htm |
| The 2026 capital expenditure plan | Not yet confirmed | Not disclosed. The Form 20-F gives only the funding method and the character of the spending https://www.sec.gov/Archives/edgar/data/1122411/000119312526135585/d50802d20f.htm |
| Customer names and the names of individual substrate suppliers | Not yet confirmed | Absent from ASE's own primary material, so this article identifies none of them https://www.sec.gov/Archives/edgar/data/1122411/000119312526135585/d50802d20f.htm |
| The outlook in section 10, and the reading of building investment as a leading indicator of materials demand | Not yet confirmed | An interpretation by this article, drawn from the six items in the facts table https://www.sec.gov/Archives/edgar/data/1122411/000119312526135585/d50802d20f.htm |
Last updated 21 September 2026 / Troy Technical
Every figure in this article comes from the statutory filings ASE Technology Holding has made with the U.S. Securities and Exchange Commission, or from the company's own announcements. No research-firm estimates or press-based figures have been used.