TECHNOLOGY EXPLAINER
Thermoelectric Materials
— what lies between the single number “ZT” and the efficiency of a real device
Thermoelectric materials are solids that turn a temperature difference into electricity (the Seebeck effect) and move heat when a current is passed through them (the Peltier effect). Their quality is usually summed up by the dimensionless figure of merit ZT, but ZT is a value that changes with temperature, and the efficiency of a finished device depends heavily on the temperature window it works in (hot side and cold side), on the resistance of the joints and on mechanical fragility. This article sets out, from primary sources, what ZT means; where Bi2Te3, PbTe, SnSe, Mg3(Sb,Bi)2, half-Heusler compounds, skutterudites, oxides and organics stand; the difference between peak ZT and average ZT; why measuring ZT is “a composite of four measurements”; and the realities of waste-heat recovery, solid-state cooling (Peltier) and wearables.
- What thermoelectric conversion is (the short version)
- How it works — the Seebeck effect, the Peltier effect and the ZT formula
- Why raising ZT is hard — three quantities that get in each other’s way
- A map of materials — Bi2Te3, PbTe, SnSe, Mg3(Sb,Bi)2, half-Heusler, skutterudites, oxides, organics
- Peak ZT versus average ZT, material versus device — our calculation
- Measuring ZT is “a composite of four measurements” — the round robin and the SnSe lesson
- What is hard about making a device — mechanical strength, joints, thermal expansion, resources
- Applications — waste-heat recovery, solid-state cooling (Peltier), wearables
- How to read the evaluation standards
- Limits, and what could not be confirmed
- Glossary / References / Claim-to-source audit
Sourced = stated in published material (link given)
Our calculation = a figure this article derived, with the assumptions spelled out
Not yet confirmed = a plan or schedule whose record has not been confirmed
Materials-design interpretations are marked separately as Commentary. Inference is shown in bold.
The ZT, efficiency and temperature-difference figures here are laboratory results reported for particular compositions, sample forms (single crystal, sintered bulk), temperatures and measurement methods. ZT changes with temperature, so a peak value alone does not fix the efficiency of a device. Figures for different sample forms or temperatures are not ranked against each other. Please do not read laboratory champion data as the performance of production parts or of equipment in service.
1. What thermoelectric conversion is (the short version)
- A temperature difference becomes a voltage, and a current moves heat: Seebeck observed that a voltage appears when two dissimilar conductors are joined in a closed circuit and the two junctions are held at different temperatures. NASA’s fact sheet presents this as the principle of the radioisotope thermoelectric generator (RTG)Sourced[Ref. 6]
- The quality of a material is ZT: ZT is a dimensionless index written ZT = S²σT/κ, using the Seebeck coefficient S, electrical conductivity σ and thermal conductivity κSourced[Ref. 3]. The larger the ZT, the higher the upper limit of conversion efficiency
- ZT is a number for a material; efficiency is a number for a device: the efficiency of a device is set by the temperature window, by S, σ and κ that vary with temperature, by the resistance of the joints and by heat losses. Chapter 5 uses a calculation to show how peak ZT and average ZT differOur calculation
“ZT of such-and-such” means something only when it states at which temperature, in which sample form and by which measurement method it was obtained. ZT is also a stack of four measurements (resistivity, Seebeck coefficient, thermal diffusivity and specific heat) plus density, so a single measurement going wrong moves the result. The efficiency of the module that AIST actually built was well below what the peak ZT of its material would simply suggest (Chapter 5).
2. How it works — the Seebeck effect, the Peltier effect and the ZT formula
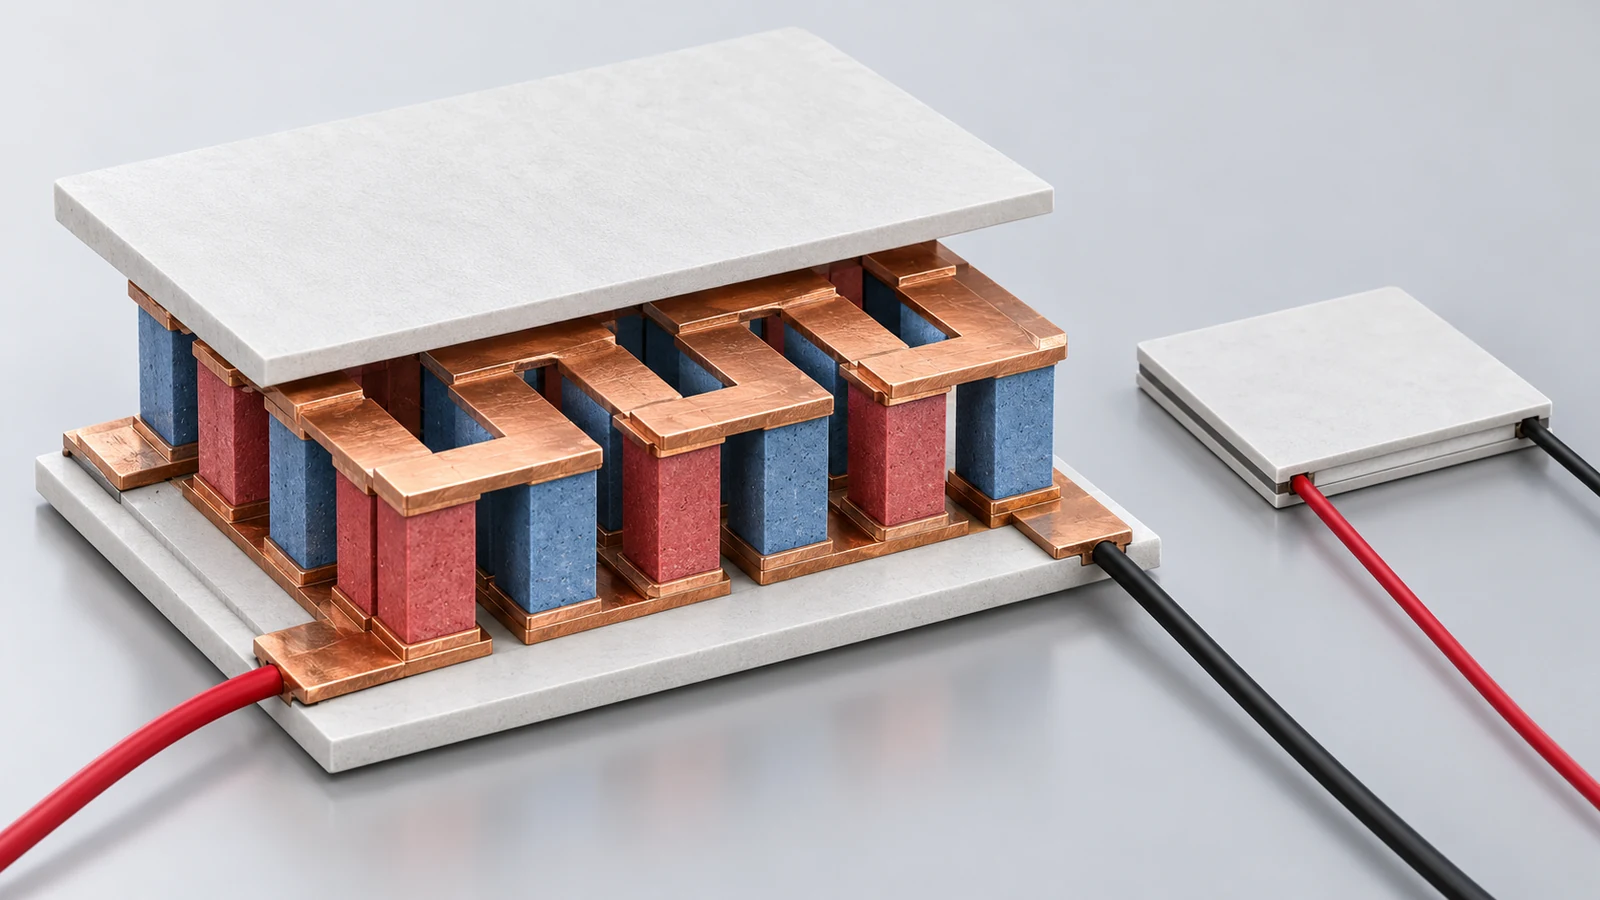
A thermoelectric module is built from legs of p-type and n-type semiconductor connected alternately in series by electrodes such as copper, and sandwiched between ceramic substrates above and below. When a temperature difference is applied between the two substrates, charge carriers in the legs (holes in p-type, electrons in n-type) diffuse from the hot side to the cold side and a voltage appears (power generation). Conversely, when a current is passed, the carriers carry heat, so one face cools and the other heats up (cooling by the Peltier effect). This is our own explanation; Seebeck’s observation and the RTG principle are described in the NASA fact sheet [Ref. 6], and applications in Bell’s review [Ref. 4].
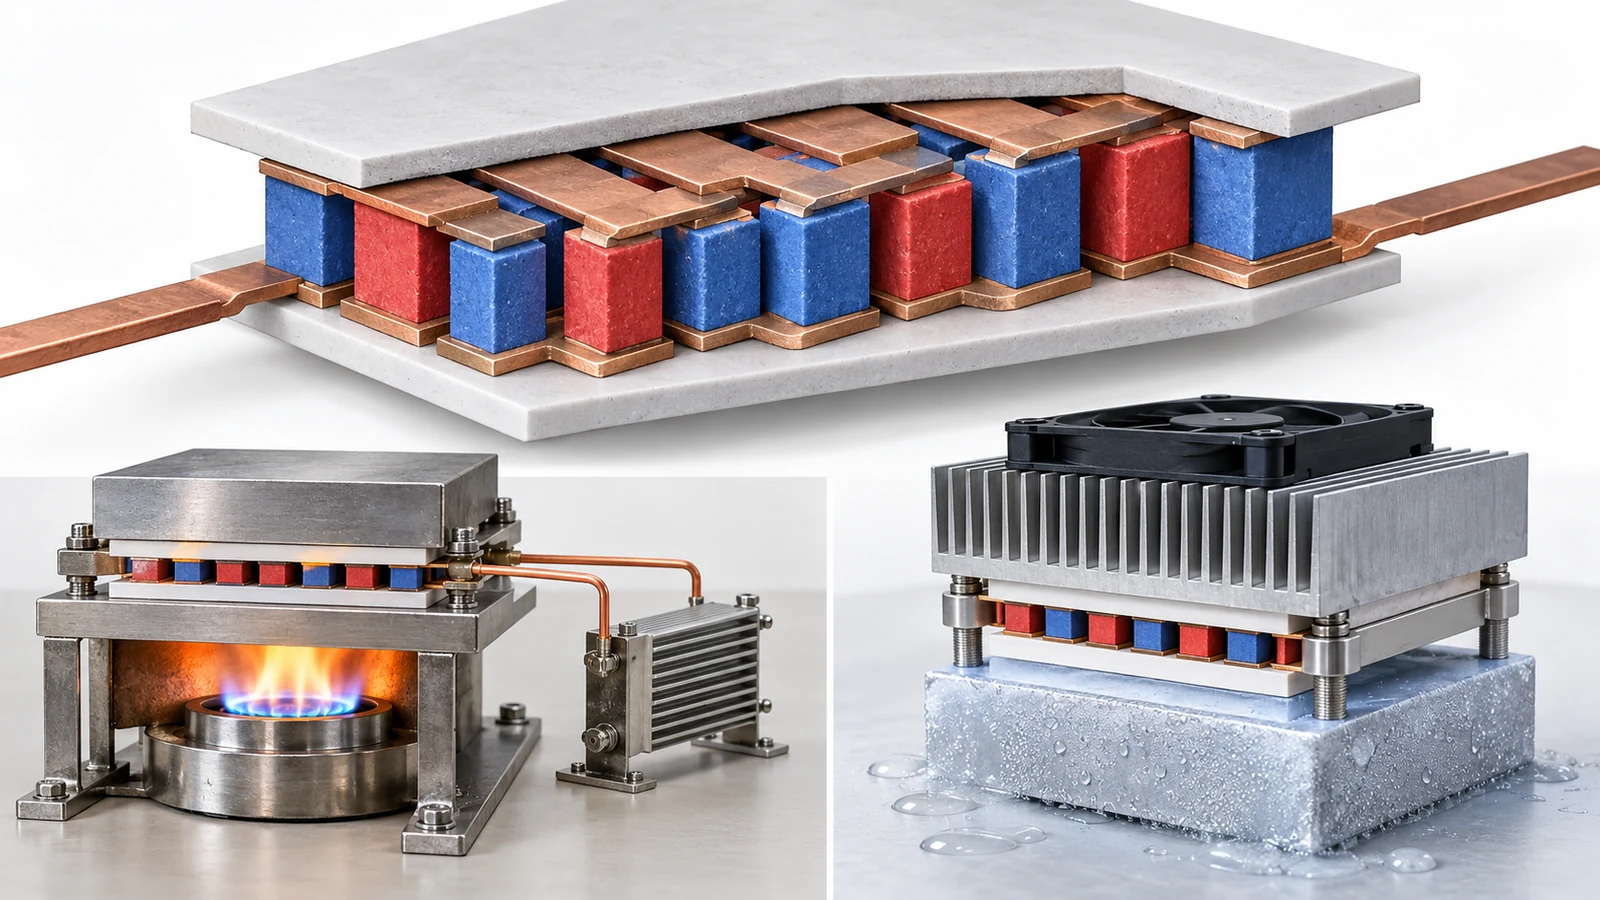
View the original SVG schematic and exact annotations
In Poon’s review, ZT is defined as ZT = (S²σ/κ)T, where κ is the sum of an electronic part κe and a lattice part κL, and κe = LσT (L is the Lorenz number). S²σ is called the power factorSourced[Ref. 3]. The numerator S²σ corresponds to “how much can be taken out as electricity”, and the denominator κ to “how much of the temperature difference leaks away as heat” (this article’s explanation).
| Symbol | Meaning | Example unit | Note when reading |
|---|---|---|---|
| S (Seebeck coefficient) | Voltage generated per 1 K of temperature difference | µV/K | Varies with temperature. The sign tells p-type from n-type (commentary) |
| σ (electrical conductivity) | How easily current flows (the inverse of resistivity) | S/m | Varies with direction (the crystal axis, for a single crystal) |
| κ (thermal conductivity) | How easily heat flows. κ = κe + κL | W/(m·K) | At high temperature it is often not measured directly but calculated from thermal diffusivity, specific heat and density (Chapter 6) |
| T | Absolute temperature | K | ZT is a value “at a given temperature”. Always state the temperature of the peak |
Definitions are from Poon’s review [Ref. 3]. Units and notes are this article’s commentary.
3. Why raising ZT is hard — three quantities that get in each other’s way
Snyder and Toberer’s review says that the conflicting combination of traits a thermoelectric material needs is what makes efficient materials hard to findSourced[Ref. 1]. Raising the carrier concentration of a semiconductor increases σ but lowers S, and the heat carried by electrons, κe, also rises in proportion to σ. The power factor has a maximum somewhere in between (this article’s explanation).
For this reason the main battlefield for raising ZT has been lowering the lattice thermal conductivity κL. Bubnova and co-authors note that what most recently discovered materials with ZT above 2 have in common is a low lattice thermal conductivitySourced[Ref. 12]. He and Tritt’s review lists defects, size effects, critical phenomena, anharmonicity and the spin degree of freedom as mechanisms that can push ZT up, and explains that they decouple physical quantities that had been adversely tied togetherSourced[Ref. 2]. As an example, Kim and co-authors report that dense arrays of dislocations at the grain boundaries of Bi0.5Sb1.5Te3 scatter mid-frequency phonons and lower the lattice thermal conductivitySourced[Ref. 9]. Zhao and co-authors attribute the extremely low thermal conductivity of SnSe to anharmonic bondingSourced[Ref. 5].
If the standard recipe for raising ZT is to introduce microstructure that scatters phonons (grain boundaries, dislocations, nano-precipitates, complex crystal structures), the resulting material tends toward being mechanically weak and prone to microstructural change at high temperature (this article’s commentary). Indeed, commercial zone-melted ingots of Bi2Te3 are reported to be mechanically weak and the n-type crack easily [Ref. 18]. When comparing ZT numbers, one has to look together at whether that microstructure survives device fabrication (cutting, joining) and the operating temperature.
Also, S²σ and κe in ZT come from the same carriers, so for some materials a design that assumes the electronic side and the thermal side can be improved “independently” does not hold. Poon’s review gives an example in which mobility and effective mass are related to each other [Ref. 3].
4. A map of materials — Bi2Te3, PbTe, SnSe, Mg3(Sb,Bi)2, half-Heusler, skutterudites, oxides, organics
Thermoelectric materials “live apart” by the temperature range in which they can be used. The next figure puts side by side the temperature range of use (bars) and the temperatures at which ZT was reported (dots), as far as primary sources confirm. The bars are guides and the dots are measurement points for particular samples, so the figure does not rank the materials on a common yardstick.
| Material | Reported value (conditions) | Position and caution |
|---|---|---|
| Bi2Te3 family | p-type Bi0.5Sb1.5Te3: zT 1.86 ± 0.15 at 320 K, a bulk made by liquid-phase compaction with dislocation arrays in the grain boundaries; a thermoelectric cooler made of it reached a maximum temperature difference of 81 K [9]. Commercial Bi2Te3-based alloys have a ZT close to 1 and are the best commercially available semiconductors below 200 °C [12] | The standard for near-room-temperature cooling and generation. Tellurium is a by-product of copper refining [19]. The value is the maximum temperature difference reported by the authors, measured under conditions that differ from those of commercial Peltier modules |
| Mg3Bi2 family (n-type) | Peak ZT about 0.9 at 350 K. A cooler made with p-type Bi0.5Sb1.5Te3 gave a temperature difference of about 91 K with the hot side at 350 K [8] | The authors state it is comparable to commercial Bi2Te3-xSex and cheaper because it uses far less tellurium. The device is a laboratory prototype |
| PbTe family | p-type PbTe sintered body with MgTe nanostructures: ZT 1.8 at 550 °C, about twice that of conventional PbTe (AIST) [14] | AIST states that this sintered body has high ZT at 300–700 °C and low ZT below 300 °C, and also built a two-stage module with Bi2Te3 on the cold side [14]. It contains lead and tellurium (AIST’s wording) |
| SnSe | Single crystal along the b axis: ZT 2.6 ± 0.3 at 923 K, lattice thermal conductivity 0.23 ± 0.03 W/(m·K) at 973 K. Along the a axis ZT is 0.8 ± 0.2 [5] | Strongly anisotropic. The sample density has been pointed out as 88–90% of the theoretical value, and there is a dispute over whether κ is intrinsic (Chapter 6) [7]. A polycrystal with ZT about 3.1 at 783 K has also been reported, but this is the authors’ report [10] |
| Half-Heusler | A mid-temperature (400–800 °C) material whose ZT rose from about 1 to 1.5. N-p modules reported with efficiency near 10% and power density near 9 W/cm² [3] | The review points out that measured efficiencies fall well below ideal values and that testing has centred on single-leg (unileg) devices. Fracture toughness is about 2 MPa·m1/2 [3] |
| Skutterudite | CoSb3 filled with three species, Ba, La and Yb: ZT 1.7 at 850 K, sintered bulk [11] | An example of the design idea of scattering a broad range of phonon frequencies with filler atoms of different vibration frequencies in the “cages”. This is a value reported by the authors |
| Oxides | NaCo2O4 single crystal: in-plane thermopower about 100 µV/K at 300 K, in-plane resistivity 200 µΩ·cm at 300 K [13] | A 1997 measurement showing that a metallic oxide could be a thermoelectric material. It is not ZT itself. A review of oxide thermoelectrics is by He and co-authors [20] |
| Organic (conducting polymer) | PEDOT:Tos: ZT = 0.25 at room temperature, thermal conductivity 0.37 W/(m·K) [12] | Aims at the advantage of coating large areas from solution. ZT does not reach that of inorganic materials, but the thermal conductivity is low |
All Sourced (the reports in each reference). Because sample form, temperature and measurement method differ from row to row, the rows are not ranked against each other.
In the table, Bi2Te3-based p-type is (Bi,Sb)2Te3 with Sb in solid solution, and n-type is Bi2(Te,Se)3 with Se in solid solution, so p-type and n-type are different compositions (Mao and co-authors’ text also lists Bi2Te3-xSex and Bi0.5Sb1.5Te3 side by side [Ref. 8]). A device needs both p-type and n-type, so a material with a high ZT in only one polarity does not raise device efficiency. The Mg3Bi2 report is likewise “a new n-type material”, and the p-type partner is the conventional Bi0.5Sb1.5Te3 [Ref. 8]. Poon’s review says, in the half-Heusler section, that the thermal expansion of the p and n legs must match — the same situation [Ref. 3].
5. Peak ZT versus average ZT, material versus device — our calculation
Poon’s review gives the ideal maximum conversion efficiency of a device (TEG) as the Carnot efficiency combined with the temperature-averaged ZT: η = ((Th − Tc)/Th) × (√(1 + ZT̄) − 1)/(√(1 + ZT̄) + Tc/Th). Here Th is the hot-side and Tc the cold-side temperature, and ZT̄ is ZT averaged over the operating temperature range. The same review adds that the actual efficiency is determined by the temperature-dependent S, σ and κ, not by the average ZT aloneSourced[Ref. 3]. Using this formula, let us calculate how much efficiency changes with the temperature window for the same ZT̄.
We put two temperature windows into the formula aboveOur calculation.
- Window A (assumed waste-heat recovery): Th = 800 K, Tc = 300 K. The Carnot efficiency is 1 − 300/800 = 62.5%
- Window B (assumed warm water): Th = 373 K (100 °C), Tc = 300 K. The Carnot efficiency is 1 − 300/373 = about 19.6%
- For ZT̄ = 0.5, 1, 1.5 and 2, η in window A is 8.8%, 14.5%, 18.6% and 21.7%. In window B it is 2.2%, 3.7%, 4.8% and 5.6%
- So even with ZT̄ = 1, a window of 800/300 K gives about 14.5% and 373/300 K about 3.7% — roughly a factor of four
Assumptions and limits: this is the ideal formula, with equal ZT̄ for both legs and no contact resistance or heat loss. Real efficiency is set by S, σ and κ at each temperature, so the values from this formula are a guide [Ref. 3]. A device-ZT calculation page published by Snyder and co-workers gives an example in which the same material data give a device ZT of 0.96 for a 300–800 K window and 0.72 for a 300–600 K window [Ref. 17].
Next, let us apply the same formula to the PbTe module that AIST actually built. The peak ZT of the p-type leg material is 1.8 (550 °C). A one-stage module (8 pairs) gave a maximum conversion efficiency of 8.8% and a maximum output of 3.55 W with the hot side at 600 °C and the cold side at 30 °C; a two-stage module with Bi2Te3 on the cold side gave 11% and 2.34 W with the hot side at 600 °C and the cold side at 10 °C. AIST attributes the gap from the finite-element simulation values (12.2% and 15.6%) to the large electrical resistance at the PbTe/electrode interface and to heat losses, such as radiation, that do not contribute to generationSourced[Ref. 14].
Solving the ideal formula in reverse gives the average ZT needed to produce the measured efficiencyOur calculation. With Th = 873.15 K and Tc = 303.15 K, the Carnot efficiency is about 65.3% and the measured 8.8% is about 13.5% of it. Solving for ZT̄ gives about 0.46; for the simulated 12.2% it gives about 0.72.
Assumptions and limits: this back-calculation uses the ideal formula with equal ZT̄ for n and p and lumps the temperature dependence of the material and the heat losses into a single number. It does not mean that “although the material’s ZT is 1.8, this module does only the work of ZT̄ of about 0.5”; it is a guide to show that reading device efficiency from a material’s peak value can go far wrong. For reference, NASA’s MMRTG (768 PbTe/TAGS thermocouples) produces about 110 W at launch with a system efficiency of about 6%, and an estimated 72 W at the end of its 17-year design life [Ref. 6]. Poon’s review puts the efficiency of commercial TEGs at about 5–8% [Ref. 3]. These were obtained under different conditions and should not be compared to rank anything.
6. Measuring ZT is “a composite of four measurements” — the round robin and the SnSe lesson
To obtain ZT one needs four measurements — electrical resistivity, Seebeck coefficient, thermal diffusivity and specific heat — plus the density. Because thermal conductivity cannot be measured directly at high temperature, it is calculated as κ = D·Cp·ρ (D is thermal diffusivity, Cp specific heat and ρ density) [Ref. 7].
Under the International Energy Agency’s implementing agreement on Advanced Materials for Transportation, an international collaboration led by Oak Ridge National Laboratory (ORNL) ran two round robins of the four measurements on bulk Bi2Te3-family material (nine laboratories in six countries took part in the first and nine in four countries in the second; results from seven laboratories are shown in each). The samples were n-type Bi2Te2.7Se0.3 and p-type Bi0.5Sb1.5Te3 from Marlow Industries (average grain size about 20 µm), chosen for uniformity, and measured up to 225 °C, each laboratory using its own best practice. The first round used both n-type and p-type; the second used the same p-type samples [Ref. 15].
| Quantity | Round 1 (n- and p-type) | Round 2 (p-type) | Causes and cautions named in the report |
|---|---|---|---|
| Seebeck coefficient | Scatter about ±5.5% (about ±4% among laboratories using ULVAC ZEM systems) | About ±4% over the whole temperature range | Differences in contact position (where temperature and voltage are measured). End-contact methods read slightly low and four-probe systems slightly high. Probe calibration is also a source of error |
| Electrical resistivity | Up to about ±12.5% (n-type, near 100 °C) | About ±5% near room temperature, about ±9% at 200 °C | The main cause is uncertainty in dimensions (probe spacing). A probe about 0.5 mm in size with a 5 mm spacing can give about 10% error |
| Thermal diffusivity (flash method) | About ±2–3% at room temperature, up to about ±6% at high temperature | About ±4% at room temperature, up to about ±10% at 200 °C | The report says the accuracy of commercial laser-flash systems is usually ±6–8%. The analysis method (Clark and Taylor, Cowan and others) differed between laboratories |
| Specific heat (DSC) | Two of six laboratories were 40–50% or more off the expected value; without them, about ±4% | More than ±15% overall; half the laboratories were within 4–5% of the Dulong-Petit limit | Three runs (empty pan, standard, sample) are needed and baseline shift is the main cause. The report advises checking against a standard (such as NIST molybdenum) and matching the mass and shape of the reference to the sample |
All Sourced (the body of ORNL’s Annex VIII report [Ref. 15]). The report concludes that the Seebeck coefficient can be measured consistently, that resistivity scatters by ±4–9% and diffusivity by ±5–10%, and that the worst problem is the DSC specific heat. It also measured sample-to-sample variation (12 each of n- and p-type: standard deviation of thermal diffusivity 1.54% for p-type and 2.75% for n-type; of resistivity 1.50% for p-type and 5.81% for n-type). The purpose of the round robin was not to rank laboratories but to identify problems, and laboratory identities were deliberately mixed.
Since ZT = S²T/(ρκ) (ρ is resistivity and κ = diffusivity × specific heat × density), an error in S counts twiceOur calculation. We use the near-room-temperature values of the second round robin (p-type). S is ±4% (8% in ZT because it counts twice), resistivity ±5%, thermal diffusivity ±4%. For specific heat the result depends on whether one takes ±4–5% (the half of laboratories close to the Dulong-Petit limit) or the overall more than ±15%. As a root-sum-of-squares of independent errors, the uncertainty is √(8² + 5² + 4² + 4.5²) = about 11% for specific heat at ±4.5%, and √(8² + 5² + 4² + 15²) = about 18% for ±15%. If everything piles up in the same direction, the figures are about 21.5% and 32%.
Assumptions and limits: the error in density is not included, and at higher temperature the scatter in thermal diffusivity and resistivity grows further (up to ±10% and ±9% at 200 °C). These are results for identical Bi2Te3-family samples and do not apply directly to other materials. The point is that an argument over the second decimal place of ZT can fall inside the measurement uncertainty.
The SnSe example — the ρ in κ = D·Cp·ρ was questioned
Zhao and co-authors reported an extremely high ZT of 2.6 ± 0.3 at 923 K along the b axis of SnSe single crystals [Ref. 5]. In a Brief Communication Arising in Nature, Wei and co-authors took the thermal diffusivity, specific heat and thermal conductivity that Zhao and co-authors had presented and back-calculated the density from κ = D·Cp·ρ, obtaining about 5.43 g/cm³, which is only 88–90% of the theoretical density in the literature (about 6.07–6.18 g/cm³). By definition a single crystal should be close to its theoretical density, so they argued that the samples cannot be called fully dense single crystals and the reported κ is not intrinsic. Wei and co-authors state that they are not raising concerns about the measurement technique itself. According to the same comment, the Reply by Zhao and co-authors confirmed that the measured density was lower than the theoretical densitySourced[Ref. 7].
Later, Zhou and co-authors reported in Nature Materials that hole-doped polycrystalline SnSe made from purified reagents with tin oxides removed showed a ZT of about 3.1 at 783 K and a lattice thermal conductivity of about 0.07 W/(m·K) at 783 K. The authors’ explanation is that the poorer performance of earlier polycrystals was due to tin oxide on the powder surfaceSourced[Ref. 10]. This is the authors’ report, and this article has not confirmed independent reproduction.
(1) At what temperature? (the peak, or the average over the operating range). (2) What sample form? (single crystal, sintered bulk, thin film; and in which direction). (3) What percentage of theoretical density? (because κ is the product D·Cp·ρ, density moves κ directly). (4) Has the measurement been confirmed on several instruments or in several laboratories? In a sintered body made by powder metallurgy, pores and oxide films affect both κ and σ. The SnSe episode shows how a discussion of material properties leads straight into a discussion of how the sample was made and how dense it is (this article’s commentary).
7. What is hard about making a device — mechanical strength, joints, thermal expansion, resources
Even when a material has a high ZT, to use it in a device it must be cut into legs a few millimetres square, joined to electrodes and made to withstand thermal cycling. The following challenges can be read from primary sources.
| Challenge | What the primary sources confirm | Note when reading |
|---|---|---|
| Mechanical strength (Bi2Te3) | Commercial zone-melted (ZM) Bi2Te3 is mechanically weak, and the n-type is especially prone to cracking. The hardness of ZM is about 0.35 GPa. The authors’ group found that devices with a high aspect ratio were easily damaged and that fabrication produces a lot of waste. An n-type Bi2Te2.7Se0.3 with 0.7 wt.% nano-TiN dispersed reached a hardness of 0.98 GPa, a bending strength of 36.3 MPa and a compressive strength of 74 MPa (181%, 60% and 67% higher than ZM), with a peak ZT of 0.957 at 375 K and an average ZT of 0.89 over 325–450 K, equal in thermoelectric performance to ZM [18] | The paper attributes the weakness to the layered crystal structure (van der Waals bonding between Te(1)–Te(1) layers). The values are for one sample in one paper and are not ranked against other compositions or processes |
| Mechanical strength and thermal expansion (half-Heusler) | Devices must withstand repeated mechanical and thermal stress. The fracture toughness of refractory half-Heuslers is about 2 MPa·m1/2 and Poisson’s ratio about 0.2, indicating higher damage tolerance than ceramics. The linear thermal expansion coefficients of the p and n legs must match [3] | Statements in a review (citing Rogl and co-authors). They vary with composition and processing |
| Joints and interface resistance | In AIST’s modules the electrical resistance at the interface between the PbTe sintered body and the electrode (an electrode material made of iron and cobalt) was large, and the measured values fell below the simulation. Improving long-term durability and mechanical properties was named as future work [14] | AIST says it aims at industry trials toward practical use within five years (Not yet confirmed) |
| Material constraints (lead, tellurium) | AIST names substitution of lead (toxic) with copper and tellurium (rare) with sulfur as future work [14]. According to USGS (February 2026), tellurium is a by-product of electrolytic copper refining; the estimated 2025 world consumption by use was solar cells 70%, thermoelectric devices 15%, metallurgy 10% and other 5%. China accounted for an estimated 80% of refined tellurium, and from February 2025 Chinese exporters were required to submit documents verifying end use [19] | Supply follows copper production. No outlook on prices or supply is given |
All Sourced (sources in each cell). The USGS figures are estimates from the February 2026 edition.
In a device, the semiconductor legs are stacked with diffusion-blocking layers, bonding layers, electrodes and ceramic substrates. In AIST’s example, it was the electrical resistance of the interface, not the ZT of the material, that was named as the main cause of the gap between measurement and ideal [Ref. 14]. Thermoelectric legs operate across a temperature difference, and because the hot and cold ends expand by different amounts, every thermal cycle puts stress on the joints (this article’s commentary). That is why Poon’s review lists the matching of thermal expansion between p and n legs, and endurance against repeated stress, as challenges alongside materials development [Ref. 3]. As an inference, whether a paper on a new high-ZT material is accompanied by long-term device tests (number of thermal cycles and the change in output) is a guide to its practicality. This article, however, has no primary source that confirms this.
8. Applications — waste-heat recovery, solid-state cooling (Peltier), wearables
Waste-heat recovery and space power
AIST states that more than 60% of Japan’s primary energy is discarded as unused waste heat, and places thermoelectric generation as the key to using it [Ref. 14]. As a practical example on the generation side, NASA describes the MMRTG as a radioisotope thermoelectric generator “with no moving parts” and says it produces about 110 W at launch [Ref. 6]. Bell summarises thermoelectric materials as solid-state energy converters that turn waste heat into electricity and electricity into cooling or heating, and says that in small-scale uses such as automobile seats, night-vision systems and cooling of electrical enclosures they can compete with fluid-based systems [Ref. 4].
Solid-state cooling (Peltier)
In cooling, not only a high ZT but the maximum temperature difference is a practical measure. The (Bi,Sb)2Te3 cooler of Kim and co-authors reached a maximum temperature difference of 81 K, and the device of Mao and co-authors, with n-type Mg3Bi2 and p-type Bi0.5Sb1.5Te3, about 91 K with the hot side at 350 K [Refs. 8, 9]. Both are laboratory prototypes, and their measurement conditions differ from those behind the specifications of commercial modules (such as ΔTmax in a datasheet).
Wearables
The Science Advances paper by Hong and co-authors shows a flexible device that combines double elastomer layers with high-ZT rigid thermoelectric pillars, and the authors report a cooling effect of more than 10 °C and a COP above 1.5 [Ref. 21]. It is an example that flexibility can also be obtained by arranging inorganic legs in a soft matrix, rather than relying on organic thermoelectric materials (Chapter 4), whose ZT is lower (this article’s commentary). The method for measuring the power generated by flexible thermoelectric devices is specified in IEC 62830-5:2021 [Ref. 23].
9. How to read the evaluation standards
The performance of a thermoelectric material is evaluated by building ZT from measurements of electrical resistivity, Seebeck coefficient, thermal diffusivity and specific heat (and density), and for a device by also measuring generated power or the cooling temperature difference. Common methods at the material level are the flash method (thermal diffusivity), DSC (specific heat) and four-probe methods (resistivity). Among international standards, the IEC 62830 series of TC 47 (semiconductor devices for energy harvesting and generation) has parts that deal with thermoelectrics, and in Japan JIS R 1650 specifies measurement methods for fine-ceramic thermoelectric materials. Measurement of thermal diffusivity rests on flash-method standards written for materials in general.
| Item evaluated | ISO | IEC / IEEE | JIS | ASTM | What changes the value with test conditions |
|---|---|---|---|---|---|
| Seebeck coefficient (thermopower) | Could not be confirmed | IEC 62830-2:2017 (thermo-power based thermoelectric energy harvesting: test methods and characteristic parameters for the thermoelectric properties of wire, bulk and thin films thinner than 5 mm) [22] | JIS R 1650-1, measurement methods for fine-ceramic thermoelectric materials, Part 1: thermopower (enacted 2002, confirmed June 2026) [24] | Could not be confirmed | Mean temperature, size of the temperature difference, atmosphere, sample direction (commentary) |
| Electrical resistivity | Could not be confirmed | IEC 62830-2:2017 (as above) [22] | JIS R 1650-2, Part 2: resistivity (enacted 2002, confirmed June 2026) [25] | Could not be confirmed | Temperature, direction and size of the measuring current, electrode contact, sample direction (commentary) |
| Thermal diffusivity (flash method) | ISO 18755:2022, fine ceramics, determination of thermal diffusivity of monolithic ceramics by flash method (homogeneous ceramics with porosity below 10%) [28]. ISO 22007-4:2024, plastics, Part 4: light flash method (plastics and composites) [29] | Could not be confirmed | JIS R 1611, measurement methods of thermal diffusivity, specific heat capacity and thermal conductivity of fine ceramics by flash method (enacted 1991, revised 2010, confirmed October 2025) [27]. JIS R 1650-3, Part 3: thermal diffusivity, specific heat capacity and thermal conductivity (enacted 2002) [26] | ASTM E1461 (thermal diffusivity by the flash method): listed by an instrument maker as a standard it complies with, alongside ISO 22007-4 and ISO 18755 [30] | Sample thickness, homogeneity and porosity, surface coating, temperature, atmosphere, treatment of the pulse |
| Specific heat capacity (DSC) | ISO 11357-4:2021, plastics, differential scanning calorimetry (DSC), Part 4: determination of specific heat capacity (plastics) [32] | Could not be confirmed | JIS R 1650-3 and JIS R 1611 (above) | ASTM E1269 (specific heat by DSC): an instrument maker lists it alongside ISO 11357-4 [31] | Running the empty pan, a reference material such as sapphire and the sample under identical conditions, and the baseline [31] |
| Device or module power generation | Could not be confirmed | IEC 62830-5:2021, test method for measuring generated power from flexible thermoelectric devices under bending [23] | Could not be confirmed | Could not be confirmed | Temperature, temperature difference, contact conditions, insulation, bending radius (as stated for IEC 62830-5). An international standard for rigid generator modules or Peltier modules could not be confirmed |
Numbers, titles and editions of standards were confirmed on the official pages of each body (ISO, IEC Webstore, JISC) Sourced. For ASTM, only the number and the quantity measured are given, and only where confirmed from non-ASTM public material (instrument makers’ pages). The arrangement of this table is Our calculation (this article’s rearrangement).
Notes on reading standards
- A standard is a “test method”, not a guarantee of material performance. JIS R 1650 is a national standard, enacted in 2002 and confirmed in June 2026. On the JISC pages, no corresponding ISO or IEC standard could be confirmed. IEC 62830-2 and -5 are written for thin films and flexible devices, and the same document does not cover measurement of bulk materials comprehensively
- Flash-method standards are divided by “which material they are written for”. ISO 18755 is for ceramics (porosity below 10%), ISO 22007-4 for plastics and composites, and JIS H 7801 for the laser flash method on metals (title confirmed on JISC). For a thermoelectric material one picks the standard closest to that material and aligns sample thickness and surface treatment
- Read a manufacturer’s value together with the standard, edition and test conditions. An instrument maker’s “complies with” statement describes the instrument’s capability, and does not make the ZT obtained a value guaranteed by the standard. Since ZT is a composite of four measurements, one has to align which standards and instruments were used for all four (Chapter 6)
10. Limits, and what could not be confirmed
(1) Standard texts
The texts of IEC 62830-2 and -5, ISO 18755 and 22007-4, and JIS R 1650 and R 1611 were not checked. Test conditions, procedures and acceptance criteria are not stated. ASTM standards are given only by number and quantity measured, and the ASTM website was not opened. Among ASTM standards, none covering the Seebeck coefficient or device evaluation could be confirmed.
(2) Performance of real equipment and production parts
The figures in Chapters 4 and 5 are results for particular laboratory samples and prototype modules, not specifications of production Peltier or thermoelectric generator modules. Datasheets of commercial modules are not covered.
(3) Details of the round robin
The round-robin figures come from the body of ORNL’s Annex VIII report. The full texts of the journal versions of the same collaboration (Parts I and II, Journal of Electronic Materials) were not checked, and it was not verified that they agree with the report’s figures. The contents of the report’s procedure document (Appendix A) are not described.
(4) The current state of the SnSe dispute
Independent reproduction of Zhou and co-authors’ polycrystalline SnSe (ZT about 3.1), and whether it has since been corrected or retracted, could not be confirmed within the scope of this survey (as of 10 October 2026, no retraction notice was found on the journal’s page).
(5) Long-term reliability of devices, and regulation such as RoHS
Results of thermal-cycling tests, device lifetimes, and the applicability of regulations such as RoHS to lead-containing PbTe devices could not be confirmed in primary sources and are not stated.
- ZT is a number for a material; efficiency is a number for a device. Even with the same average ZT, the ideal efficiency differs about fourfold with the temperature windowOur calculation
- ZT changes with temperature. Read peak values and averages over the operating range, and the material alone versus the device, as separate thingsSourced
- Measured modules fall below the ideal. AIST’s PbTe modules reached 8.8% (one-stage) and 11% (two-stage) against a material peak ZT of 1.8, and the gap was attributed mainly to interface resistance and heat lossSourced
- ZT is a composite of four measurements, and their uncertainties add up. For SnSe, the remark that density is only 88–90% of the theoretical value became the centre of the argument over κSourced
- Device challenges are mechanical strength and joints. Zone-melted Bi2Te3 cracks easily, and half-Heusler p and n legs need matching thermal expansionSourced
11. Glossary
- Seebeck effect
- A temperature difference produces a voltage. The Seebeck coefficient S is the voltage per 1 K.
- Peltier effect
- Passing a current moves heat, with heat absorption and release at the junctions.
- ZT
- The thermoelectric figure of merit, ZT = S²σT/κ, a dimensionless index that varies with temperature.
- Power factor
- S²σ. How readily electrical power can be taken out.
- Lattice thermal conductivity κL
- Heat carried by phonons (lattice vibrations). κ = κe + κL.
- Phonon scattering
- Obstructing lattice vibrations with grain boundaries, dislocations or nano-precipitates to lower κL.
- Leg
- A small prism of p-type or n-type semiconductor that makes up a thermoelectric device.
- Half-Heusler
- One family of mid-temperature (400–800 °C) thermoelectric materials.
- RTG
- Radioisotope thermoelectric generator. Converts the decay heat of a radioisotope to electricity with thermocouples.
- COP
- Coefficient of performance. In cooling, the heat removed divided by the electrical power supplied.
- Round robin
- A test in which several laboratories measure the same sample to compare reproducibility.
- Carnot efficiency
- The theoretical upper limit of heat-engine efficiency set by the hot-side and cold-side temperatures.
12. References
- Snyder G. J., Toberer E. S. “Complex thermoelectric materials”, Nat. Mater. 7, 105–114 (2008), DOI 10.1038/nmat2090 — doi.org/10.1038/nmat2090
- He J., Tritt T. M. “Advances in thermoelectric materials research: Looking back and moving forward”, Science 357, eaak9997 (2017), DOI 10.1126/science.aak9997 — doi.org/10.1126/science.aak9997
- Poon S. J. “Half Heusler compounds: promising materials for mid-to-high temperature thermoelectric conversion”, J. Phys. D: Appl. Phys. 52, 493001 (2019), DOI 10.1088/1361-6463/ab3d71 (arXiv version checked) — doi.org/10.1088/1361-6463/ab3d71
- Bell L. E. “Cooling, heating, generating power, and recovering waste heat with thermoelectric systems”, Science 321, 1457–1461 (2008), DOI 10.1126/science.1158899 — doi.org/10.1126/science.1158899
- Zhao L.-D. et al. “Ultralow thermal conductivity and high thermoelectric figure of merit in SnSe crystals”, Nature 508, 373–377 (2014), DOI 10.1038/nature13184 — doi.org/10.1038/nature13184
- NASA “Multi-Mission Radioisotope Thermoelectric Generator (MMRTG)”, NASA Facts (NF-2020-05-619-HQ) — nasa.gov/sites/default/files/files/MMRTG.pdf
- Wei P.-C. et al. “The intrinsic thermal conductivity of SnSe”, Nature 539, E1–E2 (2016) (Brief Communication Arising from Zhao et al.), DOI 10.1038/nature19832 — doi.org/10.1038/nature19832
- Mao J. et al. “High thermoelectric cooling performance of n-type Mg3Bi2-based materials”, Science 365, 495–498 (2019), DOI 10.1126/science.aax7792 — doi.org/10.1126/science.aax7792
- Kim S. I. et al. “Dense dislocation arrays embedded in grain boundaries for high-performance bulk thermoelectrics”, Science 348, 109–114 (2015), DOI 10.1126/science.aaa4166 — doi.org/10.1126/science.aaa4166
- Zhou C. et al. “Polycrystalline SnSe with a thermoelectric figure of merit greater than the single crystal”, Nat. Mater. 20, 1378–1384 (2021), DOI 10.1038/s41563-021-01064-6 — doi.org/10.1038/s41563-021-01064-6
- Shi X. et al. “Multiple-filled skutterudites: high thermoelectric figure of merit through separately optimizing electrical and thermal transports”, J. Am. Chem. Soc. 133, 7837–7846 (2011), DOI 10.1021/ja111199y — doi.org/10.1021/ja111199y
- Bubnova O. et al. “Optimization of the thermoelectric figure of merit in the conducting polymer poly(3,4-ethylenedioxythiophene)”, Nat. Mater. 10, 429–433 (2011), DOI 10.1038/nmat3012 — doi.org/10.1038/nmat3012
- Terasaki I., Sasago Y., Uchinokura K. “Large thermoelectric power in NaCo2O4 single crystals”, Phys. Rev. B 56, R12685 (1997), DOI 10.1103/PhysRevB.56.R12685 — doi.org/10.1103/PhysRevB.56.R12685
- National Institute of Advanced Industrial Science and Technology (AIST) “Development of an 11 % Conversion Efficiency Thermoelectric Module” (English translation of the press release of 26 November 2015, posted 20 May 2016) — aist.go.jp/aist_e/…/en20160520.html
- Wang H. et al. (Oak Ridge National Laboratory) “Annex VIII – Thermoelectric Materials for Waste Heat Recovery: An International Collaboration for Transportation Applications” (IEA implementing agreement on Advanced Materials for Transportation; includes the topical report “International Round-Robin Testing of Bulk Thermoelectrics”; November 2011; report number on the cover ORNL/TM-2011/393) — info.ornl.gov/…/Pub32716.pdf
- Wang H. et al. “Transport Properties of Bulk Thermoelectrics: An International Round-Robin Study, Part II: Thermal Diffusivity, Specific Heat, and Thermal Conductivity”, J. Electron. Mater. 42, 1073–1084 (2013), DOI 10.1007/s11664-013-2516-0 (bibliographic record only; the journal version of the same collaboration) — doi.org/10.1007/s11664-013-2516-0
- Snyder G. J., Snyder A. H. “Figure of merit ZT of a thermoelectric device defined from materials properties”, Energy Environ. Sci. 10, 2280–2283 (2017), and the authors’ device-ZT calculator page — thermoelectrics.matsci.northwestern.edu/…/ztcalc.html
- Lin S. et al. “Dramatically Enhanced Mechanical Properties of Nano-TiN-Dispersed n-Type Bismuth Telluride by Multi-Effect Modulation”, Materials 17, 1919 (2024), DOI 10.3390/ma17081919 (open access) — pmc.ncbi.nlm.nih.gov/articles/PMC11051758
- U.S. Geological Survey “Mineral Commodity Summaries 2026: Tellurium” (February 2026) — pubs.usgs.gov/periodicals/mcs2026/mcs2026-tellurium.pdf
- He J., Liu Y., Funahashi R. “Oxide thermoelectrics: The challenges, progress, and outlook”, J. Mater. Res. 26, 1762–1772 (2011), DOI 10.1557/jmr.2011.108 (bibliographic record only) — doi.org/10.1557/jmr.2011.108
- Hong S. et al. “Wearable thermoelectrics for personalized thermoregulation”, Sci. Adv. 5, eaaw0536 (2019), DOI 10.1126/sciadv.aaw0536 (open access) — doi.org/10.1126/sciadv.aaw0536
- IEC “IEC 62830-2:2017” (Semiconductor devices for energy harvesting and generation – Part 2: Thermo power based thermoelectric energy harvesting) — webstore.iec.ch/en/publication/30355
- IEC “IEC 62830-5:2021” (same series, Part 5: Test method for measuring generated power from flexible thermoelectric devices) — webstore.iec.ch/en/publication/26500
- Japanese Industrial Standards Committee (JISC) “JIS R 1650-1” search result and detail page (enacted 20 March 2002, last confirmed 22 June 2026) — jisc.go.jp (JIS R 1650-1)
- Japanese Industrial Standards Committee (JISC) “JIS R 1650-2” search result and detail page (enacted 20 March 2002, last confirmed 22 June 2026) — jisc.go.jp (JIS R 1650-2)
- Japanese Industrial Standards Committee (JISC) “JIS R 1650-3” search result and detail page (enacted 20 March 2002, last confirmed 22 June 2026) — jisc.go.jp (JIS R 1650-3)
- Japanese Industrial Standards Committee (JISC) “JIS R 1611” search result and detail page (enacted 1 November 1991, last revised 21 September 2010, last confirmed 20 October 2025) — jisc.go.jp (JIS R 1611)
- ISO “ISO 18755:2022” (Edition 2, December 2022, ISO/TC 206) — iso.org/standard/81531.html
- ISO “ISO 22007-4:2024” (Edition 3, January 2024, ISO/TC 61/SC 5) — iso.org/standard/86202.html
- NETZSCH “LFA 467 HyperFlash” (statement of compliant standards, including ASTM E1461, ISO 22007-4 and ISO 18755) — analyzing-testing.netzsch.com (LFA 467)
- NETZSCH “Precise Determination of the Specific Heat by Means of DSC” (mentions ASTM E 1269, DIN 51 007 and ISO 11357-4) — analyzing-testing.netzsch.com (DSC specific heat)
- ISO “ISO 11357-4:2021” (Edition 3, February 2021, ISO/TC 61/SC 5) — iso.org/standard/79998.html
13. Claim-to-source audit
| Claim in the text | Basis | Class |
|---|---|---|
| The definition ZT = (S²σ/κ)T, κ = κe + κL, κe = LσT, the name “power factor”. The ideal maximum-efficiency formula (Carnot factor times an average-ZT term) and the caveat that real efficiency is set by temperature-dependent S, σ and κ. The half-Heusler temperature range (400–800 °C), ZT rising from about 1 to 1.5, module efficiency near 10% and power density near 9 W/cm², the remark that unileg tests dominate, fracture toughness about 2 MPa·m1/2 and Poisson’s ratio about 0.2, matching of p and n leg thermal expansion, and commercial TEG efficiency of 5–8% | Poon’s review (J. Phys. D 2019) Reference 3 https://doi.org/10.1088/1361-6463/ab3d71 | Sourced |
| That thermoelectric materials need a conflicting combination of traits. The mechanisms that can push ZT up (defects, size effects, critical phenomena, anharmonicity, spin) | Reviews by Snyder and Toberer, and He and Tritt Reference 1 https://doi.org/10.1038/nmat2090 Reference 2 https://doi.org/10.1126/science.aak9997 | Sourced |
| The overview of applications (waste heat to electricity, electricity to cooling and heating, automobile seats, night-vision systems, cooling of electrical enclosures) | Bell (Science 2008) Reference 4 https://doi.org/10.1126/science.1158899 | Sourced |
| SnSe single crystal: ZT 2.6 ± 0.3 along b at 923 K, 2.3 ± 0.3 along c, 0.8 ± 0.2 along a, lattice thermal conductivity 0.23 ± 0.03 W/(m·K) at 973 K, and the explanation by anharmonicity | Zhao et al. (Nature 2014) Reference 5 https://doi.org/10.1038/nature13184 | Sourced |
| SnSe back-calculated density of about 5.43 g/cm³, 88–90% of the theoretical 6.07–6.18 g/cm³, that the concern is about the nature of the samples and not the measurement technique, and that the comment states the Reply by Zhao et al. confirmed a measured density below the theoretical value | Wei et al. (Nature 2016) Reference 7 https://doi.org/10.1038/nature19832 | Sourced |
| Polycrystalline SnSe: ZT about 3.1 at 783 K, lattice thermal conductivity about 0.07 W/(m·K), removal of tin oxides (the authors’ report) | Zhou et al. (Nat. Mater. 2021) Reference 10 https://doi.org/10.1038/s41563-021-01064-6 | Sourced |
| MMRTG: 768 thermocouples, PbTe/TAGS, about 110 W at launch, system efficiency 6%, estimated 72 W at the 17-year design life, about 2,000 W thermal, and the description of the Seebeck effect | NASA fact sheet Reference 6 https://www.nasa.gov/sites/default/files/files/MMRTG.pdf | Sourced |
| Mg3Bi2 family: ZT about 0.9 at 350 K, temperature difference about 91 K (hot side 350 K), and the authors’ statement that it is comparable to Bi2Te3-xSex and cheaper | Mao et al. (Science 2019) Reference 8 https://doi.org/10.1126/science.aax7792 | Sourced |
| Bi0.5Sb1.5Te3: zT 1.86 ± 0.15 at 320 K, dislocation arrays, maximum temperature difference 81 K | Kim et al. (Science 2015) Reference 9 https://doi.org/10.1126/science.aaa4166 | Sourced |
| Skutterudite (CoSb3 filled with Ba, La and Yb): ZT 1.7 at 850 K | Shi et al. (JACS 2011) Reference 11 https://doi.org/10.1021/ja111199y | Sourced |
| PEDOT:Tos: ZT = 0.25 at room temperature, thermal conductivity 0.37 W/(m·K); that below 200 °C the best commercial semiconductors are Bi2Te3-based with ZT near 1; the low lattice thermal conductivity common to materials with ZT above 2 | Bubnova et al. (Nat. Mater. 2011) Reference 12 https://doi.org/10.1038/nmat3012 | Sourced |
| NaCo2O4 single crystal: in-plane thermopower about 100 µV/K at 300 K and in-plane resistivity 200 µΩ·cm at 300 K. The existence of a review of oxides | Terasaki et al. (Phys. Rev. B 1997); He et al. (J. Mater. Res. 2011, bibliographic record only) Reference 13 https://doi.org/10.1103/PhysRevB.56.R12685 Reference 20 https://doi.org/10.1557/jmr.2011.108 | Sourced |
| PbTe sintered body ZT 1.8 at 550 °C; high-ZT range 300–700 °C; one-stage module (8 pairs) 8.8% and 3.55 W (600/30 °C); two-stage module 11% and 2.34 W (600/10 °C); simulations 12.2% and 15.6%; the cause of the gap (interface electrical resistance and heat loss); element dimensions; Fe-Co electrode; plans for long-term durability, mechanical properties and element substitution; the share of waste heat (over 60% of primary energy) | AIST release (English translation) Reference 14 https://www.aist.go.jp/aist_e/list/latest_research/2016/20160520/en20160520.html | Sourced |
| Round robin: the international collaboration under the IEA agreement (six countries and nine laboratories in the first round, four countries and nine in the second, seven results shown in each), the samples (Marlow n-type Bi2Te2.7Se0.3 and p-type Bi0.5Sb1.5Te3, average grain size about 20 µm, up to 225 °C), Seebeck scatter (about ±5.5% and ±4%), resistivity (up to ±12.5%; about ±5% at room temperature and ±9% at 200 °C), thermal diffusivity (±2–4% at room temperature, up to ±6–10%), specific heat (40–50% deviations, more than ±15%, Dulong-Petit), the conclusions “+4-9%” and “+5-10%”, sample-to-sample variation, the probe-spacing error, and that laboratory identities were mixed on purpose | Body of ORNL’s Annex VIII report Reference 15 https://info.ornl.gov/sites/publications/files/Pub32716.pdf | Sourced |
| That the Part II paper (thermal diffusivity, specific heat and thermal conductivity) of the same collaboration exists in Journal of Electronic Materials 42 (bibliographic record only) | Crossref bibliographic record Reference 16 https://doi.org/10.1007/s11664-013-2516-0 | Sourced |
| That device ZT changes with the temperature window (0.96 for 300–800 K and 0.72 for 300–600 K in the calculator page’s example) | Device-ZT calculator page by Snyder and co-workers Reference 17 https://thermoelectrics.matsci.northwestern.edu/thermoelectrics/ztcalc.html | Sourced |
| Mechanical weakness of zone-melted Bi2Te3, hardness 0.35 GPa, nano-TiN-dispersed n-type hardness 0.98 GPa, bending strength 36.3 MPa, compressive strength 74 MPa, ZT 0.957 at 375 K with an average ZT of 0.89 over 325–450 K, and damage to high-aspect-ratio devices | Lin et al. (Materials 2024) Reference 18 https://pmc.ncbi.nlm.nih.gov/articles/PMC11051758/ | Sourced |
| Tellurium as a by-product of copper refining, the estimated 2025 world consumption by use (solar cells 70%, thermoelectric devices 15%, metallurgy 10%, other 5%), China at an estimated 80% of refined tellurium, and China’s export-document requirement from February 2025 | USGS Mineral Commodity Summaries 2026 Reference 19 https://pubs.usgs.gov/periodicals/mcs2026/mcs2026-tellurium.pdf | Sourced |
| Wearable thermoelectric device (double elastomer layers and rigid thermoelectric pillars, cooling effect above 10 °C, COP above 1.5) | Hong et al. (Sci. Adv. 2019) Reference 21 https://doi.org/10.1126/sciadv.aaw0536 | Sourced |
| Title, scope and publication date of IEC 62830-2:2017 and IEC 62830-5:2021 | IEC Webstore Reference 22 https://webstore.iec.ch/en/publication/30355 Reference 23 https://webstore.iec.ch/en/publication/26500 | Sourced |
| Numbers, titles, enactment dates and confirmation dates of JIS R 1650-1, -2, -3 and JIS R 1611 | JISC database Reference 24 https://www.jisc.go.jp/app/jis/general/GnrJISNumberNameSearchList?show&jisStdNo=R1650-1 Reference 25 https://www.jisc.go.jp/app/jis/general/GnrJISNumberNameSearchList?show&jisStdNo=R1650-2 Reference 26 https://www.jisc.go.jp/app/jis/general/GnrJISNumberNameSearchList?show&jisStdNo=R1650-3 Reference 27 https://www.jisc.go.jp/app/jis/general/GnrJISNumberNameSearchList?show&jisStdNo=R1611 | Sourced |
| Numbers, titles, editions and scope of ISO 18755:2022, ISO 22007-4:2024 and ISO 11357-4:2021 | ISO standard pages Reference 28 https://www.iso.org/standard/81531.html Reference 29 https://www.iso.org/standard/86202.html Reference 32 https://www.iso.org/standard/79998.html | Sourced |
| That an instrument maker lists ASTM E1461 and ASTM E1269 as standards alongside ISO 22007-4, ISO 18755 and ISO 11357-4 (the ASTM website was not consulted) | NETZSCH pages (non-ASTM public material) Reference 30 https://analyzing-testing.netzsch.com/en/footer/legacy-products/lfa-467-hyper-flash-light-flash-apparatus Reference 31 https://analyzing-testing.netzsch.com/en-US/know-how/tips-tricks/dsc/precise-determination-of-the-specific-heat-by-means-of-dsc | Sourced |
| Ideal efficiency by temperature window and average ZT (window A 8.8–21.7%, window B 2.2–5.6%), equivalent ZT of AIST’s module (about 0.46 and 0.72), the combination of ZT uncertainties (about 14%, worst case 24%), and the arrangement of the standards table | Our calculation. Temperatures substituted into the ideal formula (Reference 3). Assumptions and limits are stated in each place | Our calculation |
| The texts of standards, ASTM standards covering the Seebeck coefficient or device evaluation, round-robin figures from the journal versions, reproduction or correction of Zhou et al., long-term reliability of devices, and the applicability of RoHS and similar regulations | Could not be confirmed in the primary sources accessible within the scope of this survey, so they are not stated | Commentary |
| The readings that “lowering thermal conductivity sits next to making the microstructure fragile”, “both p-type and n-type are needed”, “four questions for reading ZT”, and “the interface may set the lifetime”. The carrier-concentration concept (Fig. 3) and the arrangement of temperature ranges (Fig. 4) | This article’s arrangement and commentary based on published content. Not views stated by any institution or company | Commentary |
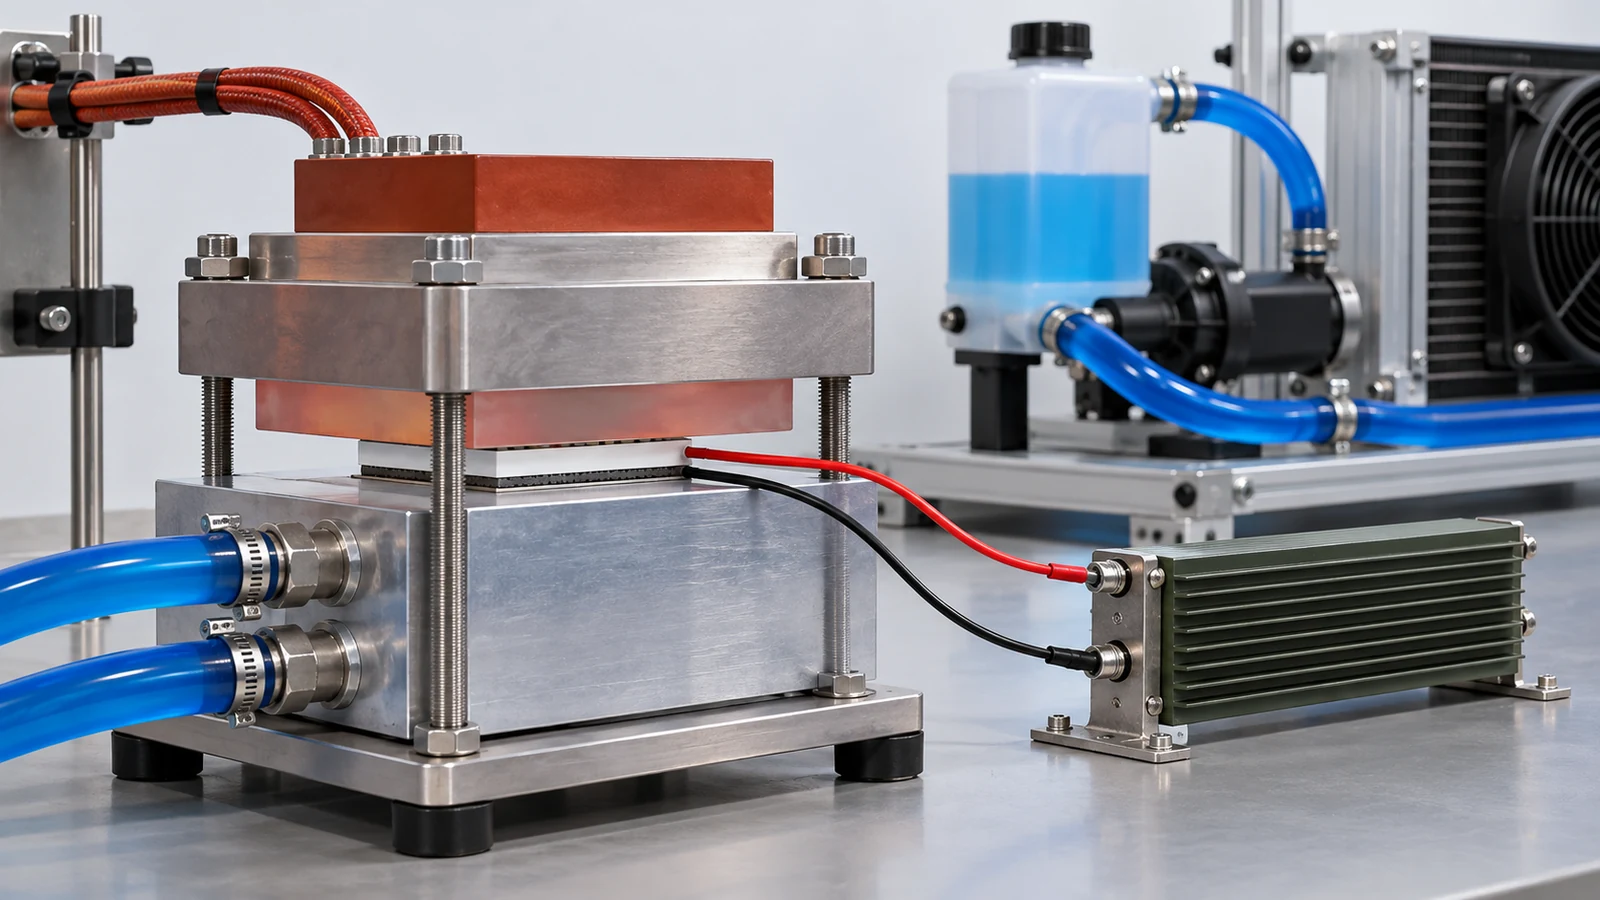
| That Figs. 2, 3, 4 and 6 are explanatory drawings, not real observations or data, and that Figs. 1 and 5 are AI-generated images | Note by this article | Commentary |
Last updated 10 October 2026. Sources are limited to primary material (peer-reviewed papers, official materials from NASA, AIST and USGS, and standards-body pages). The texts of standards are paid and could not be checked. The ASTM International website was not consulted. Because the article includes structural readings and materials-design interpretations, those are marked as Commentary and kept separate from sourced fact. The texts of standards, ASTM standards covering the Seebeck coefficient or device evaluation, round-robin figures from the journal versions, reproduction or correction of Zhou et al., long-term reliability of devices, and the applicability of RoHS and similar regulations could not be confirmed and are not stated here. The ZT, efficiency and temperature-difference figures are results for particular samples and prototype modules under particular conditions and cannot be generalised to production parts or other samples. All figures are explanatory concept graphics. Figs. 2, 3, 4 and 6 are vector drawings; Figs. 1 and 5 are AI-generated images, and none of them shows a real cross-section, micrograph or physical product.