TECHNOLOGY EXPLAINER
Graph Neural Networks
Reading crystals and molecules as atoms (nodes) and bonds (edges)
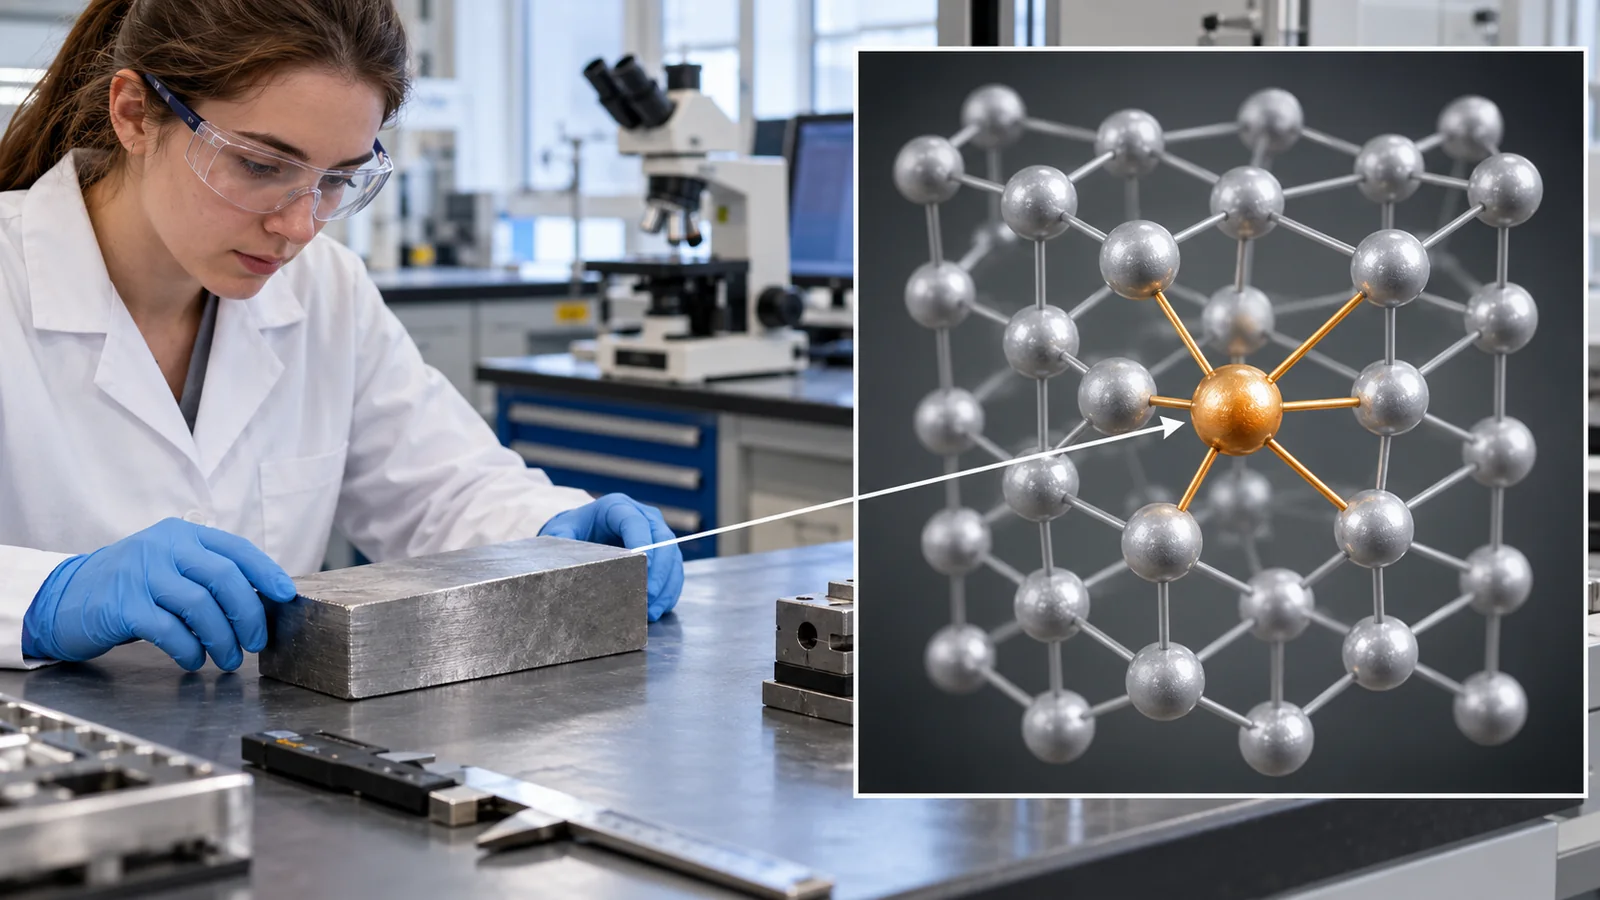
When AI predicts the properties of a crystal or a molecule, the material does not have to be squeezed into a table of numbers (a "business card"). It can be handed over as it is: a network in which atoms are dots and nearby atoms are joined by lines (a graph). That is the idea behind the graph neural network (GNN). This article explains how the graph is built, the one operation at the heart of a GNN (collecting information from neighbours), and the main models (CGCNN, MEGNet, M3GNet, equivariant networks and others), using figures and small numerical examples. It then sets out how to read the accuracy figures that papers report and the difference between a computed prediction and an experimental confirmation, from a materials engineer's viewpoint.
- The short version, what to know first, and where this fits in the series
- Why a graph? From a business card to a map of connections
- Atoms as nodes, bonds as edges: graphs of molecules and crystals
- Collecting information from neighbours: message passing
- From atoms to one prediction: readout and training
- The main models, in order
- Distances only, or directions too: invariant and equivariant
- How far can it see? Cutoff and number of updates
- How to read the accuracy figures
- Prediction is not experiment: the GNoME example
- A materials engineer's view
- Limits, what we could not confirm, and a summary
- How to read the yardsticks and standards
- Glossary
- References
- Claim-to-source audit
Sourced = stated in a published source (linked)
Our calculation = a value computed in this article from the stated assumptions
Not yet confirmed = plans, targets, drafts, work in progress, outlooks: not settled
Our own reading for materials engineers is marked as commentary. Inference is shown in bold. Claims by research groups and companies are labelled as claims.
1. The short version, what to know first, and where this fits in the series
- A GNN reads a crystal or molecule as a graph (atoms = nodes, pairs of nearby atoms = edges), repeats an operation in which each node collects information from its neighbours, and predicts a property value. CGCNN (2018), a representative crystal model, was trained on 46,744 crystals from the Materials Project and reported a mean absolute error (MAE) of 0.039 eV/atom for formation energy Sourced[Ref. 1]
- The strength is that you do not have to design the "business card" by hand: features are learned from the arrangement of atoms. The weaknesses are that atom positions (a structure) are needed, that little data is a handicap, and that the model is weak outside what it was trained on. The Matbench authors state that crystal-graph methods "appear to outperform" traditional methods at about 10⁴ or more data points Sourced[Ref. 2]
- The error figures in papers are differences from DFT values, not from experiment. And "AI found 2.2 million stable structures" (GNoME) is a computed (DFT) prediction; 736 of the structures match structures that had already been reported in experiments. Read predictions and experiments separately Sourced[Ref. 3]
Machine learning is "an approximator that learns trends from past data". A neural network is "a function that takes numbers in and gives numbers out, with knobs (weights) tuned on data" (see our explainer on machine learning and neural networks). A descriptor is "a business card that expresses a material in numbers"; DFT is "a physics simulation that computes properties from the behaviour of electrons" (it contains approximations and need not agree with measurements). This article is readable on its own: the points you need are explained in the text.
"Graph" here does not mean a line chart or a bar chart. It means a diagram of dots and lines showing what is connected to what, like a railway map of stations and tracks.
A good order is: learn how to make the "business card" in our explainer on materials data and descriptors, then read this article to see how the card can be learned instead. How a GNN predicts forces on atoms is covered in our explainer on machine-learning interatomic potentials, the reliability of a prediction in the explainer on uncertainty and applicability domain, and how to judge results in the explainer on evaluating and reproducing MI results.
2. Why a graph? From a business card to a map of connections
Recall the structural formula from chemistry class: carbon and oxygen drawn as dots, bonds as lines. It looks much like a railway map, with stations as dots and tracks as lines. Chemists have used such diagrams (chemical graphs) since the 19th century Sourced[Ref. 4]. A GNN makes this "diagram of dots and lines" something a computer can read directly.
How was it done before? When a material is fed to machine learning, the usual input is a descriptor (the business card): numbers chosen by a person, such as "average electronegativity" or "average ionic radius" computed from the composition or structure. The advantage is that they work with small data sets. The drawback is that materials with the same composition but different atomic arrangements (for example diamond and graphite) can end up with similar cards.
| Aspect | Descriptors (business card) + conventional machine learning | Graph + GNN |
|---|---|---|
| Input | A list of numbers designed by a person (such as composition averages) | Atom types and the distances (connections) between atoms |
| How features are made | Thought up by people | Learned from data (numbers per atom are updated step by step) |
| Atomic arrangement (structure) | Only what was put into the card | Used as it is |
| Data required | Composition alone may do (depends on the card) | Usually atom positions (a crystal structure) are needed |
| Where it does well | Prediction with little data | When there is a lot of data (the Matbench authors' remark: about 10⁴ or more) |
The arrangement of the table is Our calculation (organisation). Commentary based on the explanation of Reiser et al. [Ref. 4] and the Matbench remark [Ref. 2].
A railway map does not show the real distance between stations. In a crystal, however, properties change when an atom moves 0.1 Å (1 Å is 0.1 nm) closer or farther. So most GNNs give each edge a distance value: think of it as using both "what is connected" and "how far apart".
3. Atoms as nodes, bonds as edges: graphs of molecules and crystals
The way the graph is built differs a little between molecules and crystals.
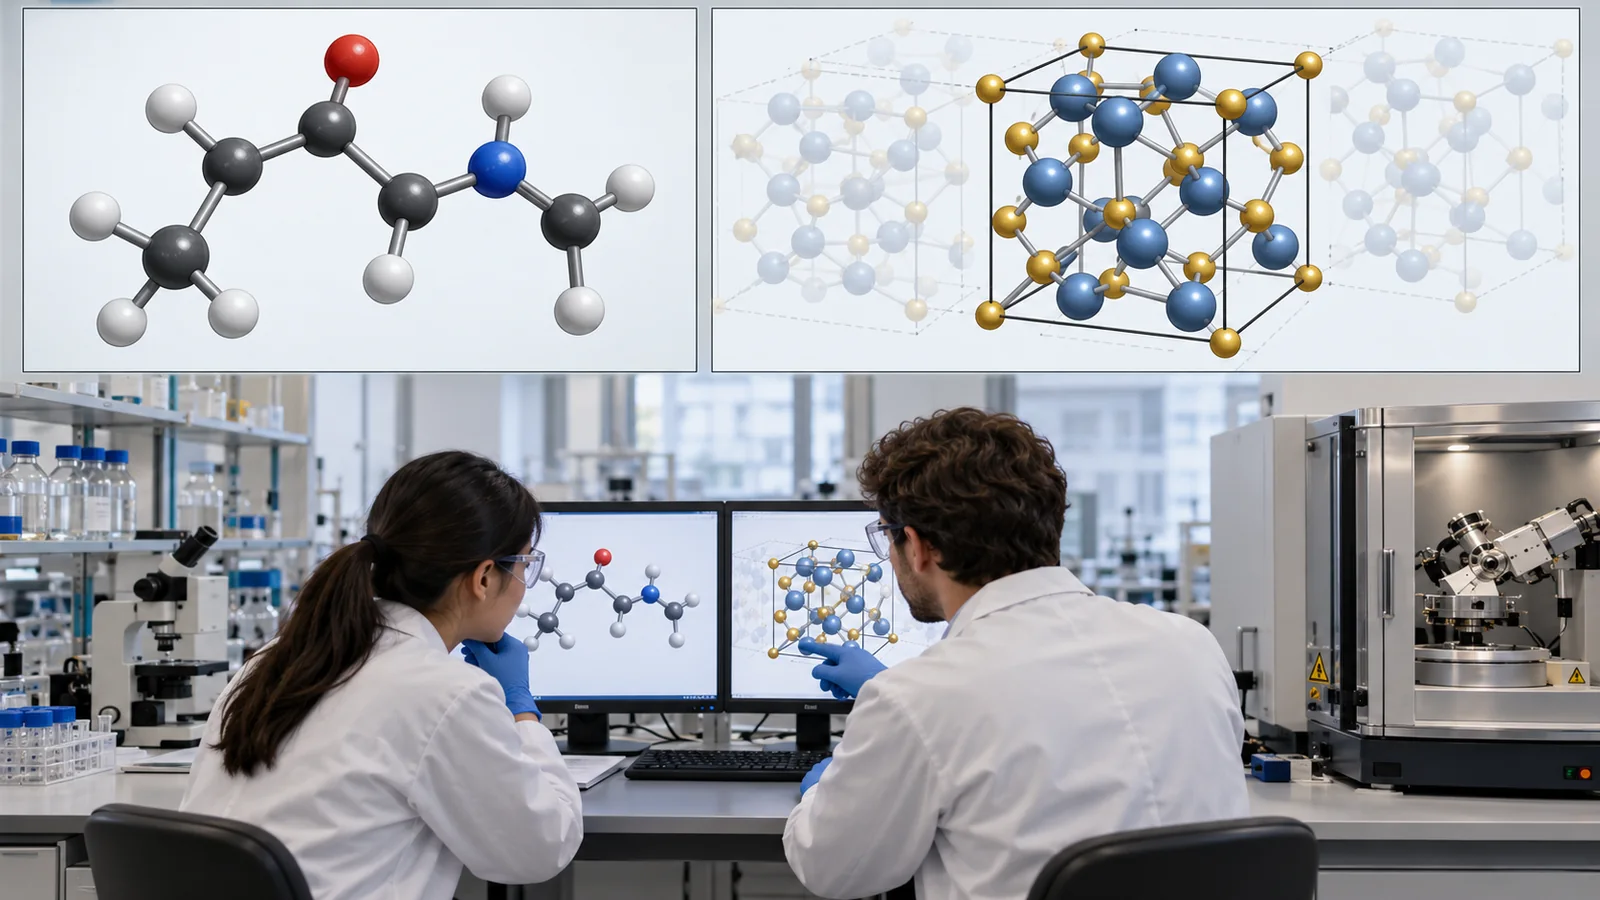
View original SVG, values and sources
Original SVG reference: Concept diagram (vector drawing). How a molecule (ethanol) and a crystal (a 2-D sketch) become graphs. In the crystal the centre atom is linked to every atom inside the cutoff radius, including copies outside the cell.
- Molecules: atoms are nodes and chemical bonds are edges. Ethanol (C₂H₅OH) has nine nodes. A structural formula already is a graph.
- Crystals: bonds are often not sharply defined, so a common rule is "link atoms that lie within a certain distance (the cutoff radius)". Because a crystal repeats the same pattern, an atom is also linked to copies of atoms outside the unit cell (periodic boundary conditions). The result can be several edges between the same pair of atoms (a multigraph) Sourced[Ref. 1]
- What a node carries: CGCNN used nine properties of the element (group, period, electronegativity, covalent radius, number of valence electrons, first ionization energy, electron affinity, block and atomic volume). For crystals, MEGNet uses only the atomic number and the distance Sourced[Refs. 1, 5]. The idea is that even with little input, the model can relearn the properties of elements during training.
Think of looking at the neighbourhood of an atom through a magnifying glass. The radius of the glass is the cutoff radius. Atoms inside the lens count as "neighbours" and are joined by edges; atoms outside are ignored. CGCNN searched for neighbours within 6 Å and then kept those that share a Voronoi face (the boundary between the regions of adjacent atoms) and lie closer than the sum of the covalent radii plus 0.25 Å. The same paper adds that simply linking the 12 nearest atoms performed as well Sourced[Ref. 1]. In other words, the details of how lines are drawn sometimes matter little.
The input of a crystal GNN is the atom types and positions (the crystal structure). If your experimental data are only "formulation and measured value", they cannot be used as they are. There are ways to use only the composition (GNoME's compositional models make a node of each element in the composition Sourced[Ref. 3]), but the strength of reading the atomic arrangement is lost. Conversely, a material system for which you hold CIF files (crystal-structure data) is a candidate for a GNN.
For a material that has not been made, the structure itself is a "prediction". If the input structure differs from reality, the output cannot be relied on either. Include the assumption behind the structure when you interpret a result (commentary).
4. Collecting information from neighbours: message passing
The central operation of a GNN is message passing (receiving information from neighbours and updating yourself). Think of an office. You listen to the person next to you and slightly update your own view. If everyone does this at the same time and repeats it a few times, what the neighbour's neighbour said also reaches you, bit by bit.
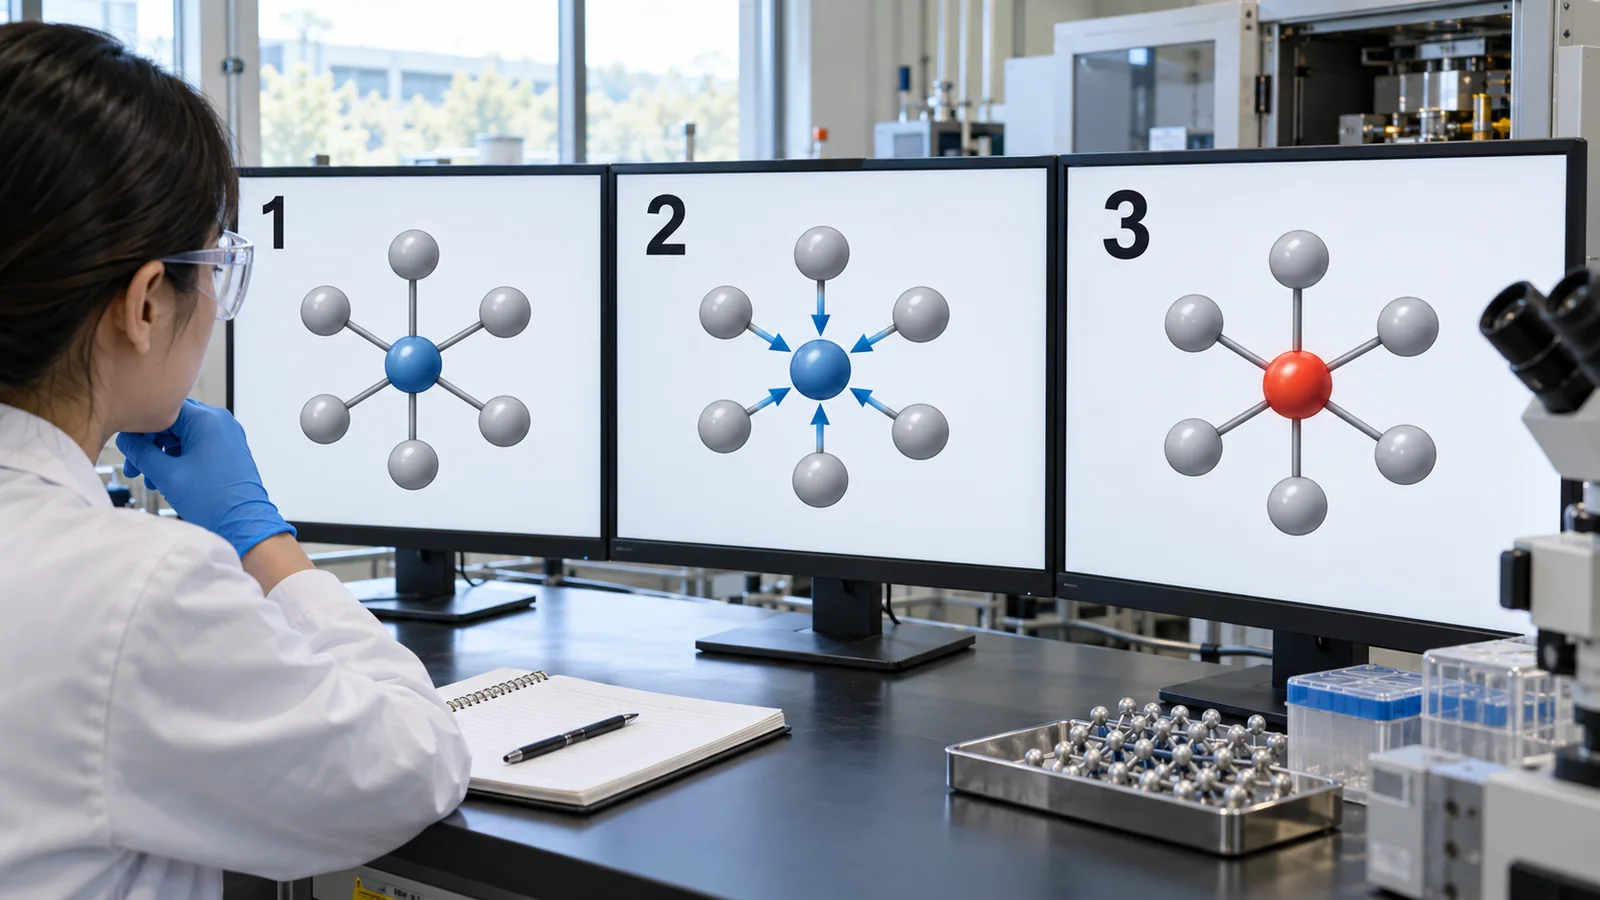
View original SVG, values and sources
Original SVG reference: Concept diagram (vector drawing). A concept diagram of message passing. Each further update brings information from farther atoms to the atom of interest (orange).
- Hold: each atom holds a list of numbers (a vector). At first the numbers are set from the element type.
- Receive: it receives numbers (and distance information) from neighbouring atoms.
- Update: to its own numbers it adds a summary of what it received (a sum or an average), adjusted by learned weights.
This is repeated K times. Gilmer et al. expressed the framework with three functions: a message function (what to send), an update function (how to update) and a readout function (how to summarise at the end). Many GNNs for chemistry and materials, such as CGCNN, SchNet and MEGNet, can be written as variants of this framework Sourced[Refs. 6, 4].
Checking with a small numerical example
Let us check how it behaves with a toy example simpler than a real model. Three atoms A-B-C are connected in a row. Their starting values are A=1, B=3 and C=2. The update rule is "new value = own value + 0.5 × (average of the neighbours' values)" (a toy rule for explanation, not the equation of a real GNN).
| State | A | B | C | Example of the calculation |
|---|---|---|---|---|
| Start | 1 | 3 | 2 | - |
| After 1 update | 2.5 | 3.75 | 3.5 | A: 1 + 0.5 × 3 = 2.5; B: 3 + 0.5 × (1 + 2) / 2 = 3.75 |
| After 2 updates | 4.375 | 5.25 | 5.375 | A: 2.5 + 0.5 × 3.75 = 4.375 |
| C changed from 2 to 4, recomputed (after 1) | 2.5 | 4.25 | 5.5 | A does not change |
| C changed from 2 to 4, recomputed (after 2) | 4.625 | 6.25 | 7.625 | A changed from 4.375 to 4.625 |
The numbers in the table are Our calculation (a toy example; not the equations or values of any real model).
Two things follow from the table. (1) Changing C does not change A's value after one update (A is not directly connected to C). (2) After two updates, C's change reaches A. The number of updates decides how far away an atom can influence you. Also, because an "average of the neighbours" is used, reordering the neighbours does not change the result. Atoms have no natural order. Gilmer et al. also require this property (independence of order) of the readout function Sourced[Ref. 6].
In more detail: the CGCNN update equation (skip it if equations are not for you)
In words, the CGCNN update is "new value = old value + Σ (gate × information from a neighbour)". The sum Σ runs over all connected neighbours. The gate is a number between 0 and 1 (a sigmoid function) that decides "how much of this neighbour's information to let through". Because the gate is learned, the authors say that the influence of weak bonds can be reduced automatically. Compared with a simpler version without gates (the same weight for all neighbours), the validation error for formation energy fell from 0.136 eV/atom to 0.039 eV/atom Sourced[Ref. 1]. It shows how much the design of "how to mix" can change the result.
More updates reach farther, but too many cause problems: every atom ends up with similar numbers (over-smoothing) and far-away information is squeezed through narrow paths and lost (over-squashing). For a typical molecule or crystal cell with n atoms, roughly log n updates are said to be enough for information to reach every atom Sourced[Ref. 4]. As real examples, SchNet uses three interaction blocks (update layers) [Ref. 7], and the MEGNet paper includes three-block models [Ref. 5].
5. From atoms to one prediction: readout and training
When the updates are done, a list of numbers remains for each atom. To get one property of the whole crystal (formation energy, for example), the numbers of all atoms are combined into one (readout, or pooling). CGCNN takes the average of all atoms' numbers. An average does not change much whether the atoms are listed in a different order or the cell is chosen larger (the same crystal counted in a bigger cell) Sourced[Ref. 1]. A small neural network then converts the combined numbers into the property value.
Training works as in other machine learning. Values computed by DFT are taken as the "answer", and the weights are nudged little by little so that the difference from the prediction (the error) shrinks. People decide the cutoff radius, the number of updates, and what to put on nodes and edges (hyperparameters). In the CGCNN example, 46,744 crystals (87 elements) from the Materials Project were split at random into 60% for training, 20% for validation (choosing settings) and 20% for testing Sourced[Ref. 1].
A GNN is an approximator that learns patterns in values computed by DFT and the like. It is not solving the Schrödinger equation. For atomic environments not covered by the training data (extrapolation), errors can be large. Treat the accuracy as a value "inside the range that was learned". This is also the limit of our analogy: the "approximator" view is the basic one (commentary).
6. The main models, in order
The main GNN models are listed by year. Each model uses different training data and evaluation conditions, so this table cannot tell you which is better. Read it as an outline of "what was new".
| Model (year) | What was new | Reported example (with conditions) |
|---|---|---|
| Duvenaud et al. (2015) | Applied convolution directly to molecular graphs; generalised the traditional "molecular fingerprint" into something learned from data Sourced[Ref. 8] | - |
| MPNN (Gilmer et al., 2017) | Organised the message, update and readout framework; tested on 13 molecular properties (QM9) Sourced[Ref. 6] | About 110k molecules for training; the authors claim chemical accuracy on 11 of 13 targets (against DFT values) |
| SchNet (Schütt et al., 2017) | Filters that vary continuously with distance; forces are obtained as derivatives of the energy, so energy conservation holds by construction Sourced[Ref. 7] | QM9: U₀ MAE of 0.31 kcal/mol (110,462 training molecules) |
| CGCNN (Xie and Grossman, 2018) | For crystals. Uses nodes and edges, and can extract the contribution of each local environment Sourced[Ref. 1] | Formation-energy MAE of 0.039 eV/atom (28,046 training crystals) |
| MEGNet (Chen et al., 2019) | Besides nodes and edges it also holds a "global state" (such as temperature). Works for both molecules and crystals; element representations were reused for another property Sourced[Ref. 5] | Formation-energy MAE of 0.028 eV/atom (60,000 training crystals) |
| ALIGNN (Choudhary and DeCost, 2021) | Treats bond angles explicitly, through a graph of bonds (a line graph) Sourced[Ref. 9] | Applied to 52 properties; up to 85% better accuracy than some earlier GNNs (the authors' claim) |
| NequIP (Batzner et al., 2022) | "E(3)-equivariant" convolutions, in which directional quantities rotate together with the structure under rotation, translation and reflection Sourced[Ref. 10] | High accuracy from little training data (the authors' claim) |
| MACE (Batatia et al., 2022) | An equivariant model that sends four-body, higher-order information at once, cutting the updates to two Sourced[Ref. 11] | Matches or exceeds state-of-the-art accuracy on rMD17 and others (the authors' claim) |
| M3GNet (Chen and Ong, 2022) | Adds three-body terms (angles); covers 89 elements of the periodic table; outputs energy, forces and stress Sourced[Ref. 12] | Test MAE: energy 0.035 eV/atom, force 0.072 eV/Å, stress 0.41 GPa (training data: relaxation histories from the Materials Project) |
| CHGNet (Deng et al., 2023) | Pretrained on the histories of about 1.5 million Materials Project structures; also learns magnetic moments, so it carries charge information Sourced[Ref. 13] | Applied to Li diffusion and more (reported by the authors) |
Each number is a value under the conditions of its own paper (data set, split and metric differ). The arrangement of the table is Our calculation (organisation). Checked on 22 October 2026.
The lower half of the table (M3GNet, CHGNet, NequIP, MACE) can output the forces on atoms, so these models are used as machine-learning interatomic potentials (see our explainer on machine-learning interatomic potentials).
7. Distances only, or directions too: invariant and equivariant
Physics has an important symmetry: "turning the system in space does not change its essence". If you rotate a water molecule on a desk, its energy does not change. But the force on an atom is an arrow with a direction, so if you rotate the molecule, the arrows rotate with it.
- Invariant: the value does not change on rotation. A single number such as the energy is invariant. Distances and angles do not change on rotation, so models that use only distances and angles (CGCNN, MEGNet, SchNet, M3GNet and others) give an energy that is invariant to rotation Sourced[Ref. 4].
- Equivariant: when the system is rotated, the value rotates in the same way. The force arrows are an example. NequIP and similar models keep features not as plain numbers but as quantities with direction (vectors and so on) and use the directional information all the way through. The output energy is invariant, and the forces follow as its derivative Sourced[Ref. 10].
The NequIP authors claim accuracy equal to or better than earlier models with "up to three orders of magnitude fewer training data". For water and ice they report training on 133 structures and getting smaller force errors than another method (DeepMD) trained on about 133,000 structures (they add that the energy errors of DeepMD, with much more training data, were lower). They also compared a version without directional features (l=0) with versions that have them, and state that equivariance consistently improved accuracy. They also write that why equivariance reduces the data needed is not yet understood in theory Sourced[Ref. 10]. MACE claims to keep both speed and accuracy by sending higher-order (four-body) information at once, which reduces the number of updates to two Sourced[Ref. 11].
Equivariant models are advantageous when handling directional quantities such as forces, or learning from little data, and these papers showed it on particular data sets. If you only predict a scalar property, a model using only distances and angles is often sufficient (inference). Note also that MD17 has a revised version (revised MD-17), recomputed with higher numerical accuracy, and the NequIP paper evaluates on both. Numbers from different versions of a data set cannot be compared Sourced[Ref. 10].
8. How far can it see? Cutoff and number of updates
The properties of a material depend not only on the nearest atoms but also on atoms a little farther away. How far a GNN can see is set by two things: the distance reached by one update, which is the cutoff radius, and the number of updates K. The upper bound is "K × cutoff radius".
- Counting in a face-centred cubic lattice (an example with lattice parameter 4.2 Å), a 4 Å cutoff includes 12 atoms, 5 Å includes 18 and 6 Å includes 54 Our calculation. Widening the radius a little greatly increases the number of neighbours.
- With a 5 Å cutoff and K=3 updates, the upper bound is 15 Å, and about 766 atoms fall inside the range Our calculation. The range widens, but so does the amount of computation.
- These numbers come from counting atoms in an example lattice and are not tuned to a real material. The cutoffs in the papers are 6 Å (neighbour search) for CGCNN, 5 Å (4 Å for three-body terms) for M3GNet, and 4 Å for GNoME's structural models and 5 Å for its potentials Sourced[Refs. 1, 12, 3].
Interactions that reach far, such as electrostatic forces, are thought to be hard to handle just by collecting neighbour information a few times. The review notes that adding long-range contributions (such as electrostatic interactions) can improve transferability Sourced[Ref. 4]. For ionic materials, interfaces and charged defects, check how far the model's treatment extends (commentary).
9. How to read the accuracy figures
Papers are full of statements like "error 0.039 eV/atom". Here are the points a materials engineer should check, in order.
(1) Error against what?
The CGCNN error is the difference from values computed by DFT (not from experimental values). The paper compared the model error of 0.039 eV/atom with the error of DFT against experiment reported by another study (Kirklin et al.: 0.081 to 0.136 eV/atom) and said it is close to or better than the accuracy of DFT Sourced[Ref. 1]. But this does not mean that the model predicts experiments better than DFT does. The model learns DFT values as its "answer", so the errors of DFT (for example, underestimated band gaps) are inherited by the model.
If the "answer" in training is a DFT value, the GNN is a tool for reproducing DFT values quickly; it cannot give values closer to experiment than DFT does. To get closer to experiment you need other measures, such as training on experimental values or correcting with experimental data.
(2) How the data were split
CGCNN split its data at random into 60%, 20% and 20%. With a random split, materials with very similar compositions and structures can land on both the training side and the test side, which tends to make the test error smaller than it would be for a "material never seen before" (possible data leakage; commentary). Matbench is a test suite that allows methods to be evaluated by the same procedure on 13 tasks (312 to about 132,000 samples). Its authors say that crystal-graph methods "appear to outperform" traditional methods at about 10⁴ or more data points, while an automated traditional method (Automatminer) was best on 8 of the 13 tasks Sourced[Ref. 2]. The method that suits you changes with the amount of data.
(3) Regression accuracy and the "stable or not" decision are different
The authors of Matbench Discovery point out that a model can predict formation energy accurately and still produce many false positives when deciding "stable or unstable". Near the stability boundary (0 eV/atom above the convex hull), a small error can flip the decision Sourced[Ref. 14]. Bartel et al. also report that models using only the composition can predict formation energy but do poorly at predicting stability Sourced[Ref. 15].
10. Prediction is not experiment: the GNoME example
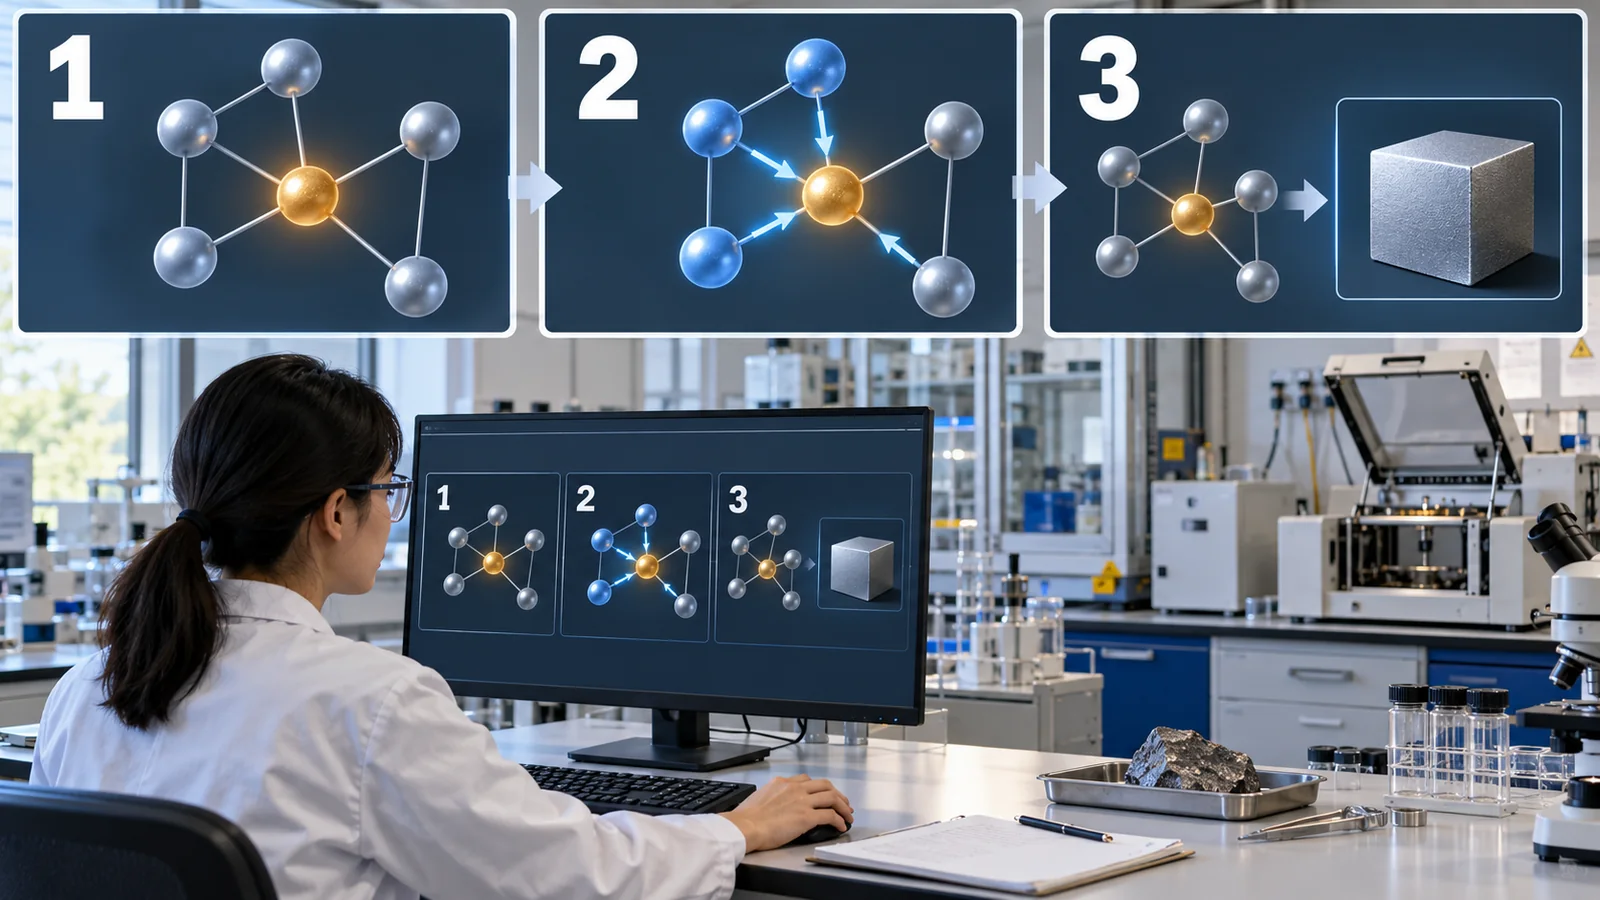
GNNs drew wide attention through GNoME, published in Nature in 2023 by a research group at Google DeepMind. Candidates were narrowed down with GNNs (graph networks), checked with DFT, and the results were fed back into training, a loop of "active learning" repeated many times. Let us read what was claimed and what was confirmed, separately Sourced[Ref. 3].
- Computed prediction: about 2.2 million structures were computed to be stable relative to earlier data, and about 381,000 of them are new crystals on the updated convex hull. The judgement is made with DFT (the PBE functional), and it is thermodynamic stability at 0 K Sourced[Ref. 3].
- Progress of the method: over six rounds of active learning, the hit rate (the share of predictions that turn out stable) rose from under 6% to over 80% for the structural models and from under 3% to 33% for the compositional models. The final models are reported to have a prediction error of about 11 meV/atom Sourced[Ref. 3].
- Comparison with experiments: the ICSD (a database of inorganic crystal structures) contains 736 structures that other researchers obtained independently in experiments and that match GNoME's predictions Sourced[Ref. 3]. This is not the number of materials that GNoME newly synthesised and confirmed.
- Open problems named by the authors: phase transitions between competing polymorphs, stability that takes vibrations into account, the effect of configurational entropy, and above all "synthesizability" Sourced[Ref. 3].
- A commentary: Cheetham and Seshadri (2024) found scant evidence for compounds that satisfy novelty, credibility and utility together, and noted the need to bring in expertise in synthesis and crystallography Sourced[Ref. 16]. It is reasonable to read the two views side by side.
Precisely, "about 2.2 million structures were found that were judged stable by calculation". Stable on paper does not mean you can make it (synthesis conditions, reaction rates, impurities, crystal disorder and so on). Keep the division of labour in mind: AI narrows the predictions, and synthesis and measurement confirm them.
For a candidate that calculation calls stable, the experiment checks in turn (1) was the target phase obtained (telling it from known compounds or solid solutions, for example by powder X-ray diffraction), (2) does it reproduce (another lot, other conditions), (3) the effect of impurities and disorder (for example, atoms sharing the same site), and (4) does it deliver the performance (the target property). Measuring a known reference material under the same conditions and looking at lot-to-lot variation are the basics of the experimental design (commentary).
11. A materials engineer's view
Training a GNN from scratch on a few thousand in-house data points is often a difficult condition. In light of the Matbench authors' remark (crystal-graph methods appear to win at about 10⁴ or more data points), conventional descriptor-based methods can stay competitive with little data Sourced[Ref. 2]. Three options come to mind (commentary).
- Descriptors + a conventional method (for small data; see our explainer on small-data machine learning).
- Use a pretrained model: models such as M3GNet or CHGNet, trained on large data, for structure relaxation or for narrowing candidates. First check the range of the training data, the elements covered and the evaluation tasks. The M3GNet authors list as a limitation that the DFT calculations in the Materials Project, which they trained on, used looser settings than best practice (a lower cutoff and sparser k-point grids) Sourced[Ref. 12].
- Transfer learning: MEGNet reused the element representations learned on a property with a lot of data (formation energy) for properties with little data (band gap and elastic moduli), and reports faster training and better performance Sourced[Ref. 5].
CGCNN can extract how the local environment of each atom contributed to a value for the whole crystal. For perovskites, the authors drew out trends such as which elements are favoured on the A site (large-radius elements), and showed that this can hint at empirical rules for design Sourced[Ref. 1]. This is a trend that emerged from correlations in the data, not proof of cause. It needs checking against empirical rules and confirmation by experiment (see our explainer on explainable AI and materials insight).
12. Limits, what we could not confirm, and a summary
(1) What we could not confirm
- The detailed conditions of ALIGNN's "up to 85%" comparison (which earlier models, on which data sets) are given only in the abstract, and we did not confirm them.
- For CHGNet and MACE we stay within the figures in the abstracts and make no ranking against other models.
- The errors of CGCNN, MEGNet and SchNet use different Materials Project snapshots and splits, so they are not a same-condition comparison. We did not confirm any result obtained under identical conditions.
- We did not confirm the individual matches behind GNoME's 736 structures (which compound matched which experimental report); they are in the supplementary material.
- We could not confirm an international standard specific to GNNs for MI.
- A GNN reads a graph in which atoms are nodes and pairs of nearby atoms are edges, repeats the collection of neighbour information, and predicts a property value. In crystals, atoms inside the cutoff radius (including copies from periodic boundary conditions) are linked Sourced
- The number of updates and the cutoff radius decide how far the model can see (upper bound K × cutoff). The wider the range, the more neighbours and the more computation Our calculation
- Some models use only distances and angles; equivariant models also use directional quantities. The latter are claimed to be advantageous for force prediction and for little data Sourced
- Reported errors are differences from DFT values, and cannot be compared when conditions (data size, split) differ. Regression accuracy and the stable-or-not decision are separate matters Sourced
- GNoME's roughly 2.2 million are computed predictions; 736 match structures already reported in experiments, and a commentary exists. Read predictions and experiments separately Sourced
13. How to read the yardsticks and standards
The first yardstick of a GNN is the prediction error (MAE and the like: how far from the "answer" such as a DFT value). Next come how the data were split (at random, or by composition or structural family) and against what the error is measured (DFT values or experiments). Even a small error tells you little about how it will do on your own materials until you check these. Checked on 22 October 2026.
| Item | Representative benchmarks and methods (name, source) | Standards and guidance (ISO/IEC, NIST, etc.) | Reading notes |
|---|---|---|---|
| Error in predicting a property | Matbench: 13 tasks (312 to about 132,000 samples) on optical, thermal, electronic, thermodynamic, tensile and elastic properties of inorganic crystals (Dunn et al. 2020) [Ref. 2]Sourced JARVIS-Leaderboard (NIST; 274 benchmarks, 152 methods, 1281 contributions, as of the paper) [Ref. 17]Sourced | Not found (we did not find an international standard defining how to evaluate GNN errors) | The suitable method differs by task. A ranking is not the same as strength on your own materials |
| Judging stability | Matbench Discovery: evaluates machine-learning energy models as a pre-filter in a search for stable crystals, and points out a misalignment between regression metrics and decision metrics (Riebesell et al. 2025) [Ref. 14]Sourced | Not found | Even an accurate regression gives more false positives near the boundary (0 eV/atom above the hull) |
| Accuracy of interatomic potentials | QM9 (13 molecular properties, Gilmer et al.) [Ref. 6]. MD17 has a recomputed revised version, and the NequIP paper evaluates on both [Ref. 10]Sourced | Not found | The same name can hide different versions. Check the version of the data set |
| Terminology and data quality | - | ISO/IEC 22989:2022 (AI concepts and terminology, published July 2022) [Ref. 18]; ISO/IEC 5259-1:2024 (data quality for analytics and machine learning, Part 1: overview, terminology and examples, published July 2024) [Ref. 19]Sourced | General AI standards, not specific to GNNs or materials. The texts are paid, and we did not check their requirements |
| Quality of the training data (DFT) | The M3GNet paper: lists as a limitation that the Materials Project DFT settings are looser than best practice [Ref. 12]Sourced | Not found | A model's error sits on top of the error in its training data |
The arrangement of the table is Our calculation (organisation). Numbers, titles and status were checked on the ISO pages (22 October 2026). The texts of the standards are paid, so we limit ourselves to titles and scope and do not state requirements.
Reading notes (for materials engineers)
- A benchmark ranking is not the same as strength on your own materials: the Matbench tasks are public data such as the Materials Project. Check whether your material system (composition, structure, measurement conditions) falls within the range of those data [Ref. 2]
- Distinguish prediction from experimental confirmation: GNoME's roughly 2.2 million are DFT predictions and 736 are matches with existing experimental reports. Check which of the two the word "discovery" refers to [Ref. 3]
- Most ISO/IEC standards are recommendations or frameworks: they generally gain binding force only when cited in laws or contracts (commentary). They do not guarantee the accuracy of a GNN [Refs. 18, 19]
14. Glossary
- Graph
- A diagram of dots (nodes) and lines (edges) showing connections. Not a line chart.
- Node / edge
- The dots and lines of a graph. In materials, atoms are nodes and bonds or nearby atom pairs are edges.
- Feature vector
- The list of numbers attached to a node or edge, made from element type or distance.
- Cutoff radius
- The distance that decides which atoms are linked. Like the radius of a magnifying glass.
- Periodic boundary conditions
- The convention that expresses a crystal's repetition: atoms are also related to copies outside the cell.
- Message passing
- The operation in which an atom receives information from neighbours and updates its own numbers.
- Readout (pooling)
- Combining the numbers of all atoms into one to give a value for the whole crystal, for example by averaging.
- Weights
- The knobs inside a neural network, tuned on data.
- MAE (mean absolute error)
- The average of the absolute differences between prediction and answer. Smaller means closer.
- Training / validation / test
- Training sets the weights, validation chooses settings, and the test measures the final score.
- DFT (density functional theory)
- A physics simulation that computes properties from the behaviour of electrons. It contains approximations.
- Formation energy
- The energy change when a compound forms from its elements. A guide to stability.
- Convex hull / energy above hull
- The lower boundary connecting the most stable combinations for a set of elements. Closer to 0 means calculated to be more stable. A value at 0 K from DFT.
- MPNN
- A general framework for message passing. Many GNNs can be written in this form.
- CGCNN
- Crystal graph convolutional neural network, a representative GNN for crystals.
- MEGNet
- A GNN that adds a "global state" to nodes and edges. Works for both molecules and crystals.
- M3GNet / CHGNet
- Pretrained GNNs (interatomic potentials) that cover the whole periodic table.
- Invariant / equivariant
- The value does not change on rotation / the value rotates together with the system.
- E(3)
- All rotations, translations and reflections in 3-D space. E(3)-equivariant means equivariant to all of them.
- Over-smoothing
- Too many updates make every atom end up with similar numbers.
- Machine-learning interatomic potential (MLIP)
- A machine-learning model that gives energy and forces from the atomic arrangement.
- Matbench
- A test suite for predicting material properties (13 tasks), for comparing methods by the same procedure.
- Active learning
- Learning in which the model itself picks the next candidate to compute (or test).
15. References
- Xie T., Grossman J. C. "Crystal graph convolutional neural networks for an accurate and interpretable prediction of material properties", Phys. Rev. Lett. 120, 145301 (2018), DOI 10.1103/PhysRevLett.120.145301 — doi.org/10.1103/PhysRevLett.120.145301
- Dunn A. et al. "Benchmarking materials property prediction methods: the Matbench test set and Automatminer reference algorithm", npj Comput. Mater. 6, 138 (2020), DOI 10.1038/s41524-020-00406-3 — doi.org/10.1038/s41524-020-00406-3
- Merchant A. et al. "Scaling deep learning for materials discovery", Nature 624, 80–85 (2023), DOI 10.1038/s41586-023-06735-9 — doi.org/10.1038/s41586-023-06735-9
- Reiser P. et al. "Graph neural networks for materials science and chemistry", Commun. Mater. 3, 93 (2022), DOI 10.1038/s43246-022-00315-6 — doi.org/10.1038/s43246-022-00315-6
- Chen C. et al. "Graph networks as a universal machine learning framework for molecules and crystals", Chem. Mater. 31, 3564–3572 (2019), DOI 10.1021/acs.chemmater.9b01294 — doi.org/10.1021/acs.chemmater.9b01294
- Gilmer J. et al. "Neural message passing for quantum chemistry", Proc. Mach. Learn. Res. 70, 1263–1272 (2017), arXiv:1704.01212 — arxiv.org/abs/1704.01212
- Schütt K. T. et al. "SchNet: A continuous-filter convolutional neural network for modeling quantum interactions", Advances in Neural Information Processing Systems 30 (2017), arXiv:1706.08566 — arxiv.org/abs/1706.08566
- Duvenaud D. et al. "Convolutional networks on graphs for learning molecular fingerprints", Advances in Neural Information Processing Systems 28 (2015), arXiv:1509.09292 — arxiv.org/abs/1509.09292
- Choudhary K., DeCost B. "Atomistic line graph neural network for improved materials property predictions", npj Comput. Mater. 7, 185 (2021), DOI 10.1038/s41524-021-00650-1 — doi.org/10.1038/s41524-021-00650-1
- Batzner S. et al. "E(3)-equivariant graph neural networks for data-efficient and accurate interatomic potentials", Nat. Commun. 13, 2453 (2022), DOI 10.1038/s41467-022-29939-5 — doi.org/10.1038/s41467-022-29939-5
- Batatia I. et al. "MACE: Higher order equivariant message passing neural networks for fast and accurate force fields", arXiv:2206.07697 (2022) — arxiv.org/abs/2206.07697
- Chen C., Ong S. P. "A universal graph deep learning interatomic potential for the periodic table", Nat. Comput. Sci. 2, 718–728 (2022), DOI 10.1038/s43588-022-00349-3 — doi.org/10.1038/s43588-022-00349-3
- Deng B. et al. "CHGNet as a pretrained universal neural network potential for charge-informed atomistic modelling", Nat. Mach. Intell. 5, 1031–1041 (2023), DOI 10.1038/s42256-023-00716-3 — doi.org/10.1038/s42256-023-00716-3
- Riebesell J. et al. "A framework to evaluate machine learning crystal stability predictions", Nat. Mach. Intell. 7, 836–847 (2025), DOI 10.1038/s42256-025-01055-1 — doi.org/10.1038/s42256-025-01055-1
- Bartel C. J. et al. "A critical examination of compound stability predictions from machine-learned formation energies", npj Comput. Mater. 6, 97 (2020), DOI 10.1038/s41524-020-00362-y — doi.org/10.1038/s41524-020-00362-y
- Cheetham A. K., Seshadri R. "Artificial intelligence driving materials discovery? Perspective on the article: Scaling deep learning for materials discovery", Chem. Mater. 36, 3490–3495 (2024), DOI 10.1021/acs.chemmater.4c00643 — doi.org/10.1021/acs.chemmater.4c00643
- Choudhary K. et al. "JARVIS-Leaderboard: a large scale benchmark of materials design methods", npj Comput. Mater. 10, 93 (2024), DOI 10.1038/s41524-024-01259-w — doi.org/10.1038/s41524-024-01259-w
- ISO/IEC "ISO/IEC 22989:2022 Information technology — Artificial intelligence — Artificial intelligence concepts and terminology", (ISO page) — iso.org/standard/74296.html
- ISO/IEC "ISO/IEC 5259-1:2024 Artificial intelligence — Data quality for analytics and machine learning (ML) — Part 1: Overview, terminology, and examples", (ISO page) — iso.org/standard/81088.html
16. Claim-to-source audit
| Claim in the text | Basis | Category |
|---|---|---|
| Chemical graphs have been used since the 19th century; most GNNs for chemistry and materials fit the message-passing framework; about log n updates suffice to reach all atoms; over-smoothing and over-squashing; models using only distances and angles are rotation-invariant; the definition of equivariant models | Reference 4 https://doi.org/10.1038/s43246-022-00315-6 | Sourced |
| CGCNN: how the graph is built (6 Å search, Voronoi faces, covalent radii + 0.25 Å, 12 nearest neighbours work as well), the nine node properties, the gated update and the validation error 0.136 to 0.039 eV/atom, mean pooling, 46,744 crystals and 87 elements, random 60/20/20 split, formation-energy MAE 0.039 (28,046 training), band-gap MAE 0.388 (16,458 training), DFT-versus-experiment errors quoted in the paper, site-energy analysis of perovskites | Reference 1 https://doi.org/10.1103/PhysRevLett.120.145301 | Sourced |
| Duvenaud et al. applied convolutions to molecular graphs and generalised molecular fingerprints; Gilmer et al.'s message, update and readout framework, the 13 QM9 properties, about 110k training molecules with 10,000 each for validation and test (random), chemical accuracy on 11 of 13 targets (against DFT values), readout being permutation-invariant | Reference 8 https://arxiv.org/abs/1509.09292 Reference 6 https://arxiv.org/abs/1704.01212 | Sourced |
| SchNet: continuous filters, forces as derivatives of the energy, three interaction blocks, QM9 U₀ MAE of 0.31 kcal/mol (110,462 training molecules) | Reference 7 https://arxiv.org/abs/1706.08566 | Sourced |
| MEGNet: the added global state, only atomic number and distance for crystals, formation-energy MAE 0.028 (60,000 training) vs SchNet 0.035, band-gap MAE 0.33 (36,720 training), transfer of element embeddings, three-block models; 69,640 Materials Project crystals (retrieved 1 June 2018) | Reference 5 https://doi.org/10.1021/acs.chemmater.9b01294 | Sourced |
| ALIGNN: bond angles handled through a line graph, 52 properties, up to 85% better than some earlier GNNs (the authors' claim) | Reference 9 https://doi.org/10.1038/s41524-021-00650-1 | Sourced |
| NequIP: E(3)-equivariance, 133 structures vs 133,500 for DeepMD, better force errors but lower energy errors for DeepMD, the up-to-three-orders-of-magnitude claim, comparison with l=0, understanding still open, MD-17 and revised MD-17 | Reference 10 https://doi.org/10.1038/s41467-022-29939-5 | Sourced |
| MACE: an equivariant model with four-body messages that cuts the updates to two; matches or exceeds state-of-the-art accuracy on rMD17 and others (the authors' claim) | Reference 11 https://arxiv.org/abs/2206.07697 | Sourced |
| M3GNet: three-body terms, 89 elements, 5 Å and 4 Å cutoffs, training data (187,687 relaxation snapshots from 62,783 compounds), test MAE of 0.035 eV/atom, 0.072 eV/Å and 0.41 GPa, a 90/5/5 split by material, and the limitation that the DFT settings of the training data are looser than best practice | Reference 12 https://doi.org/10.1038/s43588-022-00349-3 | Sourced |
| CHGNet: pretrained on trajectories of about 1.5 million Materials Project structures, learns magnetic moments to carry charge information, applications such as Li diffusion | Reference 13 https://doi.org/10.1038/s42256-023-00716-3 | Sourced |
| Matbench: 13 tasks (312 to about 132k samples, 10 sources), Automatminer best on 8 of 13, crystal graph methods appear to outperform traditional ML at about 10⁴ or more data points; JARVIS-Leaderboard (1281 contributions, 274 benchmarks, 152 methods); Matbench Discovery (misalignment between regression and classification metrics, false positives near the boundary); Bartel et al. (regression accuracy vs stability classification) | Reference 2 https://doi.org/10.1038/s41524-020-00406-3 Reference 17 https://doi.org/10.1038/s41524-024-01259-w Reference 14 https://doi.org/10.1038/s42256-025-01055-1 Reference 15 https://doi.org/10.1038/s41524-020-00362-y | Sourced |
| GNoME: about 2.2 million structures stable vs earlier data, about 381,000 on the updated hull, 736 matching existing experimental reports, hit rates above 80% (structural) and 33% (compositional) after six rounds of active learning, final error of 11 meV/atom, PBE and r²SCAN checks (84% of binaries and ternaries with negative phase-separation energy), open problems listed by the authors (synthesizability and others), cutoffs of 4 Å (structural) and 5 Å (potentials) | Reference 3 https://doi.org/10.1038/s41586-023-06735-9 | Sourced |
| Cheetham and Seshadri: found scant evidence for compounds that satisfy novelty, credibility and utility in the GNoME report | Reference 16 https://doi.org/10.1021/acs.chemmater.4c00643 | Sourced |
| Number, title and July 2022 date of ISO/IEC 22989:2022; number, title and July 2024 date of ISO/IEC 5259-1:2024 | Reference 18 https://www.iso.org/standard/74296.html Reference 19 https://www.iso.org/standard/81088.html | Sourced |
| Values in the toy update example (A-B-C, rule: own value + 0.5 × mean of neighbours); atom counts within a radius in an fcc lattice with a = 4.2 Å (4 Å: 12, 5 Å: 18, 6 Å: 54, 10 Å: 224, 15 Å: 766) | our calculation (Python) | Our calculation |
| Detailed conditions of the ALIGNN comparison, comparisons of CHGNet and MACE figures with other models, same-condition comparisons between models, the individual matches behind the 736 GNoME structures, an international standard specific to GNNs | not confirmed in the primary sources we could access, so not stated (commentary) | commentary |
| The comparison table of descriptors vs GNNs, the reading that traditional methods stay competitive with little data, how to read results (error against DFT vs against experiment; possible leakage in random splits), and the materials-engineer notes | our own organisation and commentary based on the published content; not views stated by the research groups | commentary |
| Note on figure types: Figs 6, 7 include our calculation, Figs 2, 3, 4, 5, 8 are concept diagrams (vector drawings), and Figs 1, 9 are ImageGen-generated conceptual illustrations | a note by this article (commentary) | commentary |
Last updated: 22 October 2026. Sources are limited to primary material (peer-reviewed papers, arXiv papers, and the official pages of ISO and the Materials Project). The numerical examples (the toy update, atom counts in a lattice) are our own calculations, not results of real models or materials. We could not confirm the detailed conditions of the ALIGNN comparison, comparisons of CHGNet and MACE figures with other models, comparisons between models under identical conditions, the individual matches behind GNoME's 736 structures, or any international standard specific to GNNs, so we do not state them. All figures are concept diagrams or diagrams that include our own calculation; the ImageGen images are conceptual illustrations.