TECHNOLOGY EXPLAINER
Introduction to Materials Informatics
— Linking data, computation and experiment to find the treasure on a very large map
Materials informatics (MI) is a way of thinking, and a set of tools, that uses materials data and machine learning to narrow down what to try next. It does not mean that AI invents materials. What AI and computation produce are candidates; whether a candidate really has the property is known only after it has been made and measured. This article is written for materials engineers meeting MI for the first time. Through figures and small calculations it explains what MI is, forward and inverse problems, a short history, how computation, experiment and AI share the work, and what you can start doing today. It also sets the shared analogies and vocabulary used across this series.
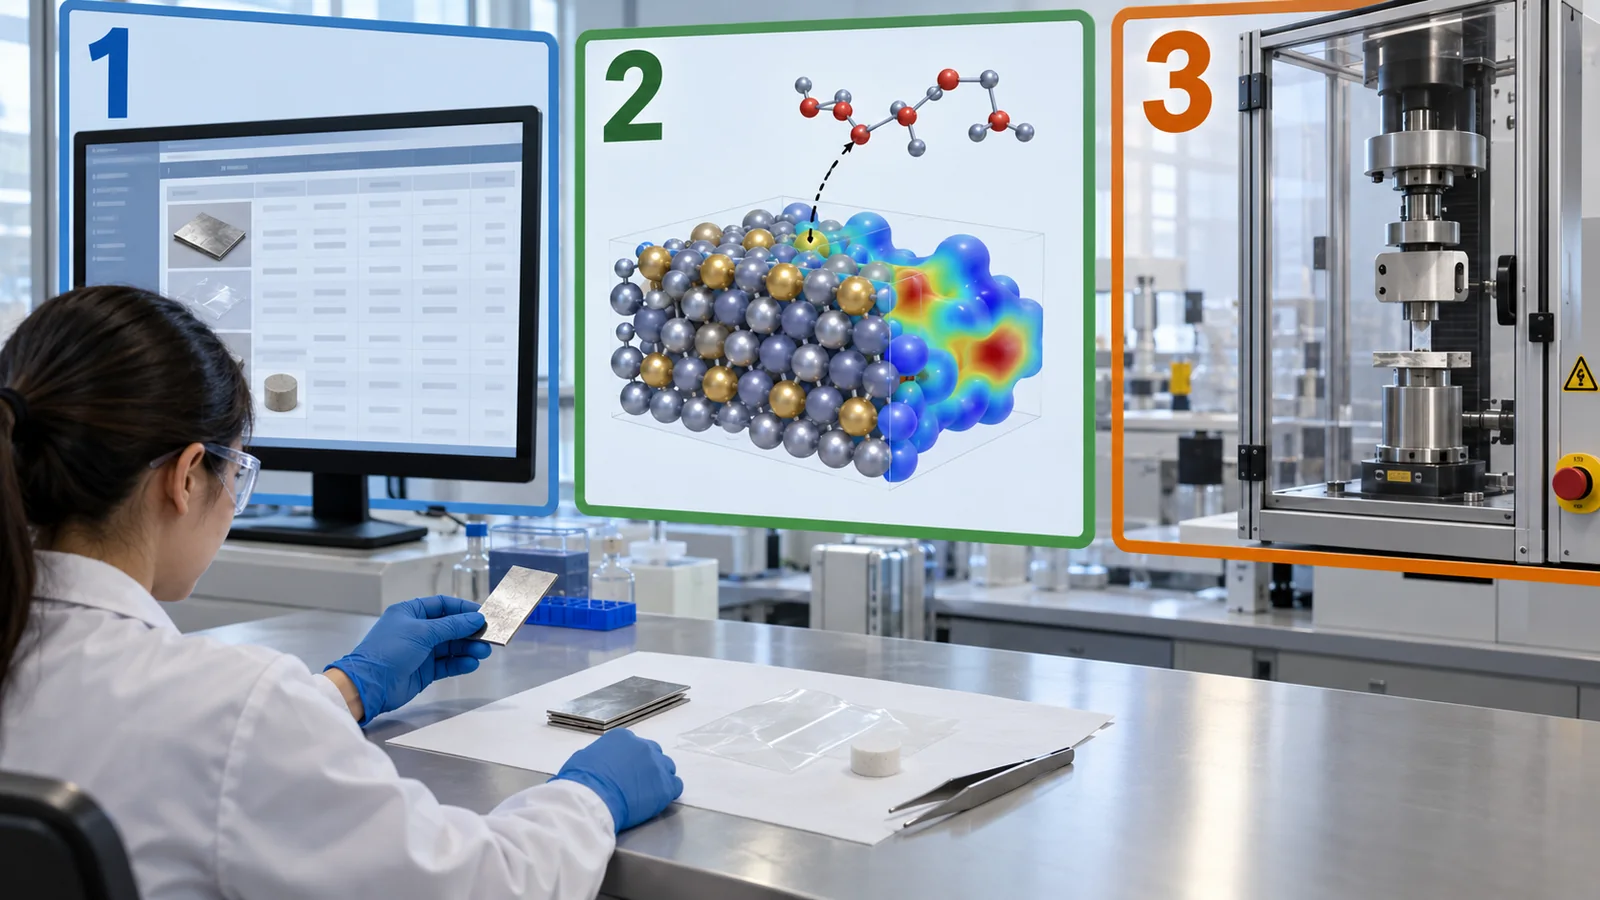
- Three-line summary, prerequisites, and where this fits in the series
- Searching for materials is a treasure hunt on a very large map
- What materials informatics (MI) is
- Forward and inverse problems
- How computation, experiment and AI share the work
- The basic flow of MI
- How much does it help? The effect of narrowing down
- A short history, and how to read “AI discovered new materials”
- What a materials engineer can do starting today
- Limits, what we could not confirm, and a summary
- How to read the yardsticks and standards
- Glossary
- References (primary sources)
- Claim-to-source audit
Sourced = stated in a published source (reference link given)
Our calculation = a value this article computed from stated assumptions
Not yet confirmed = plans, targets and other matters not yet settled
Our reading of what this means for materials research is labeled commentary. An Inference is shown in bold.
The “effect of narrowing down” (Chapter 7) is a calculation on synthetic data that we generated. It does not show the performance of any real material or product. This article uses no market-size estimates. Claims such as “AI discovered new materials” are read by separating who is saying it, and by what criterion (Chapter 8). For ISO/IEC standards we only checked the number, title and publication date; we have not read the full text.
1. Three-line summary, prerequisites, and where this fits in the series
- MI is a tool for narrowing down what to try next. It turns a material's composition, structure and process into numbers (descriptors), learns trends from past data with machine learning, and narrows where to look. It handles both the “forward problem” (predict properties from a material) and the “inverse problem” (find a material from the properties you want)
- Computation, experiment and AI share the work. Computation (DFT and the like) “produces candidates cheaply and fast,” experiment “checks whether it is really true,” and AI “narrows where to look.” The three form a loop connected by data
- The one point to remember: a prediction, or a computed stability, is a candidate, not a discovery. Only after a material has been made, measured and reproduced can its property be treated as a fact
Basic knowledge of chemistry, materials or process engineering is enough. You do not need machine learning or programming. New terms are explained where they first appear. We use almost no equations; when we do, we explain the meaning in words and check it with a numerical example. If you get lost, go back to the glossary in Chapter 12.
This is the entry article of our series on materials informatics. It sets the vocabulary and analogies shared across the series. The next articles cover materials data and descriptors, materials databases and the FAIR principles, machine learning with small data, and uncertainty and applicability domain, in that order. Beyond those, graph neural networks, Bayesian optimization, machine-learning interatomic potentials, self-driving laboratories and other topics have their own explainers. Each article is written to be readable on its own.
2. Searching for materials is a treasure hunt on a very large map
(1) An analogy: looking for the treasure
Think of the search for a new material as looking for treasure on a very large map. The map is the whole set of candidate materials. The treasure is a material with the property you want. Digging one spot (one synthesis and measurement) costs time and money. The map is so large that you cannot dig everywhere.
How large is the map? Davies and colleagues estimated that, taking the first 103 elements of the periodic table, the number of four-component compounds, counting the element ratios as well, exceeds one trillion (1012). If you then remove chemically implausible compositions using valency and electronegativity (a rough measure of how strongly an atom pulls electrons), about ten billion (1010) remainSourced [Ref. 4].
To get a feel for ten billion, suppose we test them all at one per day and simply divide: 1010 ÷ 365.25 ≈ 27 million years (Our calculation). Even at one per hour without a break it takes about 1.1 million years, and even a high-throughput setup (making and measuring many samples in parallel) at 1,000 per day would take about 27,000 years. This is what the right-hand side of Fig. 2 shows.
Our calculation. The figure of 1010 is the estimate of Davies et al. [Ref. 4]; the division is ours. It ignores success rates, labor and the number of instruments, and is only meant to convey orders of magnitude.
Ten billion is an estimate based on counting element combinations and ratios; it is not the number of materials that actually exist. In real materials, the property depends not only on which composition but also on how it is made (temperature, time, atmosphere, purity of raw materials). So the map has a second dimension besides “place”: “how you dig.” When this series says “where to look,” it means the space of conditions that combines composition, structure and process (commentary).
(2) Time: 10 to 20 years before a new material is used
The other barrier is time. The white paper on the Materials Genome Initiative (MGI), issued by the U.S. National Science and Technology Council in June 2011, says it takes typically about 10 to 20 years for a new class of materials to move from initial research to first use. As an example it cites the lithium-ion battery, which took 20 years from a laboratory concept proposed in the mid-1970s to wide use in the late 1990sSourced [Ref. 1]. The current MGI website says it “can take 20 or more years” to move a material from discovery to marketSourced [Ref. 3].
The white paper names, as one reason for the slowness, continued reliance on scientific intuition and trial-and-error experiments. It also notes that the seven stages a material passes through on the way to market are handled by different teams, often at different organizations, with few chances for feedback between stages [Ref. 1]. Against this, MGI aims to discover, develop, manufacture and deploy advanced materials at least twice as fast, at a fraction of the costSourced [Ref. 1]. That is a target; whether it has been achieved is a separate question (Chapter 10).
3. What materials informatics (MI) is
Materials informatics (MI) combines materials science with information science, which handles data, to speed up materials research and development. The review by Ramprasad and colleagues describes its central method as follows: build “surrogate” machine-learning models that predict quickly, based purely on past data. A material is usually first expressed as a set of numbers (a fingerprint; in this series, a descriptor), and a mapping learned from data links it to the property of interestSourced [Ref. 5].
Here are the three terms that just appeared, in the wording we use throughout the series.
- Machine learning = an approximator that learns trends from past data. It fits the relation between inputs and outputs, in the form of a formula, to the data. Limit of the analogy: it is weak outside the range of the data (extrapolation), and it does not understand physical laws
- Descriptor = a “business card” for a material, written in numbers. It turns composition, structure and process into values a machine can read (the next article, on materials data and descriptors, covers it in detail)
- DFT (density functional theory) = a physics simulation that calculates a material's properties from the behavior of its electrons. It contains approximations and does not necessarily agree with measurements (see our explainers on quantum chemistry and materials simulation, and on the fundamentals of density functional theory)
Agrawal and Choudhary discuss the search for materials in large datasets as part of the “fourth paradigm” of science (data-driven discovery), after experiment, theory and computation, and present examples of MI as “forward models” that predict properties and “inverse models” that find candidate materialsSourced [Ref. 6]. MI can be seen as the field that applies this idea to materials (commentary).
That is not accurate. What machine learning does is learn trends from existing data and narrow down which candidates look promising. Whether a candidate can really be made and shows the intended property is checked by people and experiments. Ramprasad et al. also say that predictions are “typically interpolative,” and that extrapolating into new regions of materials space requires that prediction uncertainties be properly taken into account [Ref. 5]. A phrase like “AI discovered tens of thousands of new materials” often refers to computational predictions, which are different from experimental confirmation (Chapter 8).
4. Forward and inverse problems
The questions of MI come in two directions. The forward problem asks: “For this material (composition, structure, process), what will the properties be?” The inverse problem asks: “I want this property. What material should I make?”
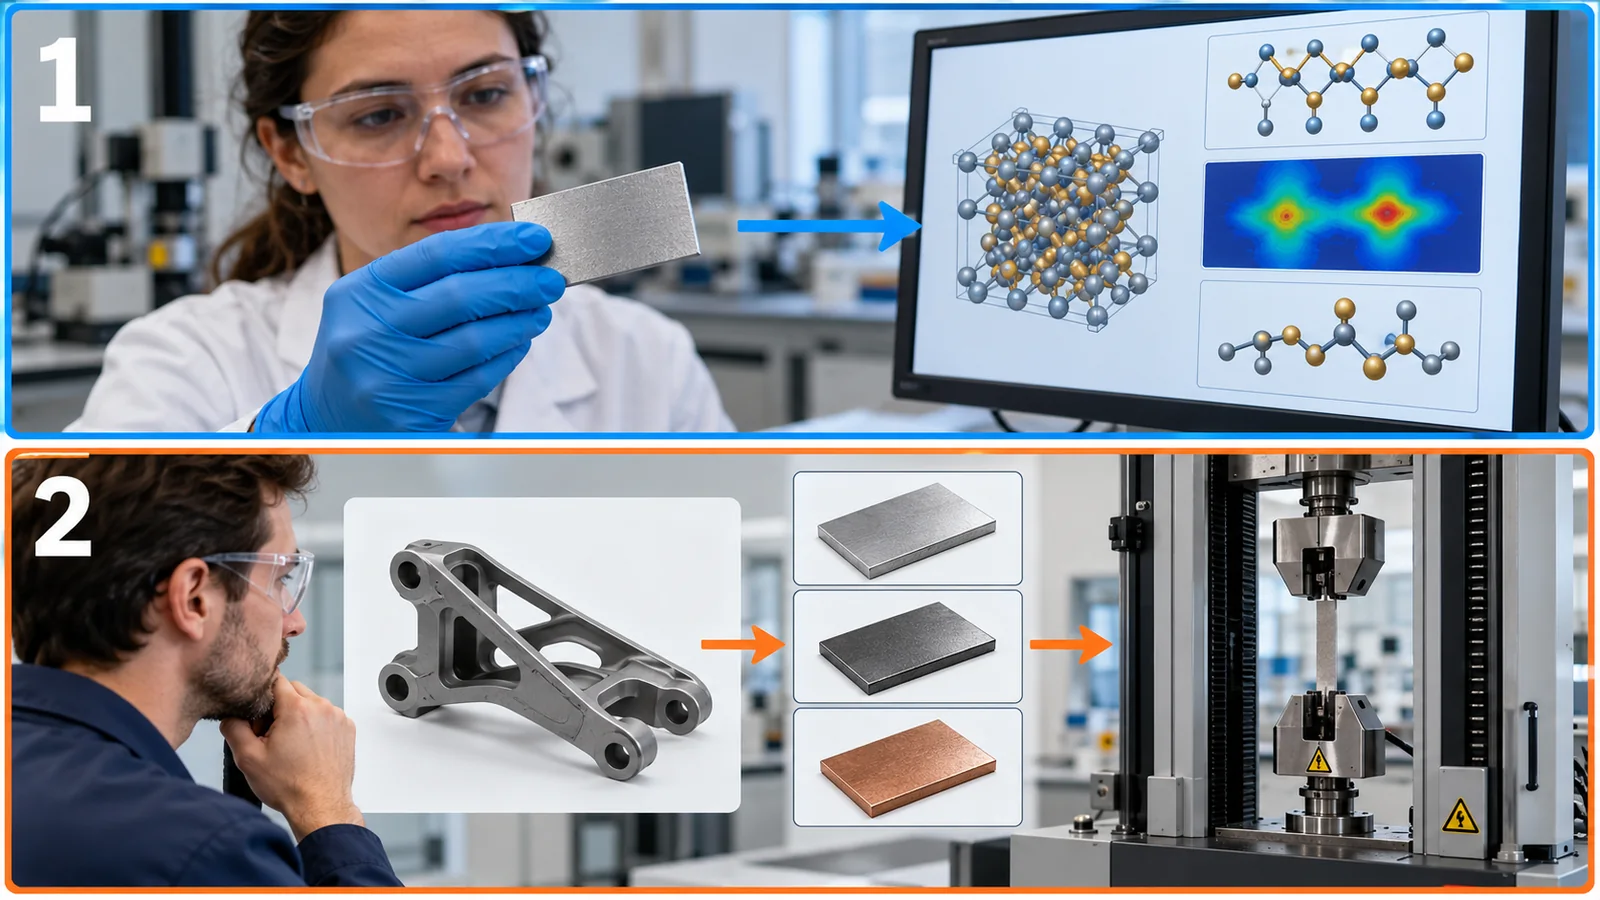
View original SVG, values and sources
Original SVG reference: Conceptual diagram (vector drawing). Left: the directions of the forward and inverse problems. Right: a made-up case where the property rises and falls, so two conditions reach the target (dotted line). Real materials, with combinations of composition, structure and process, can have many more answers.
The inverse problem is harder because the answer is not unique. In the figure on the right, for a material variable whose property rises and then falls, two conditions satisfy the same target property. For real materials, combinations of composition, structure and process can give many more answers, or none at all (commentary).
Zunger discusses inverse design as a new style of collaboration between theory and experiment: declare the desired functionality first, use theoretical calculations to predict which stable and synthesizable compounds show it, and improve the predictions through repeated cycles of prediction, synthesis and characterizationSourced [Ref. 7]. Sanchez-Lengeling and Aspuru-Guzik review “inverse design” of molecules with desired properties using generative machine-learning models [Ref. 8] (generative models are covered in our explainer on generative AI for materials design).
In practice, the inverse problem is often used as follows: evaluate many candidates with a forward predictor and keep those close to the target (commentary). These are the three steps at the lower left of the figure. In other words, a material does not come straight out of the property you want; you cheaply evaluate many candidates and narrow them down. Making and measuring the survivors cannot be skipped.
5. How computation, experiment and AI share the work
MI does not stand on AI alone. Computation, experiment and AI each take on what they do best.
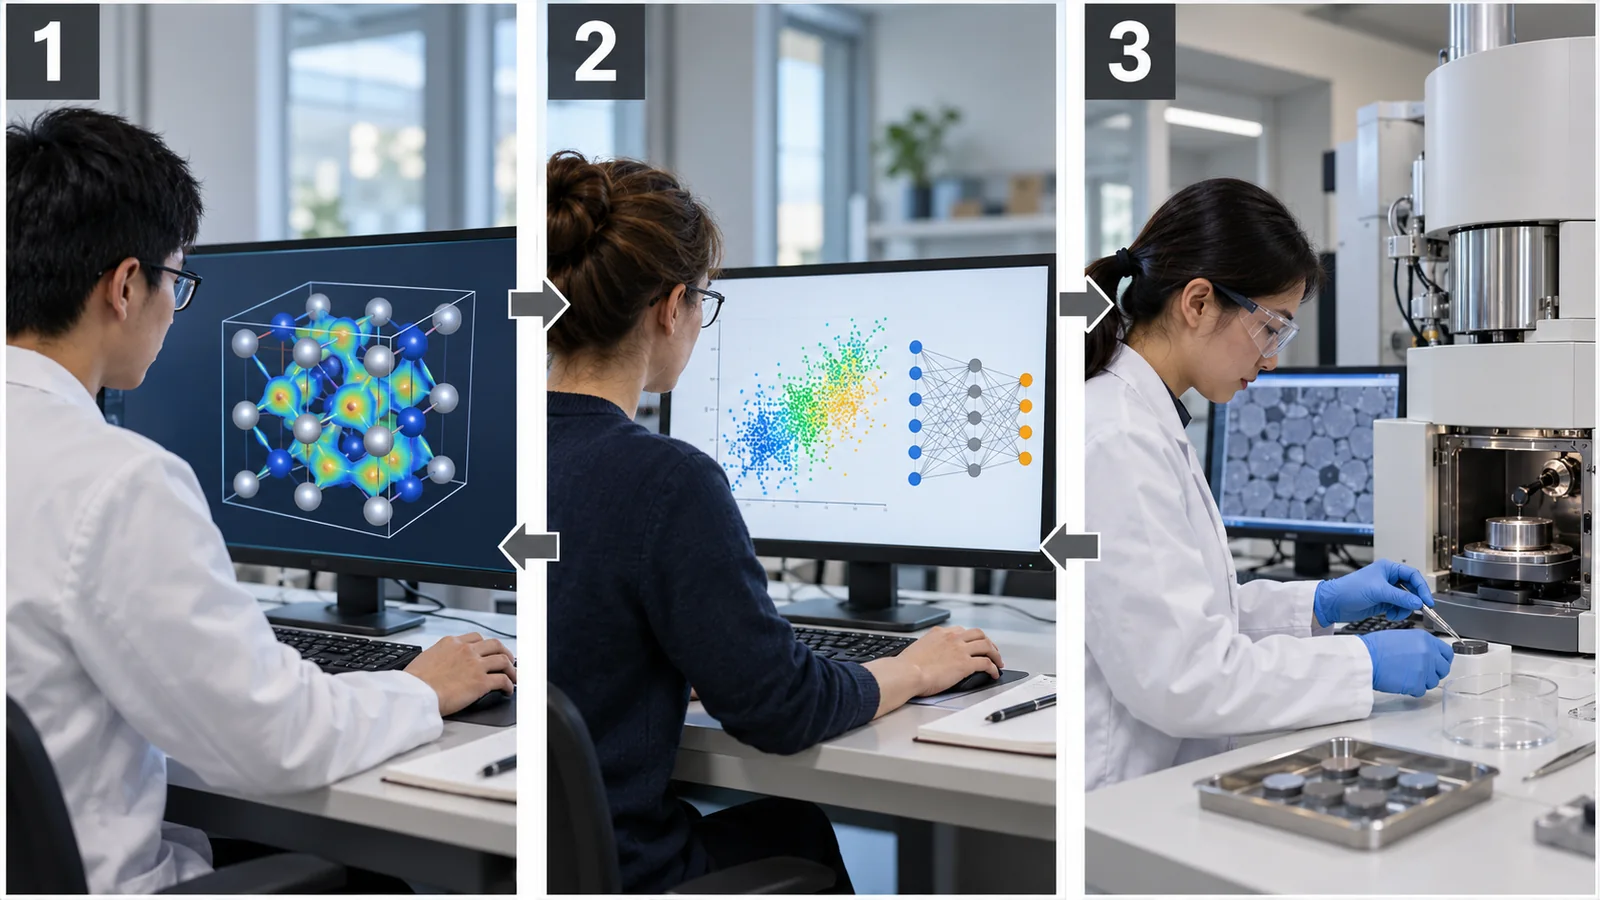
View original SVG, values and sources
Original SVG reference: Conceptual diagram (vector drawing). Roles of computation, experiment and AI. Arrows show where candidates and data travel; this is our summary, not the setup of a particular lab.
| Role | Strength | Weakness | Examples in materials work (commentary) |
|---|---|---|---|
| Computation (DFT and the like) | Estimates the properties of many candidates faster and more cheaply than experiment | Contains approximations. Does not necessarily match measurements | Crystal stability, electronic states, energies |
| Experiment (making and measuring) | Checks on real samples whether it is really so | Slow and costly, with few samples. Also has scatter | Synthesis, forming, measurement, durability tests |
| AI (machine learning) | Learns trends from past data and narrows where to look | Weak outside the range of the data. Reasons are sometimes hard to explain | Ranking candidates to try next; fast stand-ins for calculations |
This table is our own commentary. Each row describes a general tendency and does not apply to every method.
Let us look at “computation does not necessarily match measurement” in numbers. The paper on the Open Quantum Materials Database (OQMD) compares DFT-calculated formation energies (the energy change when a compound forms from its elements) with measured values for 1,670 compounds. The mean absolute error is 0.096 eV/atom. It also finds that the mean absolute error between experiments (different reports measuring the same compound) is 0.082 eV/atom, a “surprisingly large” value, and argues that a significant fraction of the error between DFT and experiment may be attributed to experimental uncertaintySourced [Ref. 9].
In MI, the greatest value a materials engineer adds is the quality of the experiments. The “correct data” used to train and check both AI and computation ultimately comes from experiments. As the OQMD example shows, even experiments can differ among themselves by about 0.08 eV/atom (for the formation energy of compounds). If you do not know the scatter of repeated measurements of one sample, lot-to-lot differences, and differences between instruments and operators, you cannot even tell whether a model was right or wrong (commentary).
The job ahead is not “leave calculations to AI and plan experiments by hand.” It is deciding, for each material and goal, what to give to computation, what to AI, and what to experiment.
6. The basic flow of MI
MI work divides roughly into six steps. Here is what each one does, briefly. Fig. 6 also shows which article in this series covers each step in more detail.
- Define the goal. Write in one line which property you want to know, in what range, with what accuracy, and by when. If the goal is vague, nothing after it can be decided
- Collect data. Gather it from your own laboratory notebooks and measurements, and from public databases (our explainer on materials databases and the FAIR principles)
- Turn it into numbers. Convert each material into a descriptor (a business card) and line them up in a table, one row per sample (our explainer on materials data and descriptors)
- Build a model. Build a predictor that learns trends from the data. Materials data are often scarce, so overfitting (memorizing random fluctuations) needs care (our explainer on machine learning with small data)
- Predict, with uncertainty. Look not only at the predicted value but also at how far to trust it (our explainer on uncertainty and applicability domain)
- Check by experiment. Make and measure the candidates you narrowed down. The results return as new data to step 2 (our explainers on Bayesian optimization and active learning, and on self-driving laboratories)
7. How much does it help? The effect of narrowing down
How much do you gain by “narrowing where to look”? A small numerical experiment answers this (Our calculation).
- Setup. There are 10,000 candidates, and the truly good ones (true property in the top 1%, that is 100) count as “hits.” You can only test 100
- Picking 100 at random. The expected number of hits is 100 × 1% = 1
- Narrowing by prediction. A predictor gives each candidate a score. Call the correlation between this score and the true value ρ (rho). ρ is a number between 0 and 1; the closer to 1, the more closely the ranking by score follows the ranking by true value. We pick the top 100 by score and count how many hits it contains (average of 500 trials)
The results are in Fig. 7. With a useless predictor, ρ = 0, there are about 1.1 hits, the same as picking at random. At ρ = 0.5 there are about 12.9, and at ρ = 0.9 about 54.2. If you can test only 20, the random expectation is 0.2 hits; ρ = 0.5 gives about 3.9 and ρ = 0.9 about 17.1.
Our calculation. Synthetic data (true property normally distributed; the prediction score is a random number with correlation ρ to the true value). These are not data on real materials. The calculation assumes that the quality of prediction (ρ) holds for new candidates.
What you want is to find the ones at the top, not to predict every value accurately. If the ranking is roughly right, hits gather near the top. Real studies report a similar tendency. Ling and colleagues, optimizing composition and processing, report that using experiments proposed by a machine-learning model found the optimal candidate with on average three times fewer measurements than random guessing (results over four materials-science test cases)Sourced [Ref. 10].
However, this numerical experiment assumes that the quality of prediction holds for new candidates. That may fail outside the range of the data. Our explainer on uncertainty and applicability domain takes this up.
That is wrong. Li and colleagues showed, for several large materials datasets, that up to 95% of the data could be removed from training with little effect on predictions for materials within the range seen in training (in-distribution). The removable data were tied to over-represented material types, and removing them did not prevent the severe degradation on out-of-distribution samplesSourced [Ref. 11]. What matters is not only the amount of data but also its quality, bias, how it is split, and information richness. Our explainers on materials data and descriptors, and on machine learning with small data, cover this.
8. A short history, and how to read “AI discovered new materials”
Here is a timeline of MI, limited to what we could confirm in papers and official documents (Fig. 8).
Three currents can be read from the timeline (commentary). (1) Policy. In 2011 the MGI put data sharing and computation at the center of materials development. The 2021 strategic plan sets three goals for the next five years: unify the Materials Innovation Infrastructure, harness the power of materials data, and educate and train the workforce [Ref. 2]. (2) Data infrastructure. In 2012–13, AFLOW [Ref. 16], the Materials Project [Ref. 17] and OQMD [Ref. 18] were published, making DFT-computed materials data widely usable (see our explainer on materials databases and the FAIR principles). (3) Evaluation. Since 2020, frameworks that compare methods under common conditions have emerged, such as Matbench [Ref. 22] and Matbench Discovery [Ref. 23] (Chapter 11).
(1) A case: how to read “2.2 million structures”
One study often reported as “AI discovered new materials” is GNoME (Graph Networks for Materials Exploration) by Merchant et al. The abstract says that graph neural networks (AI that takes the connections between atoms as input) trained at scale enabled the discovery of 2.2 million structures below the convex hull of previously known stable crystals (the energy boundary of stability). The same abstract says that, of the stable structures, 736 have already been independently experimentally realizedSourced [Ref. 12].
On the other hand, Cheetham and Seshadri examined the claims of that paper in a perspective in Chemistry of Materials. They write that they find “scant evidence for compounds that fulfill the trifecta of novelty, credibility, and utility.” They also say the methods appear to hold promise and that there is a great need to incorporate domain expertise in materials synthesis and crystallographySourced [Ref. 13].
What both documents show is that “predicted,” “synthesized” and “confirmed useful” are different stages. “AI discovered 2.2 million new materials” is the number of computational predictions in the paper. It does not mean that 2.2 million new materials were made. When you read such claims as a materials engineer, check these three things separately (commentary).
- Prediction stage. Who calls it a “discovery,” and by what criterion (which calculation, which definition of stability)?
- Synthesis and confirmation stage. How many were actually synthesized, how the structures were verified, and whether there is independent verification
- Usefulness stage. Does the material show the property you want under real conditions of use?
9. What a materials engineer can do starting today
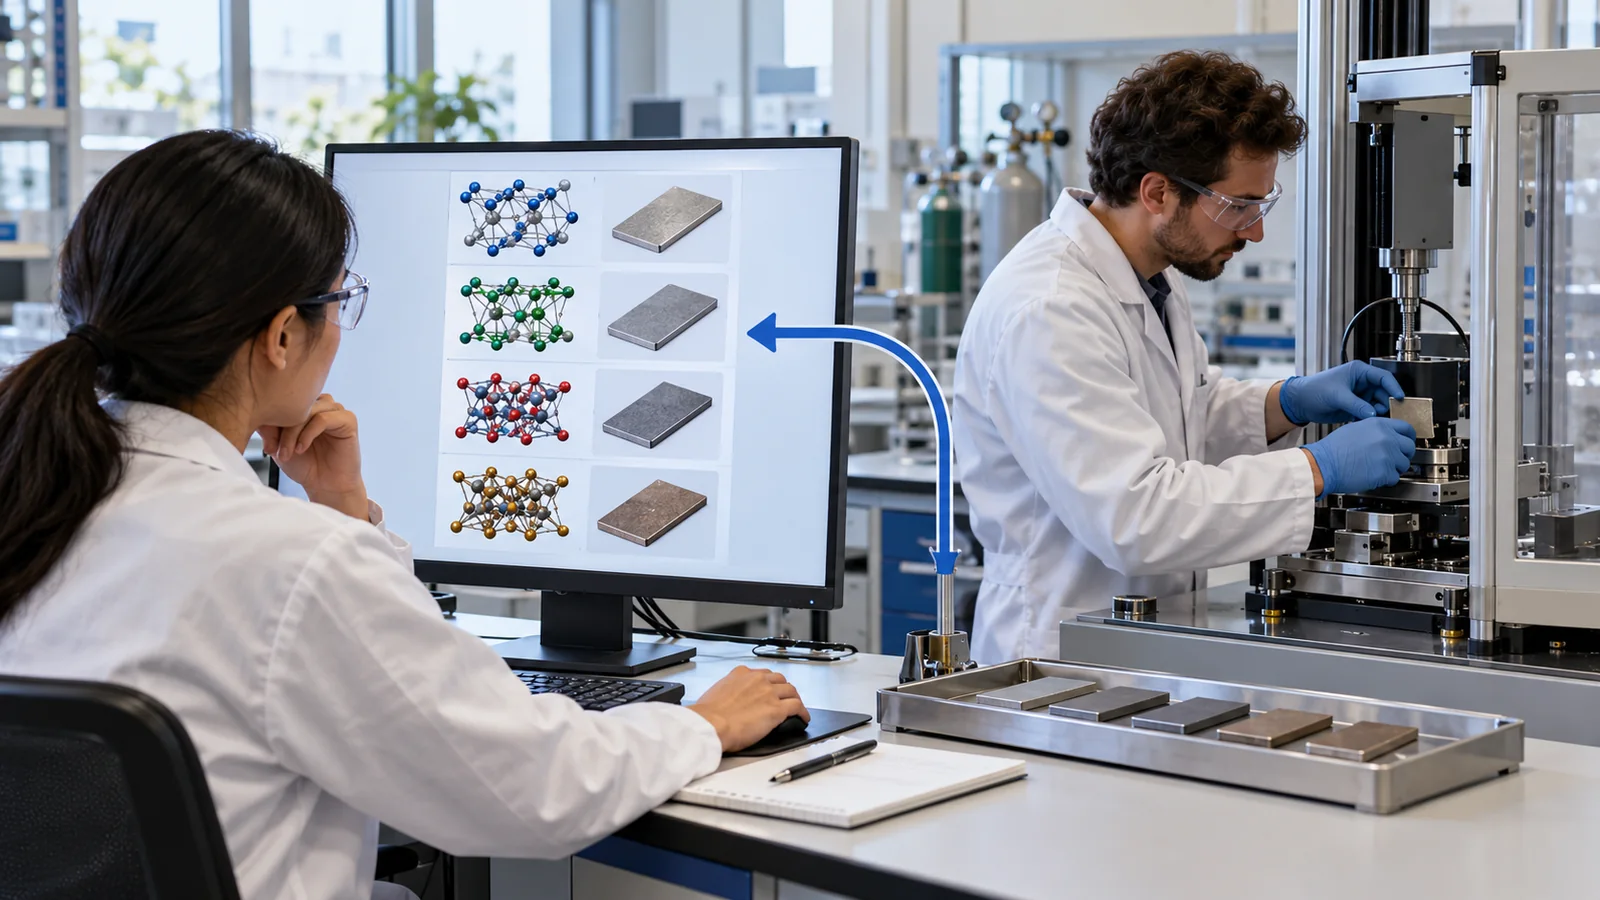
You can start MI without installing a large system; start by organizing your own data. These six things can be done by a materials engineer today (commentary).
| What to do | Why it matters | First step |
|---|---|---|
| 1. Write the goal in one line | If the goal is vague, neither the data to collect nor the way to evaluate can be decided | Write which property, in what range, how many, and with what accuracy |
| 2. Turn lab notebooks into a one-row-per-sample table | Machines read tables. Text and photos alone cannot be turned into numbers | Columns for composition, process conditions, measured values, units, date, lot, instrument and person |
| 3. Keep failed and missed results too | “Conditions that did not work” show the boundary. Raccuglia et al. report that a machine-learning model trained on records of failed reactions predicted reaction outcomes more accurately than human intuition [Ref. 20]Sourced | Do not leave cells blank; write a reason such as “failed” or “below detection limit” |
| 4. Learn the measurement scatter first | A model's error cannot fall below the scatter of the measurement. In the OQMD example, experiments disagreed among themselves by 0.082 eV/atom [Ref. 9] | Measure one sample repeatedly, and look at lot-to-lot and instrument-to-instrument differences |
| 5. Compare with a simple baseline | A complicated model's number alone does not tell you whether it is good | Compare with “the average of all data” and “the value of the closest past sample” (see our explainer on the basics of machine learning and neural networks) |
| 6. Start small and check by experiment | A prediction is a candidate, not a discovery | Make and measure a few narrowed-down candidates, with controls (reference samples) and repeats |
This table is our own commentary. The Raccuglia et al. study in row 3 concerned hydrothermal synthesis of vanadium selenites (records from laboratory notebooks) and does not necessarily carry over to other materials.
Easy to leave to AI: ranking large numbers of candidates, extracting trends from measurement data, and analysis with many repetitions. Needing an expert's judgment: whether a candidate is chemically sensible, whether it can be synthesized (raw materials, atmosphere, temperature), whether impurities, grain boundaries and surfaces can be ignored, and whether the property matters for the product's requirements. These are often not yet written in the data and call on materials knowledge. Cheetham and Seshadri also point to the need to bring in domain expertise in synthesis and crystallography [Ref. 13].
Design the experiment that checks a prediction as a design for checking. Concretely: (1) a control, measuring a known reference sample under the same conditions; (2) repetition, making the same conditions several times in different lots; (3) something close to blinding, having someone who does not know the prediction do the measurement (when possible); (4) recording failures, because the conditions where the prediction missed are what the next round of learning needs. Even when the prediction is right, a single success is not a reproduced fact. See also “how to read experimental confirmation” in Chapter 11 (commentary).
10. Limits, what we could not confirm, and a summary
(1) What we could not confirm
- Origin of the term. We only checked the bibliographic details of Rajan's paper “Materials informatics” (Materials Today, 2005) and did not read the full text. We did not confirm whether it is the first use of the term
- Progress of MGI. The 2021 strategic plan says the MGI approach has already led to accelerated deployment of advanced materials “in select applications” [Ref. 2]. We did not confirm whether the whole target of twice the speed at a fraction of the cost has been met. Strategies of countries other than the U.S. are covered in our explainer on national MI strategies and data infrastructure
- Time figures. “10 to 20 years” and “20 or more years” are statements in MGI documents [Refs. 1, 3]. They vary widely by material and application, and we did not verify them independently
- GNoME. We do not assess the novelty or usefulness of the predicted structures. We set the claims of the paper [Ref. 12] and the perspective [Ref. 13] side by side
- Efforts in Japan. Domestic activity such as NIMS is outside the scope we checked here (other explainers cover it)
- Text of standards. For ISO/IEC standards we only checked number, title and publication date, not the full text
- An MI-specific international standard. We could not confirm one (Chapter 11)
- Numerical experiments. The calculations in Chapters 2 and 7 are a plain division and synthetic data. They do not show how well predictions would work for real materials
- MI tackles the problem of far too many candidate materials by narrowing where to look. Four-component combinations of 103 elements exceed a trillion; even after chemical filtering about ten billion remainSourced. At one per day, that is about 27 million yearsOur calculation
- The forward problem is “material → property”; the inverse problem is “property → material.” In practice, many candidates are evaluated with a forward predictor, narrowed down and then tested
- Computation produces candidates cheaply and fast, experiment checks, and AI narrows. None is all-powerful: in one example the DFT-versus-experiment error is 0.096 eV/atom and even experiments differ among themselves by 0.082 eV/atomSourced
- A prediction is a candidate. “Predicted,” “synthesized” and “confirmed useful” are separate stages; for GNoME, both the claims and an examination of them have been publishedSourced
- What you can do starting today: write the goal, build a one-row-per-sample table, keep failures, learn the scatter, compare with a simple baseline, and design experiments for checking
11. How to read the yardsticks and standards
How good MI is depends on which yardstick you use. The typical yardsticks are prediction error (MAE, mean absolute error; RMSE; R²), how the data were split (randomly, or by composition or time), benchmarks (rankings on common tasks), the difference between computation and measurement, and the success rate and reproducibility of experimental confirmation. Each one needs care about what it measures and what it does not. For example, a small prediction error does not mean the model is right outside the range of its training data. The table below lists the benchmarks and the standards and principles related to MI that we could confirm (checked 22 October 2026). We could not confirm an international standard specific to MI.
| What is evaluated | Representative benchmark or evaluation method (name, source) | Standard or guideline (ISO/IEC, NIST, international principles, etc.) | Cautions in reading |
|---|---|---|---|
| Accuracy of materials-property prediction | Matbench: 13 tasks. Dunn et al. (2020) [Ref. 22]Sourced | Could not be confirmed (no MI-specific international standard found) | Numbers from random splits can overstate performance on new materials (see our explainer on the basics of machine learning and neural networks) |
| Ability to find stable crystals | Matbench Discovery: a framework that evaluates machine-learning energy models as pre-filters in a search for stable crystals; it points out a misalignment between common regression metrics and task-relevant classification metrics (Riebesell et al., 2025) [Ref. 23]Sourced | Could not be confirmed | Even an accurate regressor can show more false positives near the stability boundary (0 eV/atom) |
| Cross-method comparison and reproducibility | JARVIS-Leaderboard: covers AI, electronic-structure calculations, force fields, quantum computation and experiments. At the time of the paper, 274 benchmarks and 1,281 contributions (Choudhary et al., 2024) [Ref. 24]Sourced | Could not be confirmed | A benchmark ranking differs from performance on your material. Check the differences in data, splits and metrics |
| Difference between computation and measurement | OQMD: for formation energies of 1,670 compounds, mean absolute error DFT versus experiment 0.096 eV/atom, experiment versus experiment 0.082 eV/atom (Kirklin et al., 2015) [Ref. 9]Sourced | Could not be confirmed | Do not treat computed values as measured values. Scatter on the experimental side also contributes to the difference |
| Data sharing and reuse | — (a principle, not an evaluation) | FAIR principles (Wilkinson et al., 2016): fifteen principles for making data findable, accessible, interoperable and reusable [Ref. 19]Sourced | FAIR is a set of principles, not a standard specification. It is also not the same as making data open |
| International alignment of measurements | — | VAMAS (Versailles Project on Advanced Materials and Standards): a framework for international collaborative projects that provide the technical basis for harmonized measurements, testing, specifications and standards [Ref. 25]Sourced | Not an MI-specific standard. Standards for individual test methods must be checked separately for each material |
| AI concepts and framework | — | ISO/IEC 22989:2022 (AI concepts and terminology, July 2022) [Ref. 26]; ISO/IEC 23053:2022 (framework for AI systems using machine learning, June 2022) [Ref. 27]Sourced | Standards for terms and frameworks. They do not guarantee that a materials prediction will be right. Full text not read |
| Quality of training data | Could not be confirmed (we found no common benchmark for the quality of materials datasets) | ISO/IEC 5259-1:2024 (data quality: overview, terminology and examples) [Ref. 28]; ISO/IEC 5259-3:2024 (data quality management requirements and guidelines) [Ref. 29] (both July 2024)Sourced | Data quality for analytics and machine learning in general. They do not set specific quality criteria for materials data. Full text not read |
| Risk management and operation | — | ISO/IEC 42001:2023 (AI management systems, December 2023) [Ref. 30]; NIST AI RMF 1.0 (NIST AI 100-1) [Ref. 31]Sourced | NIST AI RMF is meant for voluntary use. ISO/IEC standards generally bind only when cited in law or contracts (commentary) |
| Progress of policy | — | MGI Strategic Plan (2021 edition): sets three goals as a plan for the next five years [Ref. 2]SourcedNot yet confirmed | A plan is not an achievement. We did not confirm the state of achievement |
The arrangement of the table is Our calculation (organization). ISO/IEC numbers, titles and dates were checked on the official ISO pages (22 October 2026). Standard texts are paywalled, so we checked only titles and dates and wrote no requirements.
Cautions in reading (for materials engineers)
- A benchmark ranking differs from performance on your material. A benchmark is a ranking for specific data, splits and metrics. When you use it for your material, measure again on your data, with a split that matches your purpose
- Separate “prediction” from “experimental confirmation.” A small prediction error is not the same as a property confirmed by synthesis. For experimental confirmation, look at the number of samples, the definition of success, reproduction, and whether anyone verified it independently
- Data leakage and the split trap. If samples of the same series fall in both training and evaluation, the number is overstated (see our explainer on the basics of machine learning and neural networks)
- Most principles and standards are recommendations. The FAIR principles and the NIST AI RMF are guidance without legal force. When something says “compliant,” check which requirement of which document is meant
- A plan is not an achievement. MGI's target of twice the speed is a target. Evidence of achievement has to be checked separately
12. Glossary
- Materials informatics (MI)
- Combining materials science and data science to speed up the search for and development of materials.
- Forward problem
- Predicting properties from a material (composition, structure, process).
- Inverse problem (inverse design)
- Proposing a material from the properties you want. There may be several answers, or none.
- Machine learning
- An approximator that learns trends from past data. Weak outside the data (extrapolation).
- Descriptor (fingerprint)
- A “business card” of a material in numbers: composition, structure and process turned into values.
- Surrogate model
- A model that predicts quickly from past data in place of costly calculations or experiments.
- DFT (density functional theory)
- A physics simulation that calculates material properties from electron behavior. Contains approximations.
- Formation energy
- The energy change when a compound forms from its elements. A guide to stability.
- Convex hull
- The boundary of energetically stable combinations. Anything above it can decompose into a more stable combination.
- Interpolation / extrapolation
- Predicting inside / outside the range of the training data. Extrapolation is less likely to be right.
- Overfitting
- Memorizing random fluctuations and then failing on new data.
- Correlation (ρ)
- A number from 0 to 1 (or −1 to 1) for how closely two values rank alike. Closer to 1 means closer.
- Mean absolute error (MAE)
- The average of the absolute differences between prediction and truth. Same unit as the quantity.
- High throughput
- Running many calculations or experiments automatically in parallel.
- Benchmark
- A common task, dataset and metric for comparing methods.
- Baseline
- A simple method used as a reference (return the average, return the nearest sample's value).
- FAIR principles
- Fifteen principles for making data findable, accessible, interoperable and reusable.
- MGI
- Materials Genome Initiative. A U.S. government effort, begun in 2011, to speed up the discovery, development and deployment of materials.
- MII
- Materials Innovation Infrastructure. The framework MGI promotes that connects computation, experiment and data.
- GNN (graph neural network)
- AI that takes the connections between atoms as input. Covered in its own article.
- Active learning
- Learning in which the model chooses which sample to measure next. Covered in its own article.
- Self-driving laboratory
- A laboratory in which AI and robots repeat planning and running experiments. Covered in its own article.
- Reproducibility
- Getting the same result when the work is repeated under the same conditions.
13. References (primary sources)
- National Science and Technology Council "Materials Genome Initiative for Global Competitiveness", June 2011 — mgi.gov/sites/mgi/files/materials_genome_initiative-final.pdf
- NSTC Subcommittee on the Materials Genome Initiative "Materials Genome Initiative Strategic Plan", November 2021 — mgi.gov/sites/mgi/files/MGI-2021-Strategic-Plan.pdf
- Materials Genome Initiative "About the Materials Genome Initiative" (official website) — mgi.gov/about-materials-genome-initiative
- Davies D. W. et al. "Computational Screening of All Stoichiometric Inorganic Materials", Chem 1, 617–627 (2016), DOI 10.1016/j.chempr.2016.09.010 — doi.org/10.1016/j.chempr.2016.09.010
- Ramprasad R. et al. "Machine learning in materials informatics: recent applications and prospects", npj Comput. Mater. 3, 54 (2017), DOI 10.1038/s41524-017-0056-5 — doi.org/10.1038/s41524-017-0056-5
- Agrawal A., Choudhary A. "Perspective: Materials informatics and big data: Realization of the 'fourth paradigm' of science in materials science", APL Mater. 4, 053208 (2016), DOI 10.1063/1.4946894 — doi.org/10.1063/1.4946894
- Zunger A. "Inverse design in search of materials with target functionalities", Nat. Rev. Chem. 2, 0121 (2018), DOI 10.1038/s41570-018-0121 — doi.org/10.1038/s41570-018-0121
- Sanchez-Lengeling B., Aspuru-Guzik A. "Inverse molecular design using machine learning: Generative models for matter engineering", Science 361, 360–365 (2018), DOI 10.1126/science.aat2663 — doi.org/10.1126/science.aat2663
- Kirklin S. et al. "The Open Quantum Materials Database (OQMD): assessing the accuracy of DFT formation energies", npj Comput. Mater. 1, 15010 (2015), DOI 10.1038/npjcompumats.2015.10 (open access) — doi.org/10.1038/npjcompumats.2015.10
- Ling J. et al. "High-Dimensional Materials and Process Optimization Using Data-Driven Experimental Design with Well-Calibrated Uncertainty Estimates", Integr. Mater. Manuf. Innov. 6, 207–217 (2017), DOI 10.1007/s40192-017-0098-z — doi.org/10.1007/s40192-017-0098-z
- Li K. et al. "Exploiting redundancy in large materials datasets for efficient machine learning with less data", Nat. Commun. 14, 7283 (2023), DOI 10.1038/s41467-023-42992-y (open access) — doi.org/10.1038/s41467-023-42992-y
- Merchant A. et al. "Scaling deep learning for materials discovery", Nature 624, 80–85 (2023), DOI 10.1038/s41586-023-06735-9 — doi.org/10.1038/s41586-023-06735-9
- Cheetham A. K., Seshadri R. "Artificial Intelligence Driving Materials Discovery? Perspective on the Article: Scaling Deep Learning for Materials Discovery", Chem. Mater. 36, 3490–3495 (2024), DOI 10.1021/acs.chemmater.4c00643 — doi.org/10.1021/acs.chemmater.4c00643
- Rajan K. "Materials informatics", Materials Today 8(10), 38–45 (2005), DOI 10.1016/S1369-7021(05)71123-8 — doi.org/10.1016/S1369-7021(05)71123-8
- Fischer C. C. et al. "Predicting crystal structure by merging data mining with quantum mechanics", Nature Materials 5, 641–646 (2006), DOI 10.1038/nmat1691 — doi.org/10.1038/nmat1691
- Curtarolo S. et al. "AFLOW: An automatic framework for high-throughput materials discovery", Comput. Mater. Sci. 58, 218–226 (2012), DOI 10.1016/j.commatsci.2012.02.005 — doi.org/10.1016/j.commatsci.2012.02.005
- Jain A. et al. "Commentary: The Materials Project: A materials genome approach to accelerating materials innovation", APL Mater. 1, 011002 (2013), DOI 10.1063/1.4812323 — doi.org/10.1063/1.4812323
- Saal J. E. et al. "Materials Design and Discovery with High-Throughput Density Functional Theory: The Open Quantum Materials Database (OQMD)", JOM 65, 1501–1509 (2013), DOI 10.1007/s11837-013-0755-4 — doi.org/10.1007/s11837-013-0755-4
- Wilkinson M. D. et al. "The FAIR Guiding Principles for scientific data management and stewardship", Sci. Data 3, 160018 (2016), DOI 10.1038/sdata.2016.18 (open access) — doi.org/10.1038/sdata.2016.18
- Raccuglia P. et al. "Machine-learning-assisted materials discovery using failed experiments", Nature 533, 73–76 (2016), DOI 10.1038/nature17439 — doi.org/10.1038/nature17439
- Butler K. T. et al. "Machine learning for molecular and materials science", Nature 559, 547–555 (2018), DOI 10.1038/s41586-018-0337-2 — doi.org/10.1038/s41586-018-0337-2
- Dunn A. et al. "Benchmarking materials property prediction methods: the Matbench test set and Automatminer reference algorithm", npj Comput. Mater. 6, 138 (2020), DOI 10.1038/s41524-020-00406-3 (open access) — doi.org/10.1038/s41524-020-00406-3
- Riebesell J. et al. "A framework to evaluate machine learning crystal stability predictions", Nat. Mach. Intell. 7, 836–847 (2025), DOI 10.1038/s42256-025-01055-1 — doi.org/10.1038/s42256-025-01055-1
- Choudhary K. et al. "JARVIS-Leaderboard: a large scale benchmark of materials design methods", npj Comput. Mater. 10, 93 (2024), DOI 10.1038/s41524-024-01259-w — doi.org/10.1038/s41524-024-01259-w
- VAMAS "Versailles Project on Advanced Materials and Standards" (official website) — vamas.org
- ISO/IEC "ISO/IEC 22989:2022 Information technology — Artificial intelligence — Artificial intelligence concepts and terminology" (ISO page) — iso.org/standard/74296.html
- ISO/IEC "ISO/IEC 23053:2022 Framework for Artificial Intelligence (AI) Systems Using Machine Learning (ML)" (ISO page) — iso.org/standard/74438.html
- ISO/IEC "ISO/IEC 5259-1:2024 Artificial intelligence — Data quality for analytics and machine learning (ML) — Part 1: Overview, terminology, and examples" (ISO page) — iso.org/standard/81088.html
- ISO/IEC "ISO/IEC 5259-3:2024 Artificial intelligence — Data quality for analytics and machine learning (ML) — Part 3: Data quality management requirements and guidelines" (ISO page) — iso.org/standard/81092.html
- ISO/IEC "ISO/IEC 42001:2023 AI management systems" (ISO page) — iso.org/standard/81230.html
- NIST "Artificial Intelligence Risk Management Framework (AI RMF 1.0)", NIST AI 100-1, January 2023, DOI 10.6028/NIST.AI.100-1 — doi.org/10.6028/NIST.AI.100-1
14. Claim-to-source audit
| Claim in the text | Basis | Category |
|---|---|---|
| The estimate that four-component compounds from 103 elements number more than a trillion (10¹²) when ratios are counted, and about ten billion (10¹⁰) after removing chemically implausible compositions using valency and electronegativity | Abstract of Davies et al. (2016) Reference 4 https://doi.org/10.1016/j.chempr.2016.09.010 | Sourced |
| Typically about 10 to 20 years before a new class of materials is first used. The lithium-ion battery took 20 years from the mid-1970s proposal to wide adoption in the late 1990s. MGI's target of at least twice as fast at a fraction of the cost. Seven stages. Little feedback between stages | MGI white paper (June 2011) Reference 1 https://www.mgi.gov/sites/mgi/files/materials_genome_initiative-final.pdf | Sourced |
| The current MGI website says moving a material from discovery to market can take 20 or more years, and states the goal as twice as fast at a fraction of the cost compared with traditional methods | MGI official website Reference 3 https://www.mgi.gov/about-materials-genome-initiative | Sourced |
| The three goals of the MGI Strategic Plan (November 2021): unify the Materials Innovation Infrastructure, harness the power of materials data, educate and train the workforce. The statement that the MGI approach accelerated deployment of advanced materials in select applications | MGI 2021 Strategic Plan Reference 2 https://www.mgi.gov/sites/mgi/files/MGI-2021-Strategic-Plan.pdf | Sourced |
| The central method of MI: surrogate machine-learning models that predict quickly from past data alone, with materials expressed as sets of numbers (fingerprints / descriptors). Predictions are typically interpolative, and extrapolation requires uncertainty to be taken into account | Abstract of Ramprasad et al. (2017) Reference 5 https://doi.org/10.1038/s41524-017-0056-5 | Sourced |
| Data-driven discovery discussed as the "fourth paradigm", with examples of forward models (property prediction) and inverse models (materials discovery) | Abstract of Agrawal and Choudhary (2016) Reference 6 https://doi.org/10.1063/1.4946894 | Sourced |
| The idea of inverse design: declare the desired functionality first, predict stable and synthesizable compounds by calculation, and improve through prediction-synthesis-characterization cycles | Abstract of Zunger (2018) Reference 7 https://doi.org/10.1038/s41570-018-0121 | Sourced |
| That a paper reviews inverse molecular design with generative machine-learning models (from its title) | Title and bibliographic details of Sanchez-Lengeling and Aspuru-Guzik (2018) Reference 8 https://doi.org/10.1126/science.aat2663 | Sourced |
| Mean absolute error between DFT and experimental formation energies of 0.096 eV/atom (1,670 compounds). Mean absolute error between experiments 0.082 eV/atom. The view that a significant fraction of the error may come from experimental uncertainty | Abstract of Kirklin et al. (2015) Reference 9 https://doi.org/10.1038/npjcompumats.2015.10 | Sourced |
| Over four materials-science test cases, experiments proposed by a machine-learning model found the optimal candidate with on average three times fewer measurements than random guessing | Abstract of Ling et al. (2017) Reference 10 https://doi.org/10.1007/s40192-017-0098-z | Sourced |
| Up to 95% of data can be removed with little effect on in-distribution performance; the removable data relate to over-represented material types; out-of-distribution degradation is not prevented | Abstract of Li et al. (2023) Reference 11 https://doi.org/10.1038/s41467-023-42992-y | Sourced |
| The paper's statement that GNoME enabled the discovery of 2.2 million structures below the convex hull of previously known stable crystals, and that 736 have already been independently experimentally realized | Abstract of Merchant et al. (2023) Reference 12 https://doi.org/10.1038/s41586-023-06735-9 | Sourced |
| An examination of the GNoME claims that finds scant evidence for compounds meeting novelty, credibility and utility; the methods appear promising but need domain expertise in synthesis and crystallography | Abstract of Cheetham and Seshadri (2024) Reference 13 https://doi.org/10.1021/acs.chemmater.4c00643 | Sourced |
| Bibliographic details of the timeline events (Rajan 2005, Fischer 2006, AFLOW / Materials Project / OQMD 2012–13, FAIR principles and Raccuglia 2016, Butler 2018, Matbench 2020). Full text of Rajan's paper not read | Bibliographic records of each paper (checked with Crossref) Reference 14 https://doi.org/10.1016/S1369-7021(05)71123-8 Reference 15 https://doi.org/10.1038/nmat1691 Reference 16 https://doi.org/10.1016/j.commatsci.2012.02.005 Reference 17 https://doi.org/10.1063/1.4812323 Reference 18 https://doi.org/10.1007/s11837-013-0755-4 Reference 21 https://doi.org/10.1038/s41586-018-0337-2 | Sourced |
| The FAIR principles are fifteen principles covering findability, access, interoperability and reuse, first published in Scientific Data in 2016 | Wilkinson et al. (2016) Reference 19 https://doi.org/10.1038/sdata.2016.18 | Sourced |
| A machine-learning model trained on records of failed reactions predicted reaction outcomes more accurately than human intuition (hydrothermal synthesis of vanadium selenites) | Raccuglia et al. (2016) Reference 20 https://doi.org/10.1038/nature17439 | Sourced |
| Contents of Matbench (13 tasks), Matbench Discovery (misalignment of regression and classification metrics, false positives) and JARVIS-Leaderboard (274 benchmarks, 1,281 contributions) | Abstracts of each paper Reference 22 https://doi.org/10.1038/s41524-020-00406-3 Reference 23 https://doi.org/10.1038/s42256-025-01055-1 Reference 24 https://doi.org/10.1038/s41524-024-01259-w | Sourced |
| VAMAS is a framework for international collaborative projects providing the technical basis for harmonized measurements, testing, specifications and standards | VAMAS official website Reference 25 https://www.vamas.org | Sourced |
| Numbers, titles and publication dates of ISO/IEC 22989:2022 (July 2022), 23053:2022 (June 2022), 5259-1:2024, 5259-3:2024 (both July 2024) and 42001:2023 (December 2023) | ISO pages (checked 22 October 2026) Reference 26 https://www.iso.org/standard/74296.html Reference 27 https://www.iso.org/standard/74438.html Reference 28 https://www.iso.org/standard/81088.html Reference 29 https://www.iso.org/standard/81092.html Reference 30 https://www.iso.org/standard/81230.html | Sourced |
| Number and title of NIST AI RMF 1.0 (NIST AI 100-1, January 2023) | NIST document (DOI) Reference 31 https://doi.org/10.6028/NIST.AI.100-1 | Sourced |
| Years needed to test 10¹⁰ candidates at one per day, one per hour and 1,000 per day (about 27 million, 1.1 million and 27,000 years), and the table of hits by ρ for narrowing down | Our calculation (plain division, and a numerical experiment on synthetic data in Python; seed 2026, average of 500 trials). Not results on real materials | Our calculation |
| Progress toward MGI's goal of twice the speed at a fraction of the cost, the full text of Rajan's paper, a judgment on the novelty or usefulness of GNoME, an MI-specific international standard, and the full text of ISO/IEC standards | Not confirmed in the primary sources we could access, so not stated | Commentary |
| The division of roles "computation is cheap and fast, experiment checks, AI narrows", the idea of "where to look", each "materials engineer's view", and the six things to do starting today | Our own organization and commentary based on the published content. Not views expressed by the institutions | Commentary |
| That the figures are explanatory drawings, not observations of real data; that the hero image and Fig. 9 are ImageGen-generated conceptual illustrations | Our note in this article | Commentary |
Last updated: 22 October 2026 / Sources are limited to primary materials (official U.S. MGI documents, peer-reviewed papers, and official pages of ISO, NIST and VAMAS); no market-research estimates are used. The full text of ISO/IEC standards is paywalled and was not checked. The narrowing-down numerical experiment is a calculation on synthetic data we generated, not a result on real materials. We could not confirm progress toward MGI's goal, the full text of Rajan's paper, a judgment on the novelty or usefulness of GNoME, or an MI-specific international standard, so these are not stated. All figures are explanatory concept diagrams or drawings that include our own calculation; the hero image and Fig. 9 are ImageGen-generated conceptual illustrations.