TECHNOLOGY EXPLAINER
Robot Vision and Perception
— how cameras and range sensors tell a robot “what is where”, and how that is turned into something it can grasp
To pick something up, a robot first has to see. But a camera image is just a grid of numbers, and getting from there to what the object is, where it is and which way it faces, and then to how to grasp it, takes a chain of several stages. Using analogies that a materials engineer can relate to, this article walks through how cameras and depth sensors work, point clouds, object detection and segmentation, 6D pose, and grasp perception. The second half explains why “detected” does not mean “grasped”, why transparent, glossy and dark surfaces are hard, and how to read the evaluation metrics (IoU, AP) and standards, checking each point against primary sources and a few small calculations of our own.
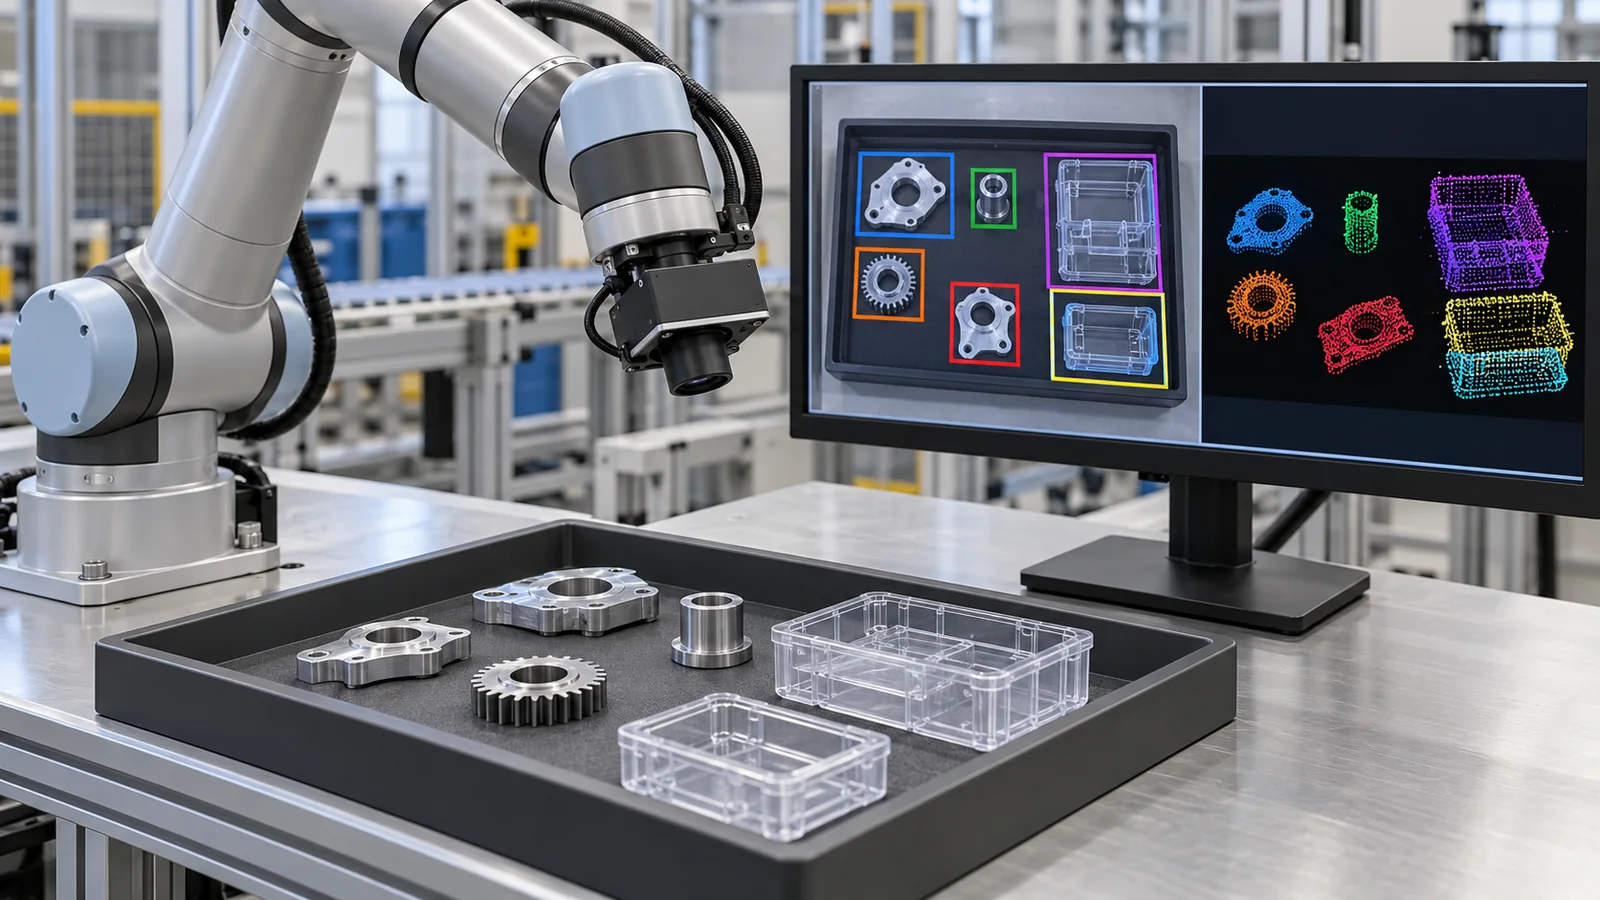
- What robot vision is (the short version)
- From “seeing” to “grasping” — the whole flow
- The parts of the eye — cameras and depth sensors
- Distance error grows with the square of distance — our calculation
- Point clouds — turning a depth image into points in space
- What is in the picture — object detection and segmentation
- Where, and facing which way — 6D pose
- How to grasp — perception for grasping
- A materials engineer’s view 2: surface, lighting and dirt decide whether perception works
- Types of perception failure, and how to check for them
- Limits, and what could not be confirmed / summary
- How to read the yardsticks and standards
- Glossary
- References
- Claim-to-source audit
Sourced = stated in published material (link given)
Our calculation = a figure this article derived, with the assumptions spelled out
Not yet confirmed = a plan, draft or work in progress that is not settled
Interpretations are marked separately as Commentary. Inference is shown in bold.
The numerical examples in Chapters 4, 5, 6 and 8 are calculations from values we assumed (focal length, camera spacing, success rate of each stage and so on). They do not describe the performance of any real camera or robot. Results from papers (success rates, processing speeds) are values reported for the objects, environments and robots each paper chose, and we do not rank methods by putting numbers from different papers side by side. For standards (ISO, IEC) we confirmed only the title and scope and did not read the text. We do not compare specific products or companies.
1. What robot vision is (the short version)
- “Seeing” is a chain of stages, each answering a different question: capture an image and distances with a camera and depth sensor → turn them into a set of 3D points (a point cloud) → find the objects → work out position and orientation → choose how to grasp. The stages answer “What is in the picture?”, “Where, and facing which way?” and “How should it be held?”
- Range sensors are not magic: the error of a two-camera method (stereo) grows with the square of the distanceSourced[Ref. 1]. Transparent objects are known to give standard 3D sensors values that look like the surface behind themSourced[Ref. 18]
- “Detected” is not “grasped”: the success rates of the stages multiply (98%, 95% and 90% give about 84%)Our calculation. Read the metrics that score box overlap (IoU, AP) separately from the success rate of actually grasping on a real robot
In this series’ shared picture, a robot is a combination of “sense (sensors), think (control and intelligence) and act (actuators)”. This article covers “sense” and the entrance to “think”. One more thing to know: a digital image is a grid of pixels, and in an ordinary colour image each pixel holds three numbers for red, green and blue brightness. A person looks at an image and instantly sees “a cup”; for the robot, everything starts from that list of numbers.
Our LiDAR article covers measuring distance by the round-trip time of light, our autonomous-driving article covers perception while moving, and our article on world models and embodied AI covers AI that links perception to action. This article is limited to perception for picking things up on a workbench (manipulation). The hand itself is in our article on robot hands and grasping, the sense of touch in our article on tactile sensors and electronic skin, estimating the robot’s own position in our SLAM article, and learning that links perception directly to action in our articles on imitation and reinforcement learning and on robot foundation models and VLA.
Perception is not one judgement but a chain of stages, and a small error at one stage is carried into the next. So do not look only at detection scores and conclude that the robot can grasp; check the success rate of each stage and the success rate all the way to a completed grasp, separately.
2. From “seeing” to “grasping” — the whole flow
Think of picking up a cup from a desk. A person, the instant they see it, knows “it is a cup”, “it is within reach”, “the handle faces this way” and “I should hold it here”, all without thinking. A robot splits this into stages and computes each one.
| Stage | Question it answers | Output | Examples of methods | Where errors tend to arise (commentary) |
|---|---|---|---|---|
| 1. Sensor | How is the light recorded? | Colour image, depth image | Camera, stereo, projected pattern, time of flight | Quality depends on surface, brightness and distance (Chapters 3, 4, 9) |
| 2. Point cloud | Where in space are the points? | A set of 3D points | Computed from the depth image (Chapter 5) | Missing points, scatter, and a large number of points that is heavy to process |
| 3. Detection and segmentation | What is in the picture? | Box or mask, plus a label | YOLO, Mask R-CNN, DETR, SAM | Unfamiliar objects, overlap, different lighting (Chapter 6) |
| 4. 6D pose | Where, and facing which way? | Three position values plus three rotations | PoseCNN, FoundationPose and others | Symmetric objects, occlusion, reflections (Chapter 7) |
| 5. Grasp perception | How should it be held? | Candidate hand positions, orientations and opening widths | Dex-Net, Contact-GraspNet and others | Fit with the hand shape and friction; the unseen back side (Chapter 8) |
The method names are representative examples confirmed in papers; they do not indicate ranking or popularity. “Where errors tend to arise” is this article’s own arrangement (commentary).
Splitting into stages makes it easier to tell where a failure comes from. The price is that each later stage trusts the output of the one before, so an early error is passed straight on. The second half of this article puts numbers on that “carry-over”.
3. The parts of the eye — cameras and depth sensors
(1) An ordinary camera gives colour, but not distance directly
The image from an ordinary colour (RGB) camera carries colour and texture. Two objects can look the same size whether one is small and near or the other large and far, and a single image cannot settle which. So robots combine a camera with a distance-measuring sensor. A sensor that provides colour and distance together is called an RGB-D sensor (D stands for depth).
(2) Four ways to get distance
Here are the main approaches, with how they work and where they are strong or weak.
| Method | How it works (in plain terms) | Strengths | Weaknesses (commentary) |
|---|---|---|---|
| Stereo vision | Look at how far the same point shifts between the images of two cameras (disparity) and use the geometry of a triangle to get distance [Ref. 1]. The same idea as two human eyes | Some implementations work in bright outdoor light. Can be built from the same cameras that give the colour image | On surfaces with little pattern (a white wall, say), matching the two images is hard. Errors are large at long range (Chapter 4) |
| Projected pattern | Throw an infrared pattern onto the object and find distance from how the pattern looks, or use the pattern as a clue to match the two images. The RealSense R200 described by Keselman et al. is one example that projects an infrared texture to help stereo matching [Ref. 1] | Distance comes out more easily even on featureless surfaces. Works in the dark | The light of the projected pattern weakens with distance, so the signal strength falls at long range (a footnote in Keselman et al. [Ref. 1]). How the pattern returns depends on the surface (Chapter 9) |
| Time of flight (ToF) and LiDAR | Emit light and compute distance from the time until it returns. The principle is covered in our LiDAR article | Some versions measure long distances | On transparent, mirror-like or strongly glossy surfaces the returning light is disturbed |
| AI estimation from one image | A trained network estimates depth from a single colour image. Depth Anything V2 is reported as a monocular depth-estimation model trained by replacing all labelled real images with synthetic ones [Ref. 19] | One camera is enough | The result is an estimate, which is different in nature from what a sensor measured. How accurately it gives metric values depends on training and settings (not examined here) |
The explanations of how each works are this article’s general summary (commentary). The R200 configuration and the training of Depth Anything V2 come from the abstracts of the respective papers. We do not rank the methods.
(3) Checking how stereo works with a figure
Hold up a finger in front of your face and look at it with the right eye only, then the left eye only. The finger appears to jump sideways against the background, and the nearer the finger, the bigger the jump. Stereo vision counts that shift and turns it into distance.
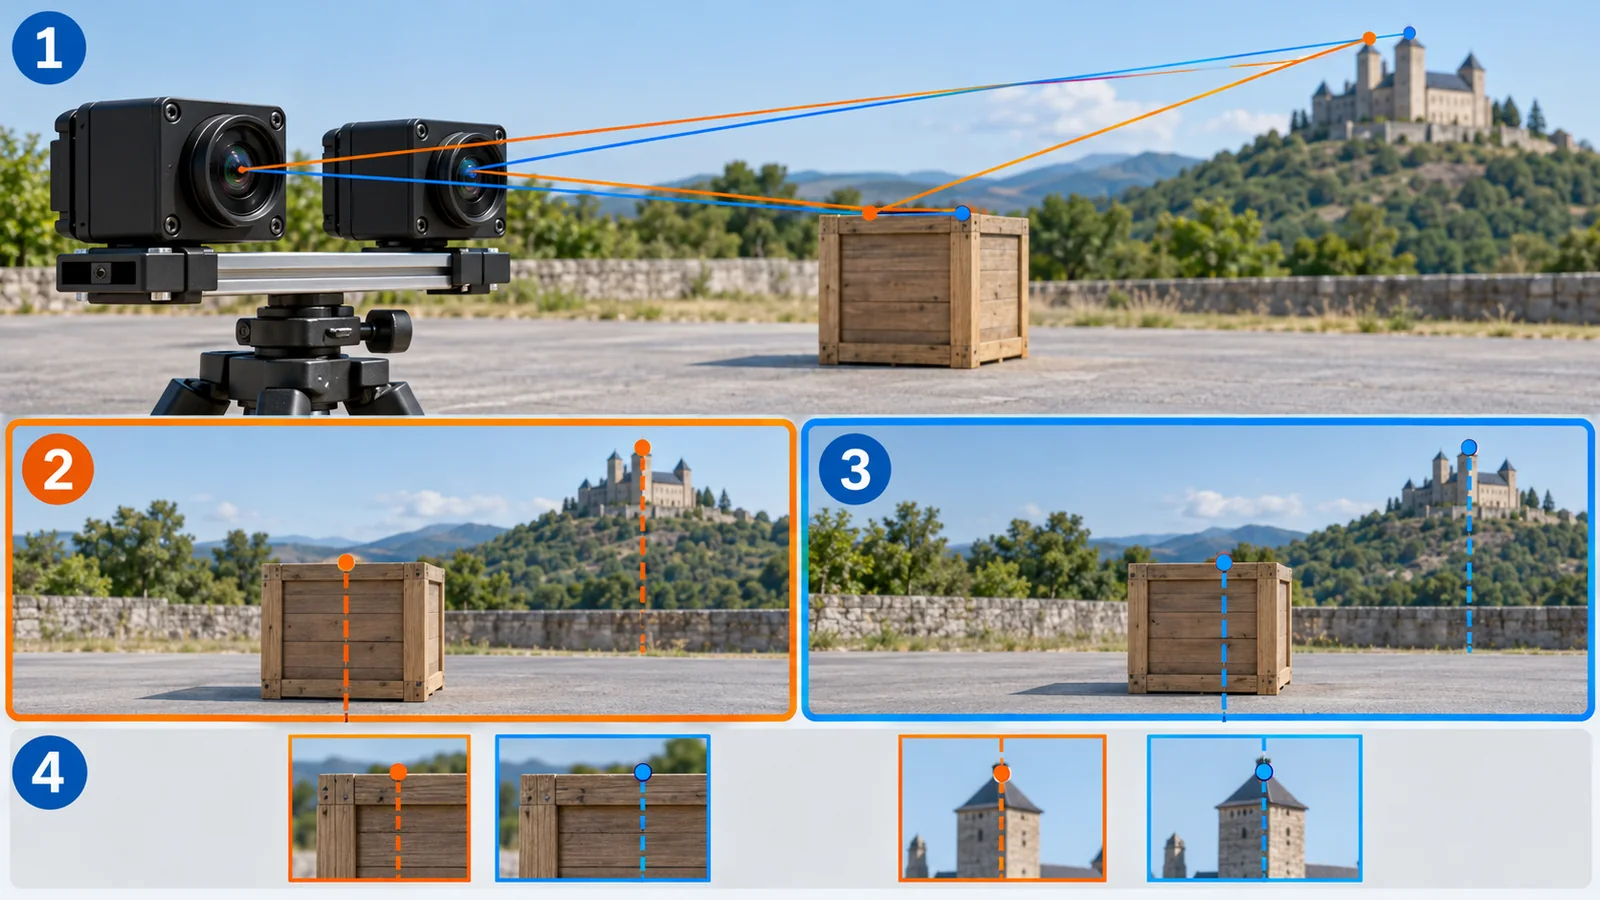
Original SVG, detailed explanation and sources
Original SVG reference: Conceptual diagram (vector drawing). Two cameras looking at the same point see it shifted between the two images; the nearer the point, the larger the shift (disparity). The relation Z = f × B / d has the same form as in Keselman et al. [Ref. 1]. The lengths are for illustration, not the dimensions of any real camera.
As a formula, the distance Z is “focal length f × camera spacing B ÷ disparity d” (Z = f × B / d). The larger the disparity (the shift), the nearer the point [Ref. 1]. Here the focal length f and the disparity d are counted in pixels, while the spacing B and the distance Z are in metres.
Unlike reading a length off a ruler, the distance from a stereo method is the result of “finding the same point in the left and right images, counting the shift and calculating”. Where that search (matching) fails, the computed distance cannot be trusted either. Holes in the image and values that differ from their surroundings are, to a large extent, failures of this search (commentary).
4. Distance error grows with the square of distance — our calculation
Let us put numbers on how the error of a stereo method grows. First the intuition: in a distant landscape the left-eye and right-eye views barely differ. When the shift is small, a slight misreading makes a large difference in distance.
Keselman et al. differentiate the distance formula and show that the depth error grows as Z² / (f × B) times the disparity error [Ref. 1]. The disparity error is set by image quality and the matching method and can be treated as roughly constant, they write (about 0.1 pixel from their measurements). In other words, doubling the distance quadruples the error, and doubling the camera spacing B halves it.
The table below is calculated with assumed values: focal length f = 600 pixels and a disparity error of 0.1 pixel (Our calculation).
| Distance Z | Error (spacing B = 70 mm) | Error (spacing B = 140 mm) | Length covered by one pixel (Z / f) |
|---|---|---|---|
| 0.5 m | about 0.6 mm | about 0.3 mm | about 0.83 mm |
| 1 m | about 2.4 mm | about 1.2 mm | about 1.7 mm |
| 2 m | about 9.5 mm | about 4.8 mm | about 3.3 mm |
| 3 m | about 21 mm | about 11 mm | about 5.0 mm |
| 5 m | about 60 mm | about 30 mm | about 8.3 mm |
Our calculation. Assumed f = 600 pixels and disparity error = 0.1 pixel; error = Z² / (f × B) × 0.1. These are not the specifications of a real camera. The length covered by one pixel is the distance divided by the focal length (a pixel spans a width that grows in proportion to distance).
The same paper reports, as measurements on one unit (R200, 480 x 360 pixels, 30 Hz), 2.1 mm at 1 m and 8.0 mm at 2 m [Ref. 1]. This is the same order of magnitude as the assumed curve (2.4 mm at 1 m, 9.5 mm at 2 m), and the value at 2 m being about four times the value at 1 m agrees too. It is one example, though, and not a value for other devicesSourced.
What this calculation tells us
- The nearer you look, the better: the common arrangement of a camera on the wrist, moving close to the object, fits how the error grows (commentary)
- Small things seen from afar are “less than one pixel”: as the table shows, one pixel covers about 5 mm at 3 m, so a 3 mm screw is smaller than one pixelOur calculation
- A wider spacing reduces error, but at a cost: the camera becomes bigger, and nearby objects are harder to get into both views (commentary)
The R200 described by Keselman et al. puts a filter that blocks light below about 840 nm in front of its left and right cameras, focusing their sensitivity on the projected infrared pattern [Ref. 1]. That is, this camera measures distance not by the colours our eyes see but by how things look in near-infrared.
This is where materials come in. (1) How an object’s surface returns near-infrared light (scatters, reflects like a mirror, transmits or absorbs) changes how easily distance can be obtained (Chapter 9). (2) Dirt, fogging and scratches on the camera window, lens and filter can change the image contrast and the way the projected pattern looks, so cleaning and replacement routines become part of accuracy in a factory or laboratory (this is this article’s general view, not a measured value for any specific device). (3) What films or glasses the filters are made of we did not check in primary sources.
5. Point clouds — turning a depth image into points in space
A depth image has a distance in each pixel. We turn it into a set of 3D points (a point cloud), which is easier for a robot to handle. The calculation is simple and uses the lens model of a pinhole camera.
If the pixel position (u, v) and the distance Z are known, the 3D position (X, Y, Z) seen from the camera is X = (u − cx) × Z / f and Y = (v − cy) × Z / f. Here (cx, cy) is the pixel at the image centre and f is the focal length in pixels. For example, for a camera with f = 600 pixels and centre (320, 240), if the pixel (420, 300) has distance 0.8 m, then X = (420 − 320) × 0.8 / 600 = about 0.133 m and Y = (300 − 240) × 0.8 / 600 = 0.08 mOur calculation.
A point cloud is like a list of three numbers (x, y, z) per point. The points have no fixed order, and shuffling the list does not change the shape it describes. Unlike an image there is no fixed notion of “neighbouring pixel”, so methods built for images cannot be used as they are. The PointNet network of Qi et al. was proposed to take this unordered set of points directly as input [Ref. 2]Sourced.
How heavy the data is
A point cloud made from a 640 x 480 pixel depth image has 307,200 points. Storing each point as three single-precision numbers (4 bytes x 3) takes about 3.7 MB, and at 30 frames per second about 111 MB/sOur calculation. Point clouds are convenient but heavy to process as they are, so preprocessing such as thinning out points or cutting out only the region of the object is used (commentary).
Aligning point clouds: ICP
A classic way to fix an object’s position and orientation by overlaying a 3D model of the object (a CAD model, for example) on the point cloud from the camera is ICP (iterative closest point). It is a method for registering 3D shapes reported by Besl and McKay in 1992, built on the idea of matching nearby points and nudging the shapes together step by step. What we confirmed in the paper is its title and bibliographic data; the description of the mechanism is this article’s general commentary [Ref. 3]Sourced. If the starting position is far off, the shapes may fail to line up (commentary).
6. What is in the picture — object detection and segmentation
(1) The difference between a box and a mask
Object detection marks objects in an image with rectangular boxes and labels. Segmentation goes finer and paints, for each pixel, which object it belongs to. Segmentation that separates objects of the same kind one by one is called instance segmentation. For grasping, a mask is more convenient than a box, because it lets you cut out a point cloud that follows the object’s outline (commentary).
(2) Representative methods (as described in the papers)
- YOLO treats detection as a regression problem in which one network outputs box positions and class probabilities in a single pass; the paper reports that the base model runs at 45 frames per second [Ref. 4]Sourced
- Mask R-CNN adds a branch that outputs masks to the box-prediction machinery, and is reported to run at about 5 frames per second [Ref. 5]Sourced
- DETR treats detection as a problem of directly outputting a set of objects, and the authors say it removes hand-designed components such as the step that removes duplicates [Ref. 6]Sourced
- Segment Anything (SAM) is a model that cuts out regions from prompts such as points or boxes, reported as trained on a dataset of over a billion masks on 11 million images [Ref. 7]. SAM 2 covers both images and video [Ref. 8]Sourced
- Grounding DINO is an “open-vocabulary” detector that looks for objects specified in words (category names or descriptive phrases) [Ref. 9]Sourced
The processing speeds in each paper are for the computer and image size that paper used, not a comparison under the same conditions. You cannot conclude from them which is faster or better (commentary).
Large pre-trained models such as Grounding DINO and SAM are built to handle objects beyond the categories fixed at training. But whether they work well enough on odd parts from a real workplace (shiny metal pieces, translucent resin parts) is a separate question. The safe approach is to try your own parts’ images and find the conditions in which it fails (commentary). The scores in the papers are for the data those papers chose.
(3) What counts as a “hit”: IoU and AP
Whether a detection is right is decided by how much the predicted box overlaps the true box. That overlap is the IoU (overlap area divided by combined area). The figure below shows a case where the box is slightly off and the IoU works out to 0.59.
According to the COCO evaluation page, the main metric AP is averaged over 10 IoU thresholds from 0.50 to 0.95 in steps of 0.05, and also over the 80 categories. It also reports AP at IoU 0.50 alone (the PASCAL VOC metric) and at the stricter 0.75, and AP split by object size into small (area under 32² pixels), medium and large (over 96²), computed with at most 100 detections per image [Ref. 11]Sourced. The COCO dataset contains 2.5 million labelled instances in about 328,000 images [Ref. 10]Sourced.
AP is an average of “how well the boxes overlapped”. Grasping needs millimetre-to-centimetre accuracy of position and the right orientation, which box overlap cannot show. Chapters 7 and 8 deal with what comes after (commentary).
7. Where, and facing which way — 6D pose
An object’s position can be given by three numbers (x, y, z) and its orientation by three rotations (tilting forward and back, tilting left and right, and turning about its axis). Together these are six degrees of freedom, hence “6D pose”. Degrees of freedom (DOF) usually means “the number of directions in which something can move”, as in the rest of the series; here it means the number of independent values for an object’s position and orientation.
- PoseCNN finds an object’s centre in the image, predicts its distance from the camera to get the 3D position, and regresses the rotation as a quaternion. It also introduced a loss that handles symmetric objects, and released the YCB-Video dataset (21 objects, 92 videos, 133,827 frames) [Ref. 12]Sourced
- BOP is a benchmark for comparing methods that estimate the 6D pose of a rigid object from a single RGB-D image. It provides eight datasets and a common evaluation method, and evaluated 15 methods at the time of the paper [Ref. 14]Sourced
- FoundationPose is a foundation model reported to estimate and track the 6D pose of new objects without fine-tuning, given a CAD model or a small number of reference images [Ref. 15]Sourced
A round rod or a disc looks the same however it is turned about its axis. Then “how many degrees is its orientation” cannot be settled from appearance, and there are several correct answers. This is why PoseCNN introduced a loss that handles symmetric objects [Ref. 12]. In grasping, how a symmetric part should be placed can become a problem (commentary).
8. How to grasp — perception for grasping
Even when an object’s position and orientation are known, where and how to pinch it is a separate question. It depends on the hand’s shape (two fingers or suction), the object’s weight and how slippery its surface is. This is why research moved to predicting the grasp directly.
- Dex-Net 2.0 trained a network to predict the success probability of a grasp using 6.7 million synthetic point clouds and grasps made from 3D models. In over 1,000 real trials on an ABB YuMi, it reports a 93% success rate on eight known objects with difficult geometry, and 0.8 s to plan a grasp [Ref. 16]Sourced
- Contact-GraspNet generates grasps for a parallel-jaw hand (two plates that pinch) directly from a depth recording. Trained on 17 million simulated grasps, it reports a success rate above 90% on unseen objects in structured clutter, halving the failure rate compared with a recent state-of-the-art method [Ref. 17]Sourced
- ClearGrasp estimates the 3D shape of transparent objects from a single RGB-D image. Because transparent objects give standard 3D sensors noisy values resembling the surface behind them, it infers surface normals and masks and corrects the depth. The authors built a synthetic dataset of over 50,000 images and a real test set of 286 images [Ref. 18]Sourced
All these success rates are for the objects, placements, hands and number of trials each paper chose. “Eight known objects” for Dex-Net and “unseen objects in structured clutter” for Contact-GraspNet are different conditions, so the numbers cannot be lined up to say which is better (commentary). How to read success rates from few trials, with confidence intervals, is covered in Chapter 6 of our article on world models and embodied AI.
Stage success rates multiply
Assume, for illustration, “detection 98%, pose 95%, grasp 90%”. If the stages are independent, the overall success rate is 0.98 × 0.95 × 0.90 = about 84%. Which stage should be improved to raise the total the most?
- Raising detection from 98% to 99.5% brings the total to about 85.1% (+1.3 points)
- Raising the grasp from 90% to 95% brings the total to about 88.4% (+4.6 points)
Our calculation. The stage success rates are illustrative assumptions, with the stages assumed independent. They are not the results of any real system.
The conclusion is simple. Improving the weakest stage pays off most, and chasing the detection metric (AP) alone does not tell you the final success rate. In practice an error in one stage changes the failure rate of the next, so independence is an idealisation (commentary).
In fact: image-recognition scores (AP and the like) measure how well boxes or masks overlap; they do not guarantee the few-millimetre position and orientation needed to grasp, nor the fit with the hand. On transparent, glossy or dark surfaces, even the distance itself may be unobtainable (Chapter 9). The performance of a grasping robot is confirmed on a real machine, with your own objects and placements.
9. A materials engineer’s view 2: surface, lighting and dirt decide whether perception works
All the methods so far assume that “light hits the object and comes back”. So the object’s surface properties and the lighting strongly influence whether perception succeeds. This is the chapter where materials knowledge helps most.
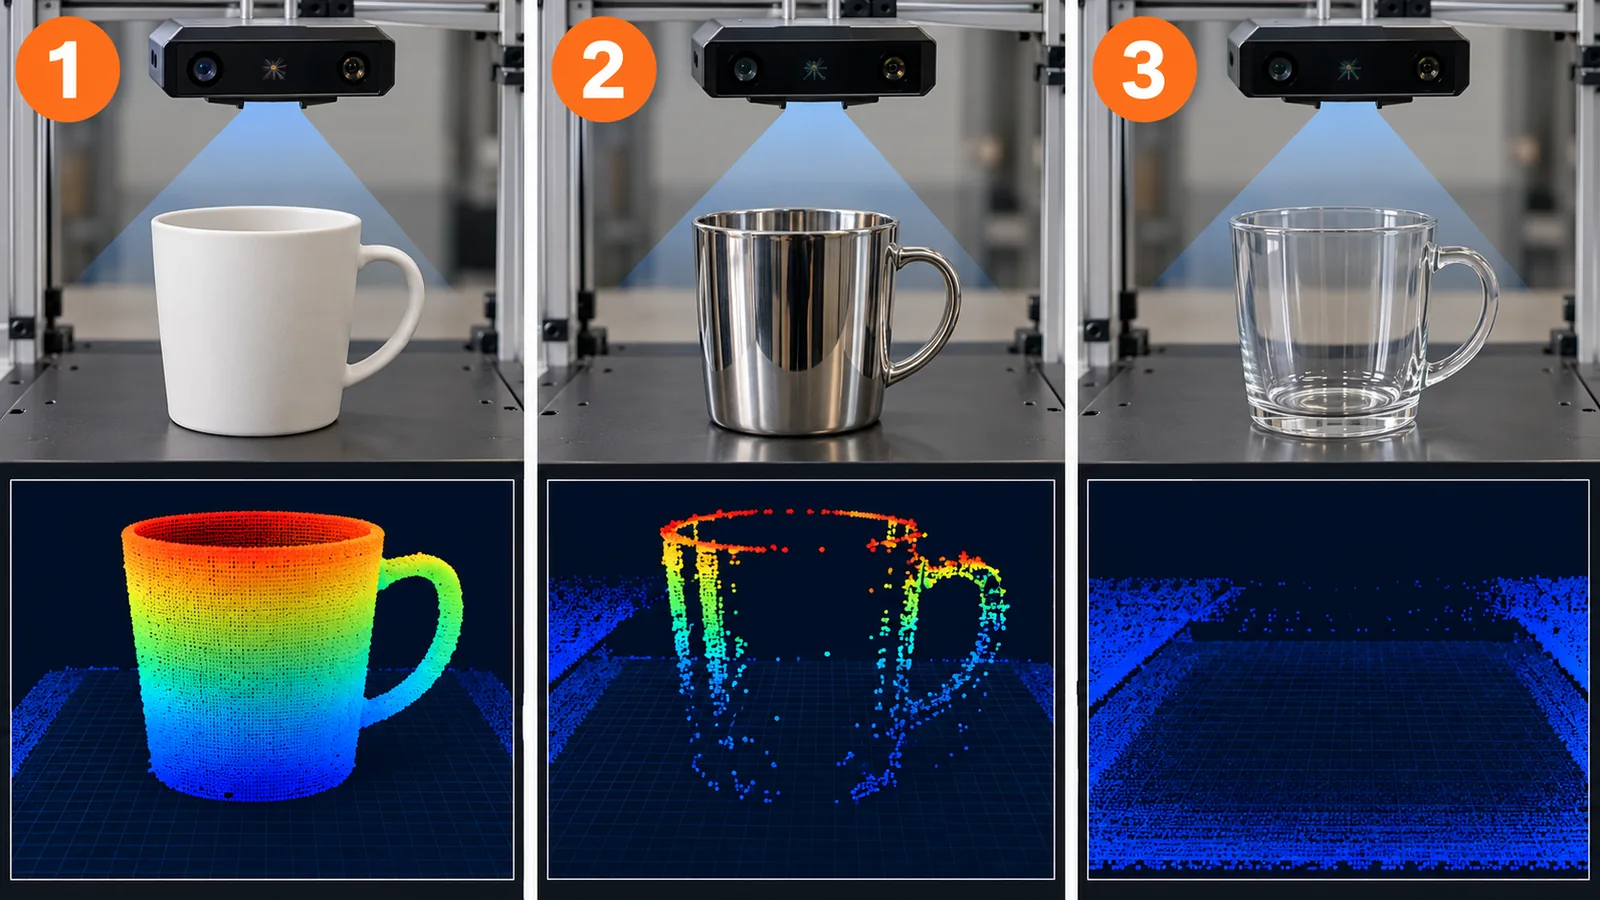
Original SVG, detailed explanation and sources
Original SVG reference: Conceptual diagram (vector drawing). The same shape can be easy or hard to measure depending on how its surface returns light. That depth on transparent objects comes out as a noisy value resembling the surface behind is stated in the ClearGrasp paper [Ref. 18]; an example of a system using projected infrared light is in Keselman et al. [Ref. 1].
How each kind of surface looks
- Matte surfaces: light scatters in all directions, so the brightness looks similar from any angle and distance tends to be stable (commentary)
- Glossy surfaces (polished metal, glass-like finishes): light returns strongly in one direction, so the surface glares at one angle and looks dark at another. Holes or jumps may appear in the depth image (commentary)
- Transparent surfaces (glass, clear plastic): light passes through, so standard 3D sensors give noisy values resembling the surface behind [Ref. 18]Sourced
- Very dark surfaces (black rubber, carbon-containing materials): they absorb light and return little, which may make distance hard to obtain (this is this article’s general expectation, and we did not confirm it in primary sources)
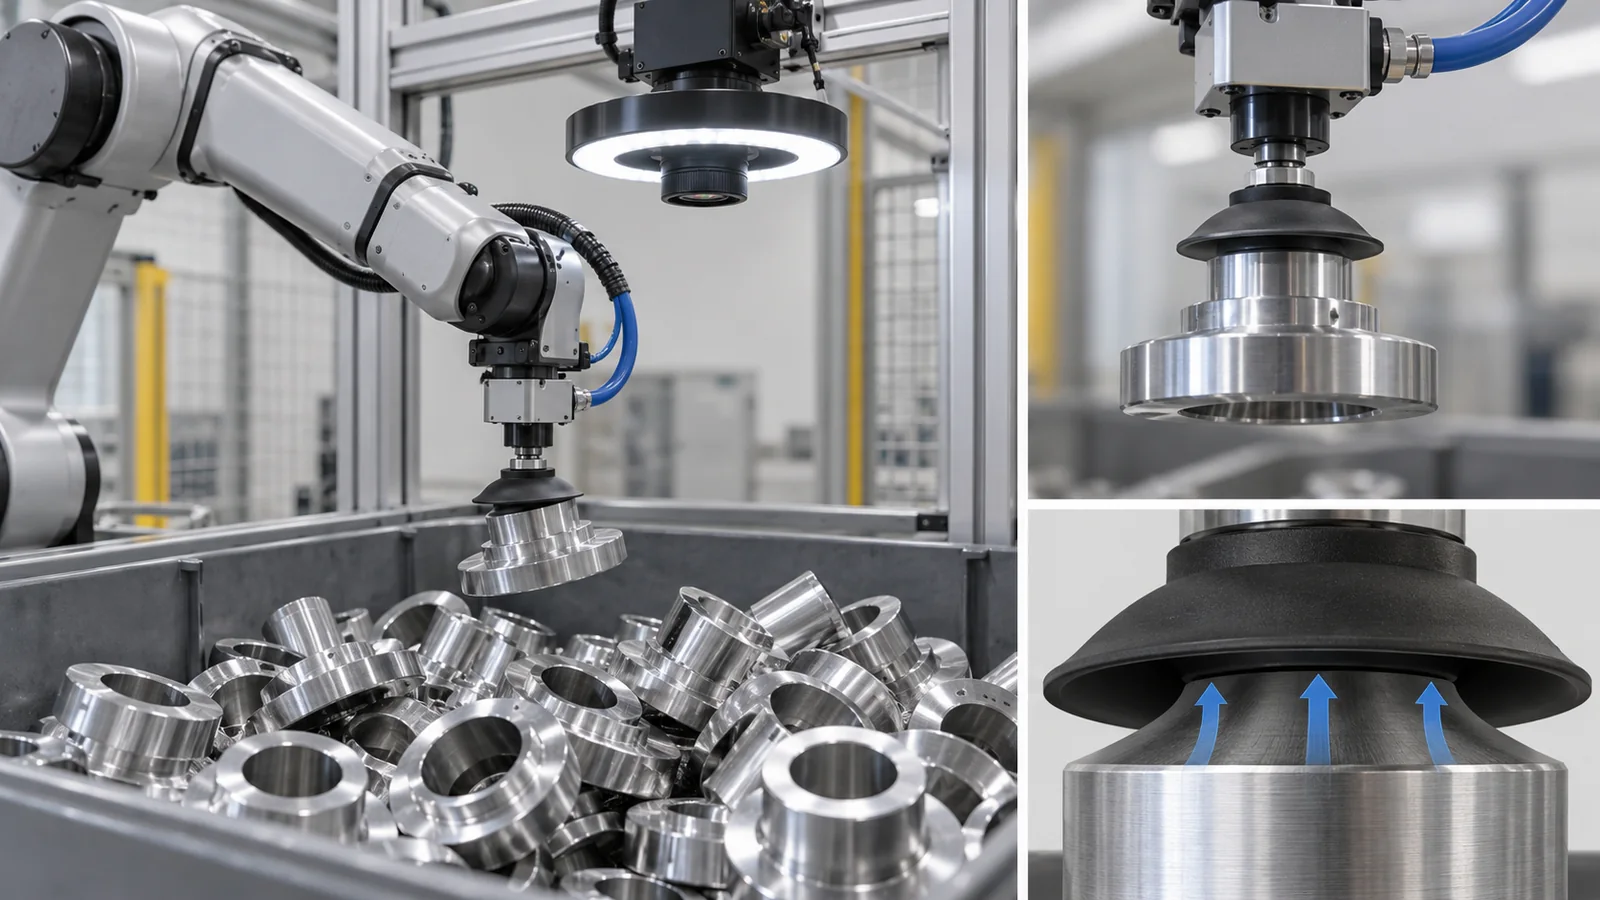
Parts of the same shape look different to cameras and depth sensors if they are (1) as-machined metal, (2) plated or polished to a shine, or (3) painted black or anodised. A part that is hard to recognise may become easy to recognise just by changing its surface treatment or colour. Conversely, a finish chosen for appearance or function may be what makes recognition difficult (this is this article’s general view, not a measurement on a specific part).
Lighting is also a materials question. Weakening glossy reflections with a polarising filter or reducing shadows and glare with diffuse lighting are choices made on the basis of how the surface returns light. Camera and light mounting positions, dirty windows, and dust or oil deposits are site conditions to check in trials before introduction (commentary).
The errors of a camera and depth sensor can be several millimetres to centimetres. If the robot hand can correct its position from the touch and force at the moment of grasping, it can make up for visual errors afterwards. The division of roles between vision and touch is covered in our articles on robot hands and grasping and on tactile sensors and electronic skin (commentary).
10. Types of perception failure, and how to check for them
Here are the failures that tend to occur on site, sorted by cause. Use it as a checklist when trying this in your own process (this is this article’s arrangement, not statistics).
| Type of failure | What it looks like | Example causes | How to check |
|---|---|---|---|
| No distance obtained | Holes in the point cloud; black gaps in the depth image | Transparent, glossy or dark surfaces; featureless surfaces | Look at the depth image of your actual parts. Change surface finish or lighting |
| Distance is off | Objects appear to float or tilt | Too far away; drifted calibration | Measure from closer. Re-measure against a fixture of known dimensions |
| Missed or false detections | No box appears; background judged to be an object | Unfamiliar appearance, different lighting, overlap | Test with images that vary lighting, background and orientation |
| Wrong position or orientation | The box is right but the grasp misses | Symmetric objects, occlusion, point-cloud noise | Measure the pose error and the final grasp success rate, not the box metric |
| Grasp fails | Slips before or after lifting; drops the part | Friction, fit with the hand shape, the unseen back side | Try dozens of times on a real machine, varying objects and placements |
The table is this article’s arrangement (commentary). Actual failure rates vary greatly with the object, environment and equipment.
11. Limits, and what could not be confirmed / summary
(1) Accuracy of products and devices
We do not cover the accuracy or processing speed of specific cameras, depth sensors or robots as products. The distance-error table is the formula of Keselman et al. [Ref. 1] filled in with values we assumed; it is not the specification of a real device.
(2) Comparing results in papers
YOLO’s 45 frames per second, Dex-Net’s 93% success and Contact-GraspNet’s 90%-plus are values reported under the conditions each paper chose. We do not rank methods by lining up numbers from different conditions. We did not confirm independent third-party reproduction.
(3) The text of standards
For ISO and IEC standards we limited ourselves to number, title, date and scope and did not read the text. We could not confirm an international standard that defines the accuracy of depth sensors, nor one that directly defines how to evaluate a trained recognition model for robotic grasping.
(4) What we did not cover
Perception by touch, the detailed physics of range sensors (LiDAR), estimation of the robot’s own position (SLAM) and perception for autonomous driving are covered in other articles of this series. Models that combine vision and language to output actions are covered in our article on robot foundation models and VLA.
- Perception is a chain of stages — sensor, point cloud, detection and segmentation, 6D pose, grasp — and a small error in one is carried into the next
- Stereo depth error grows as Z² / (f × B), so doubling the distance quadruples the error. Transparent, glossy and dark surfaces are typical cases where distance is hard to getSourcedOur calculation
- Detection metrics (IoU, AP) score box overlap; whether the robot can grasp is measured separately on a real machine. Stage success rates multiplyOur calculation
- A materials engineer may be able to change how hard perception is a great deal through surface finish, colour, lighting and cleanliness (commentary)
12. How to read the yardsticks and standards
The yardstick for robot vision differs by stage. A range sensor is judged by its error (the scatter about a fitted plane, for instance), detection by IoU and AP, pose by errors in position and orientation, and grasping by the success rate on a real machine. Each yardstick does not guarantee the results of another stage. For safety functions such as “detecting a person” there is a separate safety-standards framework that is distinct from AI recognition. The table lists what we could confirm (checked 25 October 2026).
| Item evaluated | Representative tests and benchmarks (name, source) | Standards, rules and guidance | Notes on reading |
|---|---|---|---|
| Accuracy of a depth sensor | One example of measuring the scatter about a fitted plane (RMS) at each distance (Keselman et al.) [Ref. 1]Sourced | Could not be confirmed (we could not confirm an international standard that defines the accuracy of depth cameras) | Values change with distance, resolution, frame rate and surface texture. For manufacturer’s values, check the conditions |
| Object detection and segmentation | COCO AP (average over IoU 0.50 to 0.95), AP50, AP75, by area [Ref. 11]. The dataset [Ref. 10]Sourced | ISO/IEC TS 4213:2022 “Assessment of machine learning classification performance” (published October 2022; the ISO page lists a draft of a revision) [Ref. 26]. We did not read the text, so we do not know whether it covers detection and segmentationSourcedNot yet confirmed | Conditioned by how the dataset was made and used. Box overlap does not tell you whether the robot can grasp |
| 6D pose | BOP (eight datasets, a common evaluation method) [Ref. 14], YCB-Video [Ref. 12]Sourced | Could not be confirmed | The handling of symmetric objects and occlusion affects the score. Real lighting and reflections can be harsher than the datasets (commentary) |
| Grasp success | The YCB object and model set and its benchmarking protocols (Calli et al.) [Ref. 13]; NIST SP 1227, a draft of performance metrics and test methods for robotic hands (2018) [Ref. 20]; real-robot trials of Dex-Net and Contact-GraspNet [Ref. 16, 17]Sourced | ISO 18646-3:2021 “Performance criteria and related test methods for service robots, Part 3: Manipulation” (grasp size, grasp strength, slip resistance, opening doors; indoor use; not for verifying safety requirements) [Ref. 21]Sourced | Success rates cannot be compared across different object sets, placements, hands and numbers of trials. A draft is not a settled requirement |
| Detecting people (safety) | — (this is a framework for safety devices, not an evaluation of AI perception) | IEC 61496-3:2025 (non-contact protective equipment that detects persons by near-infrared diffuse reflection; it does not address complex classification or outdoor use) [Ref. 22]. ISO 10218-1:2025 and ISO 10218-2:2025 (safety requirements for industrial robots) [Ref. 23, 24]Sourced | Do not leave the detection of people to learned image recognition alone. We could not confirm a standard that directly defines how to assess the safety of learned perception |
| Using AI in safety functions | — | ISO/IEC TR 5469:2024 “Artificial intelligence — Functional safety and AI systems” (a technical report describing properties, risk factors and methods for using AI inside safety-related functions, among other cases) [Ref. 25]Sourced | A technical report provides information; it is not a set of requirements. The text is paid, so we stay with the scope statement |
| Terminology | — | ISO 8373:2021 “Robotics — Vocabulary” (Edition 3, November 2021; a revision draft, ISO/DIS 8373, is listed) [Ref. 27]Sourced | Definitions can change between editions |
The arrangement of the table is Our calculation (organising). Numbers, titles, dates and stages of ISO and IEC standards were checked on the official pages (for IEC 61496-3, the IEC scope text shown on the page of the distributor AFNOR). The standards’ text is paid, so we stay with the scope statements.
Notes on reading (for materials engineers)
- Demonstrations, benchmarks and the shop floor are different things: the results of paper demos and public datasets are values for tidy lighting and chosen objects. Re-measure with your own parts, your own lighting and your own dirt
- Specified values and measured values are different: a camera’s distance accuracy and processing speed may be the manufacturer’s specification or a measurement in a paper; separate the two and check the conditions of distance, resolution and surface texture
- Is a standard a requirement, information or a draft? ISO 10218 sets safety requirements for industrial robots, ISO/IEC TR 5469 is a technical report that provides information, and NIST SP 1227 is a draft. “Conforms to a standard” does not mean learned perception is safe
- The scope of certification and approval: protective devices that detect people are assessed within the scope the standard defines (type of device, indoor or outdoor, what is detected). Outside that scope the result does not simply carry over
13. Glossary
- RGB image
- An ordinary colour image recorded in red, green and blue. It shows colour and texture but not distance directly.
- Depth image
- An image in which each pixel holds the distance from the camera.
- RGB-D
- A sensor or data that provides a colour image (RGB) and a depth image (D) together.
- Stereo vision
- Finding distance from the shift (disparity) between the images of two cameras.
- Disparity
- How many pixels a point shifts between the left and right images. Larger for nearer points.
- Baseline
- The spacing between the two cameras of a stereo pair.
- Focal length
- A length describing the lens. Here it is expressed in pixels.
- Point cloud
- A set of 3D points (x, y, z), made from a depth image.
- Object detection
- Marking the objects in an image with boxes and labels.
- Segmentation
- Indicating, for each pixel, which object (or background) it belongs to.
- Instance segmentation
- Segmentation that separates objects of the same kind one by one.
- IoU (intersection over union)
- The degree of overlap between a predicted and a true region (overlap area / combined area), between 0 and 1.
- AP / mAP
- A single number summarising detection quality. COCO averages it over classes and IoU thresholds.
- 6D pose
- The six values that give an object’s position (three numbers) and orientation (three rotations).
- Grasping
- Holding an object in the hand or gripper.
- Grasp candidate
- A proposal for where, at what angle and at what opening width the hand should close.
- Open-vocabulary detection
- Detection that can look for objects named in words, not only the categories fixed at training.
- Synthetic data
- Training images or data made by computer.
- Distribution shift
- When the situation of use differs in character from the training data.
- ICP
- Iterative closest point: a method that aligns two point clouds step by step by matching nearby points.
- AOPDDR
- Active opto-electronic protective device responsive to diffuse reflection: a protective device that detects intrusion by near-infrared light; safety laser scanners are an example.
14. References
- Keselman L. et al. “Intel RealSense Stereoscopic Depth Cameras”, arXiv:1705.05548 (2017) — arxiv.org/abs/1705.05548
- Qi C. R. et al. “PointNet: Deep Learning on Point Sets for 3D Classification and Segmentation”, arXiv:1612.00593 (2016; CVPR 2017) — arxiv.org/abs/1612.00593
- Besl P. J., McKay N. D. “A method for registration of 3-D shapes”, IEEE Trans. Pattern Anal. Mach. Intell. 14, 239–256 (1992), DOI 10.1109/34.121791 — doi.org/10.1109/34.121791
- Redmon J. et al. “You Only Look Once: Unified, Real-Time Object Detection”, arXiv:1506.02640 (2015) — arxiv.org/abs/1506.02640
- He K. et al. “Mask R-CNN”, arXiv:1703.06870 (2017) — arxiv.org/abs/1703.06870
- Carion N. et al. “End-to-End Object Detection with Transformers”, arXiv:2005.12872 (2020) — arxiv.org/abs/2005.12872
- Kirillov A. et al. “Segment Anything”, arXiv:2304.02643 (2023) — arxiv.org/abs/2304.02643
- Ravi N. et al. “SAM 2: Segment Anything in Images and Videos”, arXiv:2408.00714 (2024) — arxiv.org/abs/2408.00714
- Liu S. et al. “Grounding DINO: Marrying DINO with Grounded Pre-Training for Open-Set Object Detection”, arXiv:2303.05499 (2023) — arxiv.org/abs/2303.05499
- Lin T.-Y. et al. “Microsoft COCO: Common Objects in Context”, arXiv:1405.0312 (2014; ECCV 2014) — arxiv.org/abs/1405.0312
- COCO Consortium “Detection Evaluation” (the metrics used by COCO). Checked 25 October 2026 — cocodataset.org/#detection-eval
- Xiang Y. et al. “PoseCNN: A Convolutional Neural Network for 6D Object Pose Estimation in Cluttered Scenes”, arXiv:1711.00199 (2017) — arxiv.org/abs/1711.00199
- Calli B. et al. “Benchmarking in Manipulation Research: The YCB Object and Model Set and Benchmarking Protocols”, arXiv:1502.03143 (2015) — arxiv.org/abs/1502.03143
- Hodan T. et al. “BOP: Benchmark for 6D Object Pose Estimation”, arXiv:1808.08319 (2018; ECCV 2018) — arxiv.org/abs/1808.08319
- Wen B. et al. “FoundationPose: Unified 6D Pose Estimation and Tracking of Novel Objects”, arXiv:2312.08344 (2023) — arxiv.org/abs/2312.08344
- Mahler J. et al. “Dex-Net 2.0: Deep Learning to Plan Robust Grasps with Synthetic Point Clouds and Analytic Grasp Metrics”, arXiv:1703.09312 (2017; RSS 2017) — arxiv.org/abs/1703.09312
- Sundermeyer M. et al. “Contact-GraspNet: Efficient 6-DoF Grasp Generation in Cluttered Scenes”, arXiv:2103.14127 (2021) — arxiv.org/abs/2103.14127
- Sajjan S. et al. “ClearGrasp: 3D Shape Estimation of Transparent Objects for Manipulation”, arXiv:1910.02550 (2019) — arxiv.org/abs/1910.02550
- Yang L. et al. “Depth Anything V2”, arXiv:2406.09414 (2024) — arxiv.org/abs/2406.09414
- Falco J., Van Wyk K., Messina E. “Performance Metrics and Test Methods for Robotic Hands (Draft)”, NIST Special Publication 1227 (draft), 2018 — doi.org/10.6028/NIST.SP.1227-draft
- ISO ISO 18646-3:2021 “Robotics — Performance criteria and related test methods for service robots — Part 3: Manipulation” (Edition 1, June 2021). Checked 25 October 2026 — iso.org/standard/73591.html
- IEC IEC 61496-3:2025 “Safety of machinery — Electro-sensitive protective equipment — Part 3: Particular requirements for active opto-electronic protective devices responsive to diffuse reflection (AOPDDR)” (August 2025; scope text as shown by the distributor AFNOR). Checked 25 October 2026 — boutique.afnor.org (IEC 61496-3:2025)
- ISO ISO 10218-1:2025 “Robotics — Safety requirements — Part 1: Industrial robots” (Edition 3, February 2025). Checked 25 October 2026 — iso.org/standard/73933.html
- ISO ISO 10218-2:2025 “Robotics — Safety requirements — Part 2: Industrial robot applications and robot cells” (Edition 2, February 2025). Checked 25 October 2026 — iso.org/standard/73934.html
- ISO/IEC ISO/IEC TR 5469:2024 “Artificial intelligence — Functional safety and AI systems” (Edition 1, January 2024). Checked 25 October 2026 — iso.org/standard/81283.html
- ISO/IEC ISO/IEC TS 4213:2022 “Information technology — Artificial intelligence — Assessment of machine learning classification performance” (October 2022). Checked 25 October 2026 — iso.org/standard/79799.html
- ISO ISO 8373:2021 “Robotics — Vocabulary” (Edition 3, November 2021). Checked 25 October 2026 — iso.org/standard/75539.html
15. Claim-to-source audit
| Claim in the text | Basis | Class |
|---|---|---|
| The stereo distance relation Z = f × B / d, the depth error growing as Z² / (f × B) times the disparity error, and treating the disparity error as about 0.1 pixel | Keselman et al. (Eqs. 1-3) Reference 1 https://arxiv.org/abs/1705.05548 | Sourced |
| The R200 measured example: 2.1 mm at 1 m and 8.0 mm at 2 m (480 x 360, 30 Hz); a baseline of about 70 mm; a filter on the left and right cameras that blocks light below about 840 nm | Keselman et al. (Table 5, Section 2) Reference 1 https://arxiv.org/abs/1705.05548 | Sourced |
| The depth-error table (0.5 to 5 m), the point-cloud data volume, the length covered by one pixel, the IoU of 0.59 and the product of stage success rates (83.8%, etc.) | Our calculation (Python; assumed f = 600 px, B = 70 mm, disparity error = 0.1 px; stage success rates are illustrative assumptions). Not results for any real device or system | Our calculation |
| A monocular depth-estimation model that estimates depth from a single image (Depth Anything V2), trained by replacing all labelled real images with synthetic ones | Yang et al. (abstract) Reference 19 https://arxiv.org/abs/2406.09414 | Sourced |
| That a point cloud is an unordered set of points and that a network taking it directly as input (PointNet) was proposed; the classic method for aligning two point clouds (ICP) | Qi et al. (abstract); Besl and McKay (title and bibliographic data) Reference 2 https://arxiv.org/abs/1612.00593 Reference 3 https://doi.org/10.1109/34.121791 | Sourced |
| That YOLO treats detection as regression in a single network and runs at 45 frames per second (base model); that Mask R-CNN adds a mask branch to box prediction and runs at about 5 fps; that DETR treats detection as set prediction | Redmon et al.; He et al.; Carion et al. (abstracts) Reference 4 https://arxiv.org/abs/1506.02640 Reference 5 https://arxiv.org/abs/1703.06870 Reference 6 https://arxiv.org/abs/2005.12872 | Sourced |
| That Segment Anything is a promptable segmentation model trained with a dataset of over a billion masks on 11 million images; that SAM 2 handles images and video; that Grounding DINO is an open-set detector that finds objects named in words | Kirillov et al.; Ravi et al.; Liu et al. (abstracts) Reference 7 https://arxiv.org/abs/2304.02643 Reference 8 https://arxiv.org/abs/2408.00714 Reference 9 https://arxiv.org/abs/2303.05499 | Sourced |
| The COCO metrics: AP averaged over 10 IoU thresholds (0.50 to 0.95 in steps of 0.05) and 80 categories, AP at IoU 0.50 and 0.75, the small/medium/large area classes (32² and 96² pixels), and at most 100 detections per image; that the COCO dataset has 328,000 images and 2.5 million labelled instances | COCO evaluation page; Lin et al. (abstract) Reference 11 https://cocodataset.org/#detection-eval Reference 10 https://arxiv.org/abs/1405.0312 | Sourced |
| PoseCNN and the YCB-Video dataset (21 objects, 92 videos, 133,827 frames); that the YCB object and model set was made for benchmarking manipulation research; that BOP evaluated 15 methods on eight datasets; that FoundationPose works on new objects from a CAD model or a few reference images | Xiang et al.; Calli et al.; Hodan et al.; Wen et al. (abstracts) Reference 12 https://arxiv.org/abs/1711.00199 Reference 13 https://arxiv.org/abs/1502.03143 Reference 14 https://arxiv.org/abs/1808.08319 Reference 15 https://arxiv.org/abs/2312.08344 | Sourced |
| Dex-Net 2.0: trained on 6.7 million synthetic point clouds, more than 1,000 real trials, a 93% success rate on eight known objects, and 0.8 s to plan a grasp | Mahler et al. (abstract) Reference 16 https://arxiv.org/abs/1703.09312 | Sourced |
| Contact-GraspNet: trained on 17 million simulated grasps, over 90% success on unseen objects in structured clutter, halving the failure rate relative to a recent method | Sundermeyer et al. (abstract) Reference 17 https://arxiv.org/abs/2103.14127 | Sourced |
| That transparent objects are hard for standard 3D sensors, giving noisy values resembling the surface behind; ClearGrasp’s synthetic dataset (over 50,000 images) and 286 real test images | Sajjan et al. (abstract) Reference 18 https://arxiv.org/abs/1910.02550 | Sourced |
| The title, publication (June 2021, Edition 1) and scope of ISO 18646-3:2021 (grasp size, grasp strength, slip resistance, opening doors); indoor use, not for verifying or validating safety requirements | ISO page Reference 21 https://www.iso.org/standard/73591.html | Sourced |
| The title and year (2018) of NIST SP 1227 (draft) | NIST publication page Reference 20 https://doi.org/10.6028/NIST.SP.1227-draft | Sourced |
| The title, publication (August 2025) and scope of IEC 61496-3:2025 (non-contact protective equipment detecting persons by near-infrared diffuse reflection; it does not address complex classification or outdoor use) | The IEC scope text shown on the AFNOR page (a distributor of IEC standards) Reference 22 https://www.boutique.afnor.org/en-gb/standard/iec-6149632025/safety-of-machinery-electrosensitive-protective-equipment-part-3-particular/xs305084/449130 | Sourced |
| The numbers, titles and stages of ISO 10218-1:2025 and ISO 10218-2:2025 (safety requirements for industrial robots, February 2025), ISO/IEC TR 5469:2024 (functional safety and AI; a technical report), ISO/IEC TS 4213:2022 (assessment of classification performance; a revision is in draft) and ISO 8373:2021 (robot vocabulary; a revision is in draft) | ISO pages Reference 23 https://www.iso.org/standard/73933.html Reference 24 https://www.iso.org/standard/73934.html Reference 25 https://www.iso.org/standard/81283.html Reference 26 https://www.iso.org/standard/79799.html Reference 27 https://www.iso.org/standard/75539.html | Sourced |
| The readings that errors in perception carry into later stages, that surfaces (matte, glossy, very dark) change how things look, that camera and light placement can decide success, and that AI recognition should not be used as-is as a safety function | This article’s commentary based on the published material; not views stated by the institutions | Commentary |
| The text of the standards, statistics on failure rates of image recognition on real machines, comparisons of the recognition performance of specific products, market size | Not included because they could not be confirmed from primary sources within this article’s research (commentary) | Commentary |
| That Figures 1 and 8 are frames for AI-generated images, Figures 2, 3 and 7 are explanatory concept diagrams, and Figures 4, 5 and 6 contain our calculations | This article’s own note | Commentary |
Last updated: 25 October 2026 / Sources are limited to primary material (arXiv papers, the COCO evaluation page, and the official NIST, ISO and IEC pages). We could not read the text of the ISO and IEC standards because it is paid. The numerical examples are calculations from values we assumed and are not the performance of any real camera or robot. We could not confirm, and so do not state, the accuracy of depth sensors as products, statistics on failure rates of image recognition on real machines, or a standard that directly defines the safety assessment of learned perception. Figures 1 and 8 are ImageGen-generated conceptual illustrations; the other figures are explanatory concept diagrams or figures containing our calculations.