SEMICONDUCTOR FABRICATION · INTRODUCTION 1-4
How a chip is made
The manufacturing journey and the industry behind it
A chip looks like a single object. Making it takes hundreds of carefully controlled operations, repeated across a wafer, and a network of specialist companies. Follow the journey from circuit design to a tested package, then look inside the chip to see what those operations actually build.
- 1. The whole journey in three ideas
- 2. From an idea to a finished package
- 3. Why a fab has to be so clean
- 4. Yield: how many dies actually work?
- 5. Why wafer diameter changes the economics
- 6. Who does what in the semiconductor industry?
- 7. New capacity in Japan: JASM and Rapidus
- 8. Where the rest of the series fits
- 9. Check your understanding
- 10. A short glossary
- 11. Sources and reading notes
- 12. Evidence map and calculation assumptions
Begin with the main text. The shaded physics boxes add optional detail and worked estimates. Figures are conceptual and not to scale. Numbered links lead to the supporting sources.
- Trace a chip from design through wafer fabrication, testing and packaging.
- Identify the transistors, contacts and wiring in a chip cross-section.
- Explain why cleanliness, die size and wafer size affect manufacturing economics.
- Distinguish fabless firms, foundries, IDMs and OSATs, and recognise the suppliers behind them.
1. The whole journey in three ideas
Design decides what the chip will do. Fabrication builds the devices and wiring. Assembly turns each working die into something a product can use. Testing checks the result at several stages.
A wafer fab does not print a complete circuit in one pass. It adds material, patterns it, removes selected parts and changes electrical properties, repeating the appropriate operations until the required structure exists. The sequence depends on the product; it is not one universal loop.
The work is usually shared. A company whose name appears on a processor may design the chip while other businesses fabricate the wafer, package the dies and supply the machinery, software and materials. Understanding those roles makes semiconductor news much easier to follow.
2. From an idea to a finished package
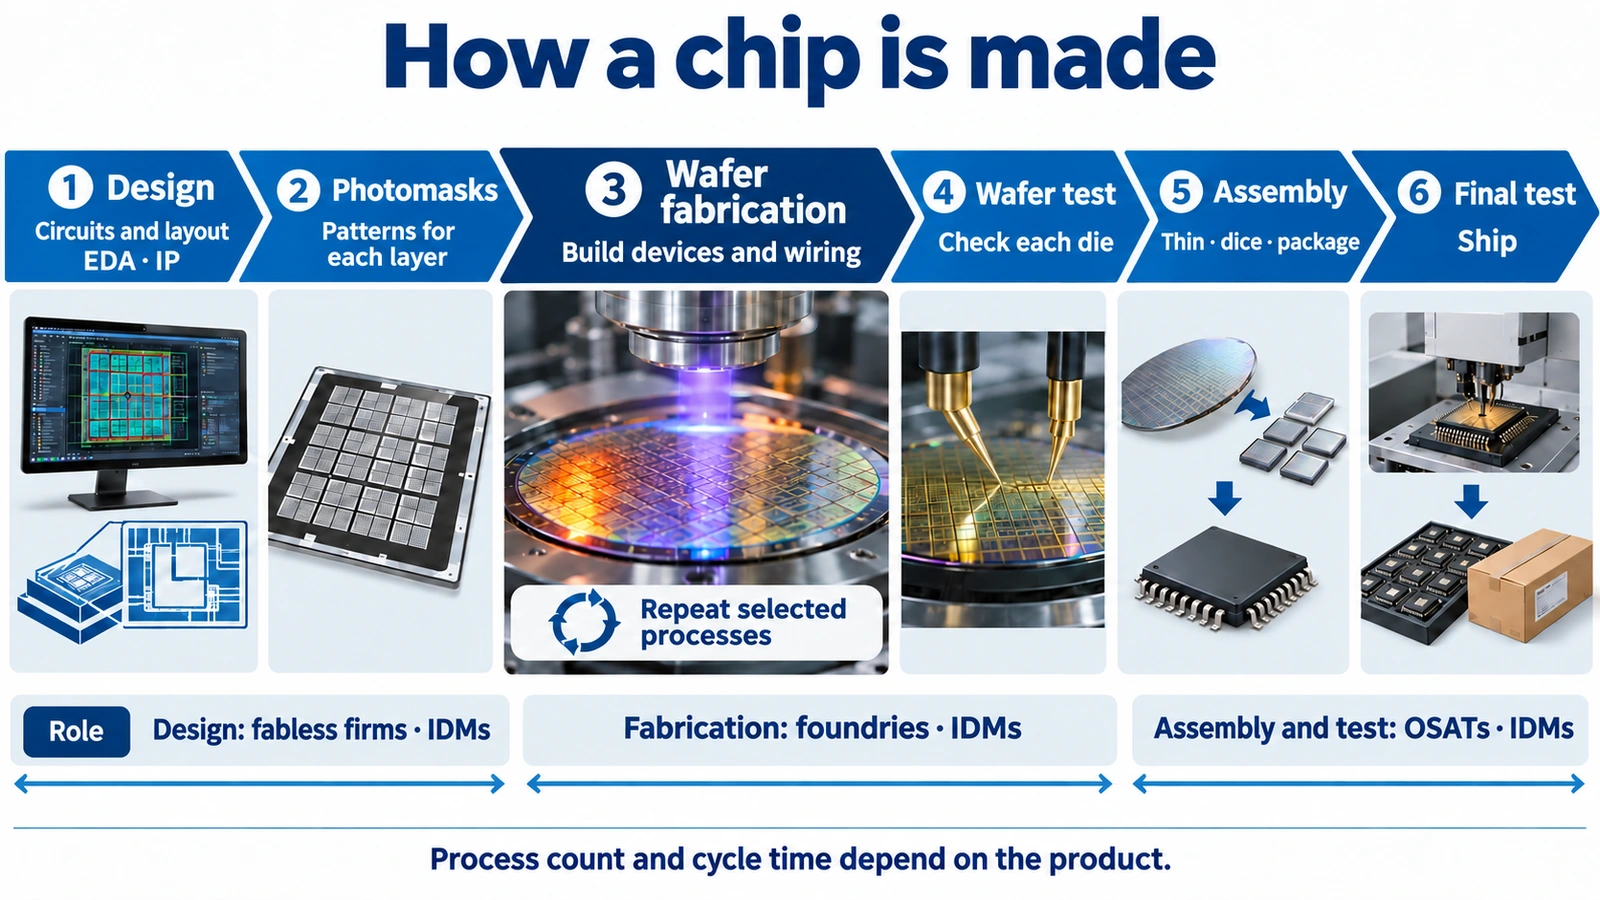
Design: turn a useful function into a manufacturable layout
Start with a job: perhaps processing camera images, controlling a motor or running a computer. Engineers choose a circuit architecture, develop the logic and check that it behaves correctly. For a complex chip, this work relies on electronic design automation (EDA) software. Designers also license reusable intellectual property (IP) blocks, such as processor cores, instead of developing every element themselves.
The circuit must eventually become a layout: geometric patterns assigned to different manufacturing layers. These patterns tell the fab where to form devices, openings and wires. Handing the final design data over for manufacture is known as tape-out. The name survives from an earlier era of data storage; today the delivery is digital.
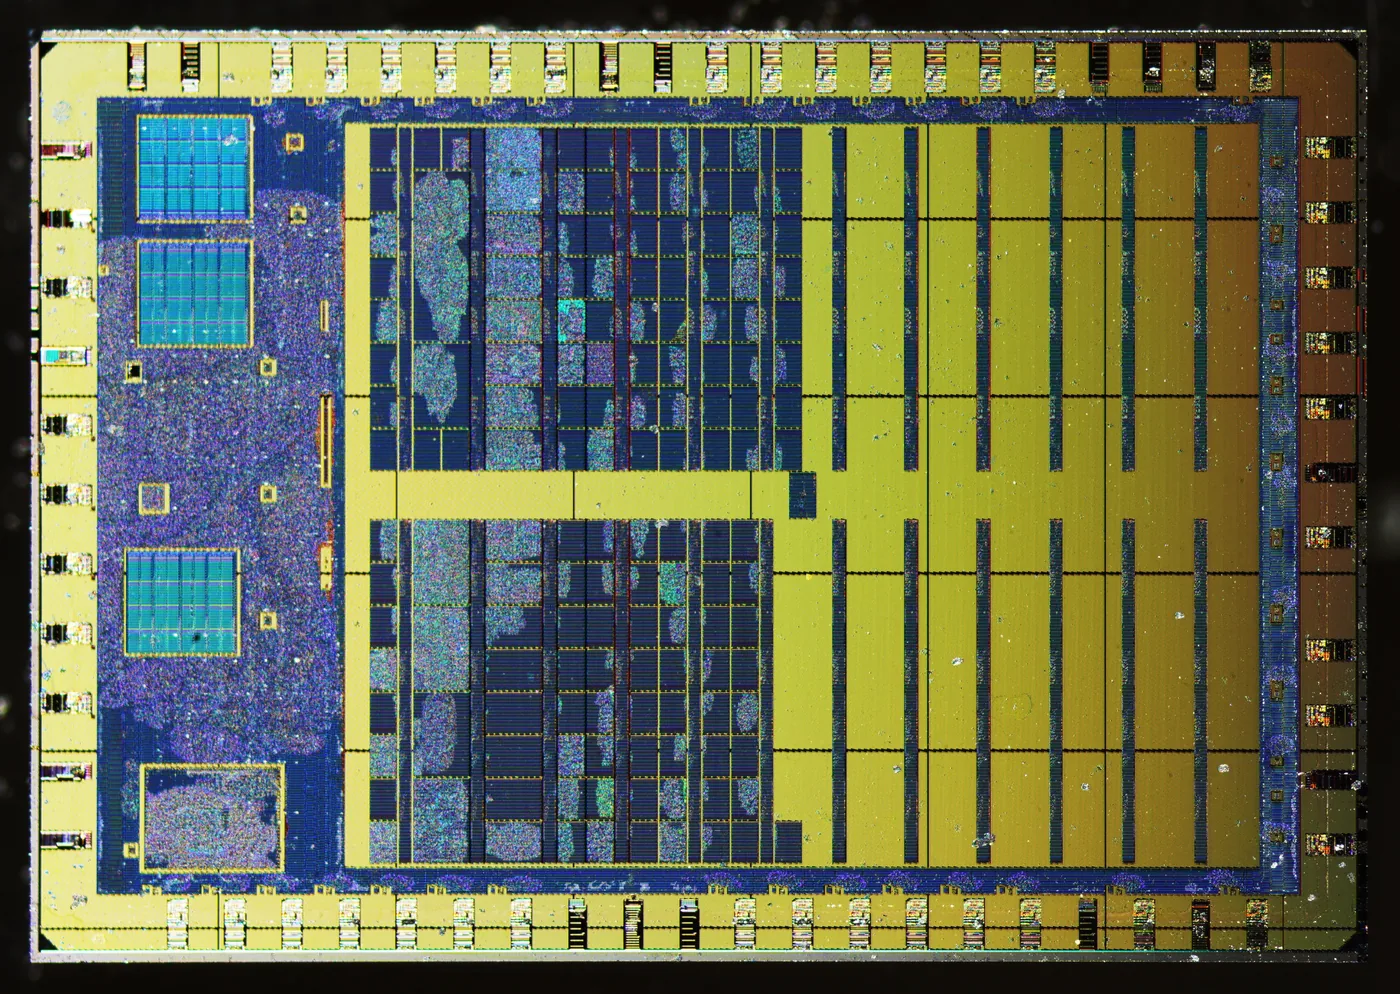
Image: Zeptobars; Mikhail Svarichevsky / Wikimedia Commons / CC BY 3.0.
Photomasks: make the patterns repeatable
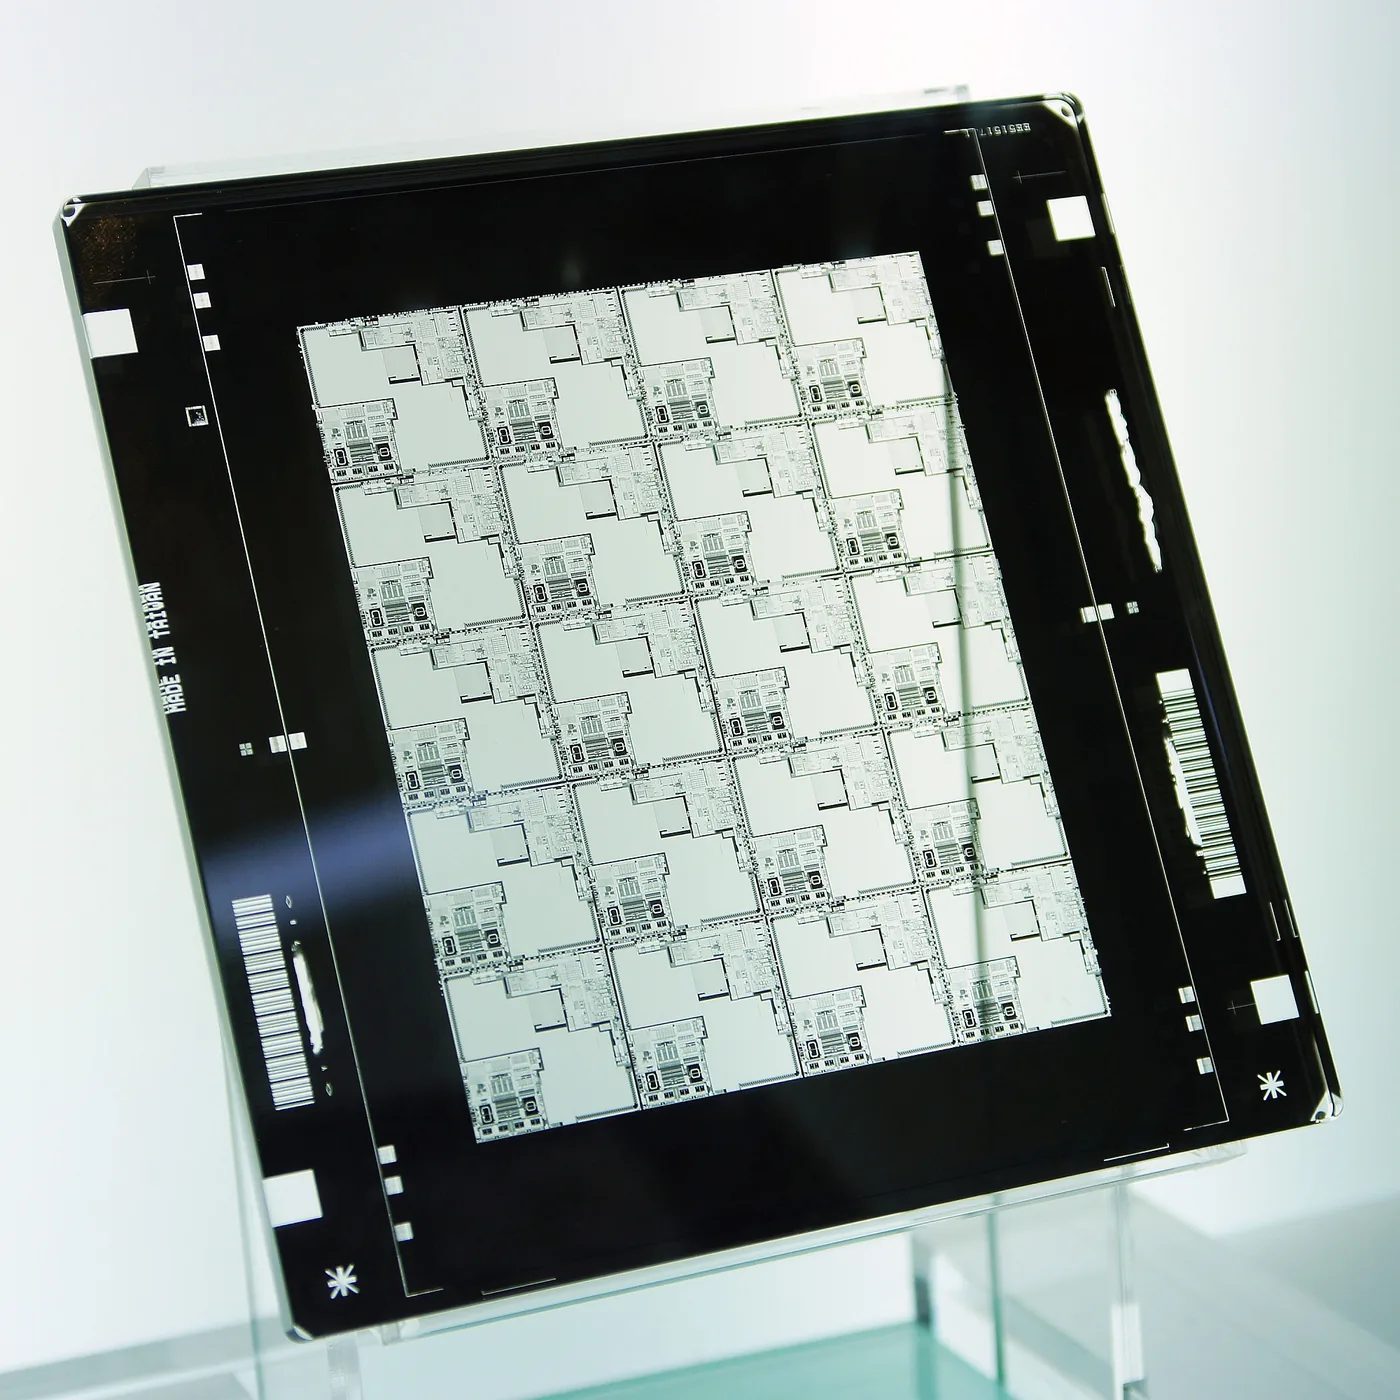
Image: Peellden / Wikimedia Commons / CC BY-SA 3.0.
A photomask, often called a reticle in this context, carries the pattern for an exposure. In conventional optical lithography, light passes through selected areas of a patterned quartz substrate. Extreme ultraviolet (EUV) lithography instead uses a reflective multilayer mask. In both cases the exposure transfers a pattern into a light-sensitive coating called photoresist on the wafer.
Think of a mask as a reusable master rather than a complete chip blueprint printed in one go. Different layers need different patterns, and some structures require more than one patterning operation. Reusing the master across many exposures is part of what makes mass production possible.
Wafer fabrication: build the devices and their connections
This is the main subject of the series. Wafer fabrication, also called wafer processing or front-end manufacturing, creates the transistors and interconnects before individual dies are separated and packaged. ASML describes modern chips as having up to 100 layers that must be aligned with nanometre precision. This is a broad description of the manufactured structure, not a claim that every chip has 100 metal wiring levels. [1]
| Operation | What it changes | Why it matters |
|---|---|---|
| Deposition | Adds a thin film of material | Provides conductors, insulators and other functional layers |
| Lithography | Defines a pattern in photoresist | Selects where a subsequent operation should act |
| Etching | Removes selected material | Creates openings, trenches and shaped structures |
| Ion implantation | Introduces dopant atoms into selected regions | Changes electrical properties where the device needs it |
| CMP | Chemically and mechanically polishes a surface | Restores the flatness required by later processing |
| Cleaning | Removes contamination and residues | Helps the next step work on the intended surface |
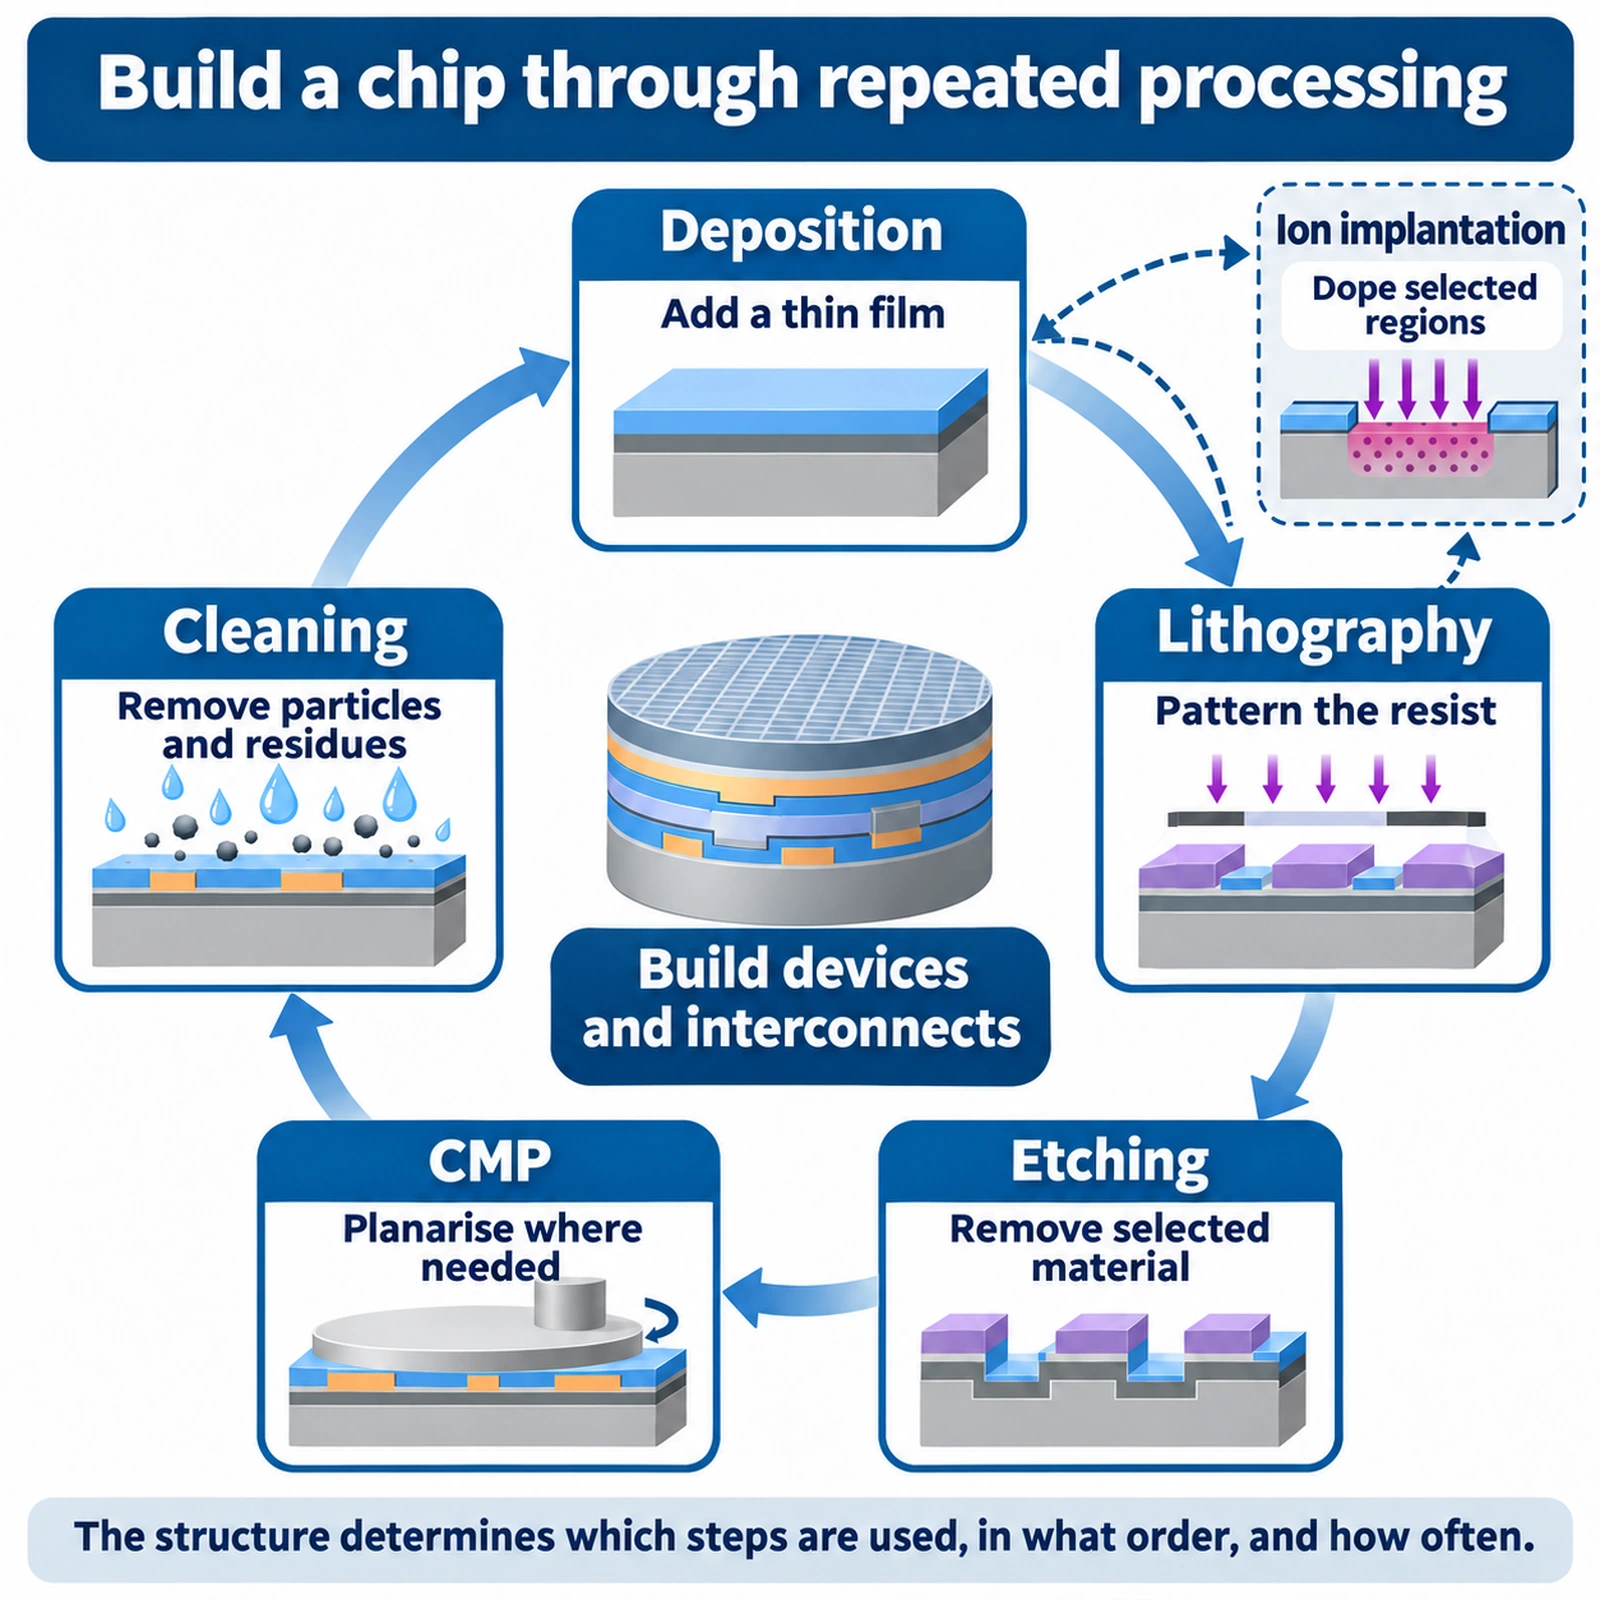
These are process families, not a recipe that must be followed in this order for every layer. Cleaning, inspection and measurement occur repeatedly between other operations. Some steps are specific to device formation; others recur while building the wiring stack.
A 2021 SIA/BCG report gives a range of 400–1,400 manufacturing steps, depending on the product, and an average front-end cycle time of about 12 weeks, rising to 14–20 weeks for advanced products. Japan’s Ministry of Economy, Trade and Industry (METI) similarly describes manufacturing as involving more than 1,000 steps. These are source-specific descriptions of the scale of the task, not a delivery promise for an individual chip. [2][3]
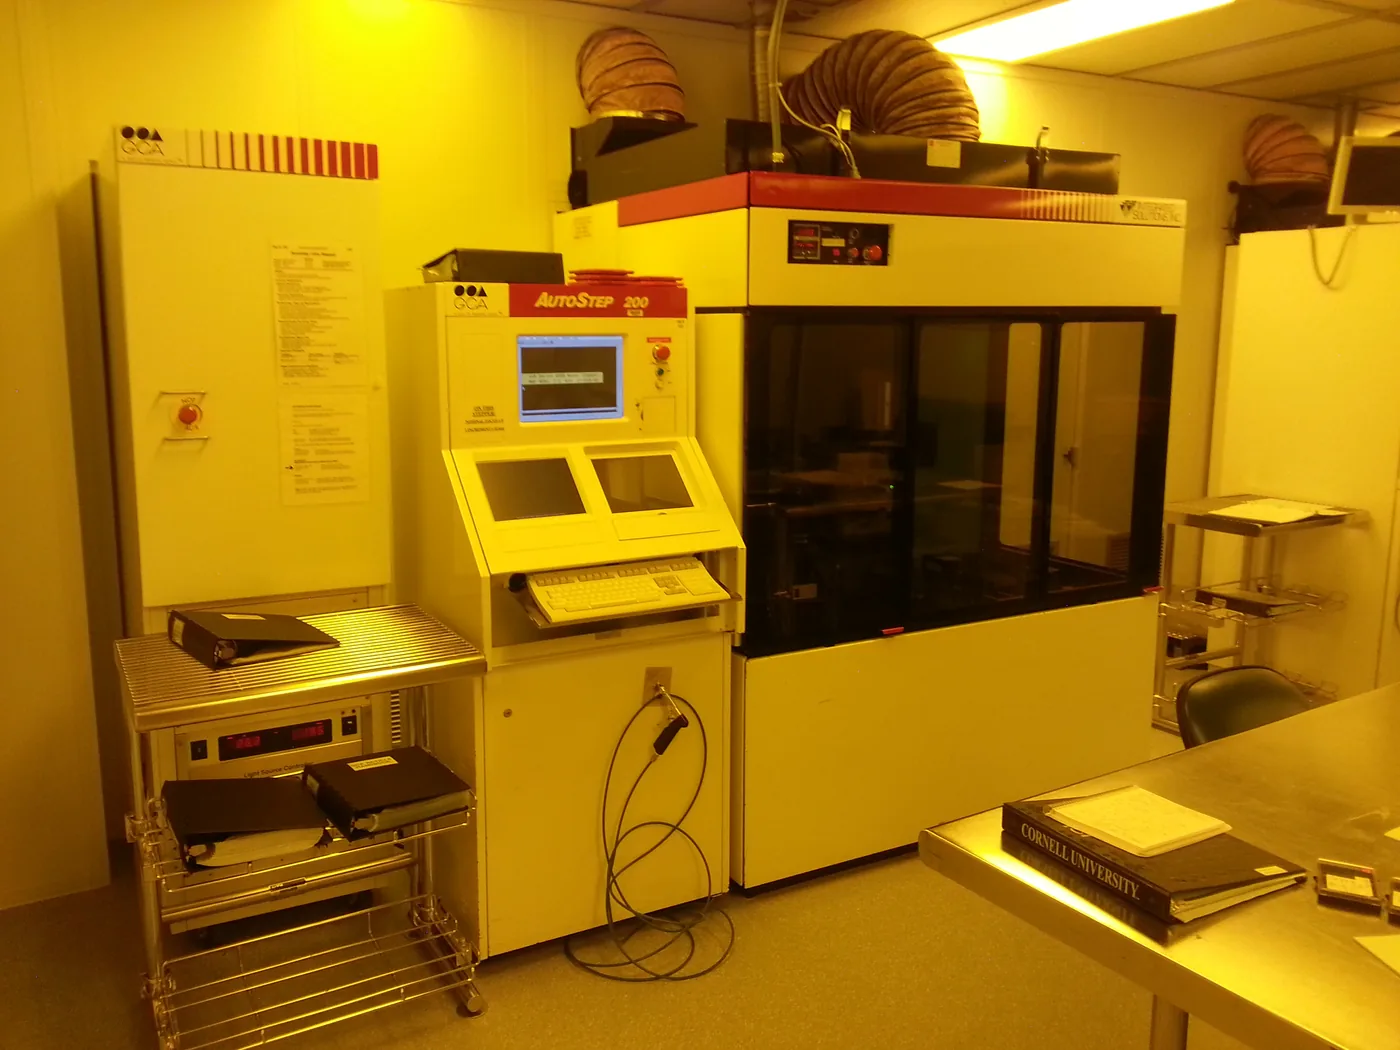
Image: a13ean / Wikimedia Commons / CC BY-SA 3.0.
Look inside: devices below, wiring above
The easiest way to connect the process names to a real structure is to imagine slicing a chip vertically. At the bottom are the devices that control current. Above them are contacts and a stack of wiring layers. Together they turn isolated transistors into a functioning circuit.
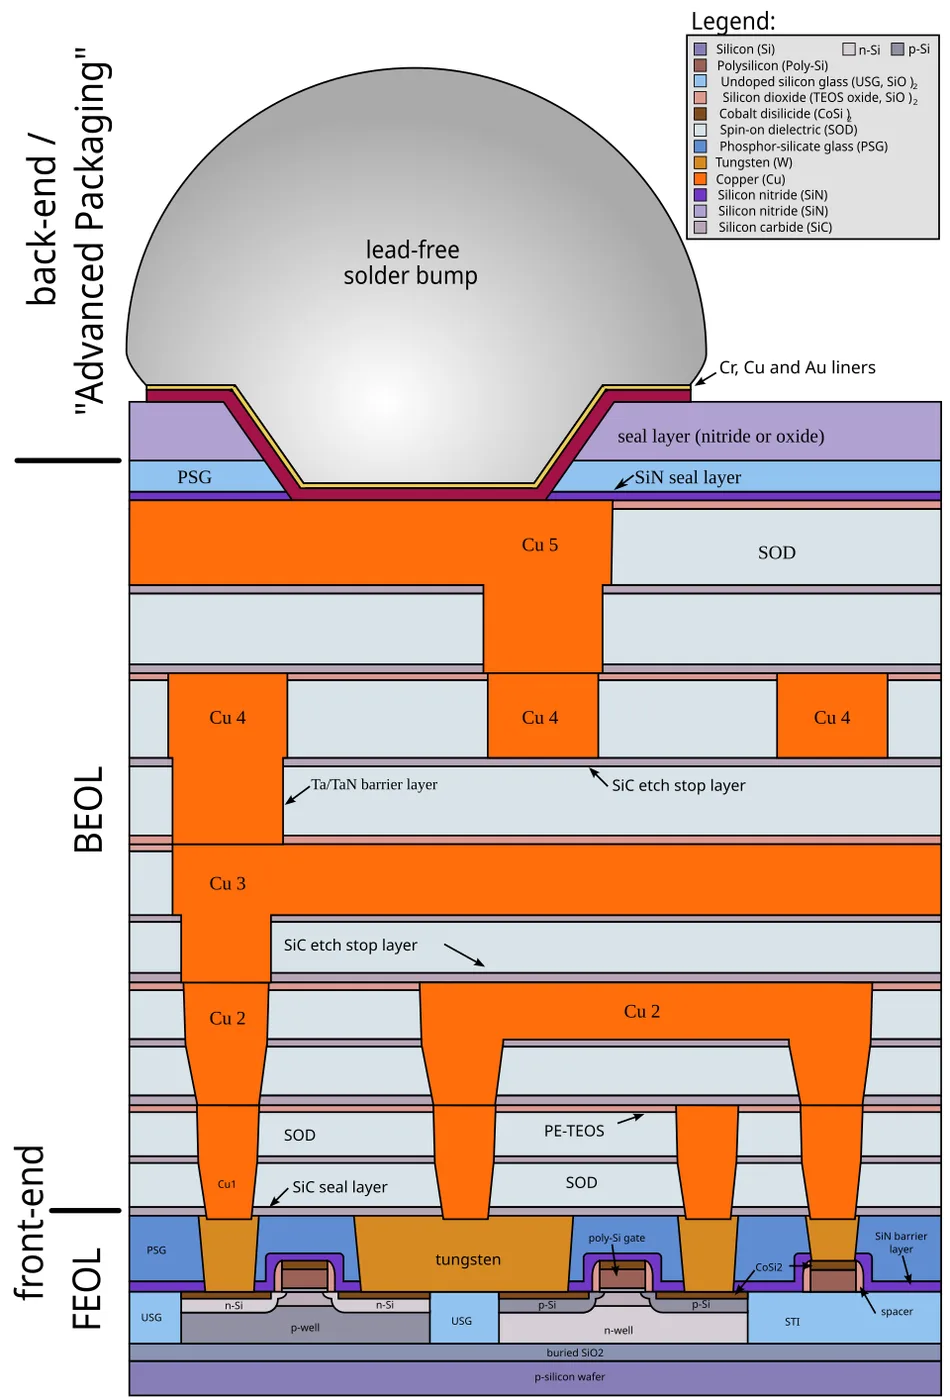
Image: Cepheiden / Wikimedia Commons / CC BY 2.5.
Researchers commonly divide the structure into three regions. Imec uses the following distinction. [17]
| Region | What is made there? | Where to look in the cross-section |
|---|---|---|
| FEOL: front-end-of-line | Active devices, including the transistors | At the silicon surface |
| MOL: middle-of-line | Contacts that connect device terminals to the wiring | Immediately above the devices |
| BEOL: back-end-of-line | The interconnect network for signals, clocks, power and ground | The wiring stack above the contacts |
BEOL is part of wafer fabrication. Here “back-end-of-line” means the wiring stage within the wafer process. It does not mean the later assembly and packaging stage, which is also often called back-end manufacturing. Keeping those two uses separate prevents considerable confusion.
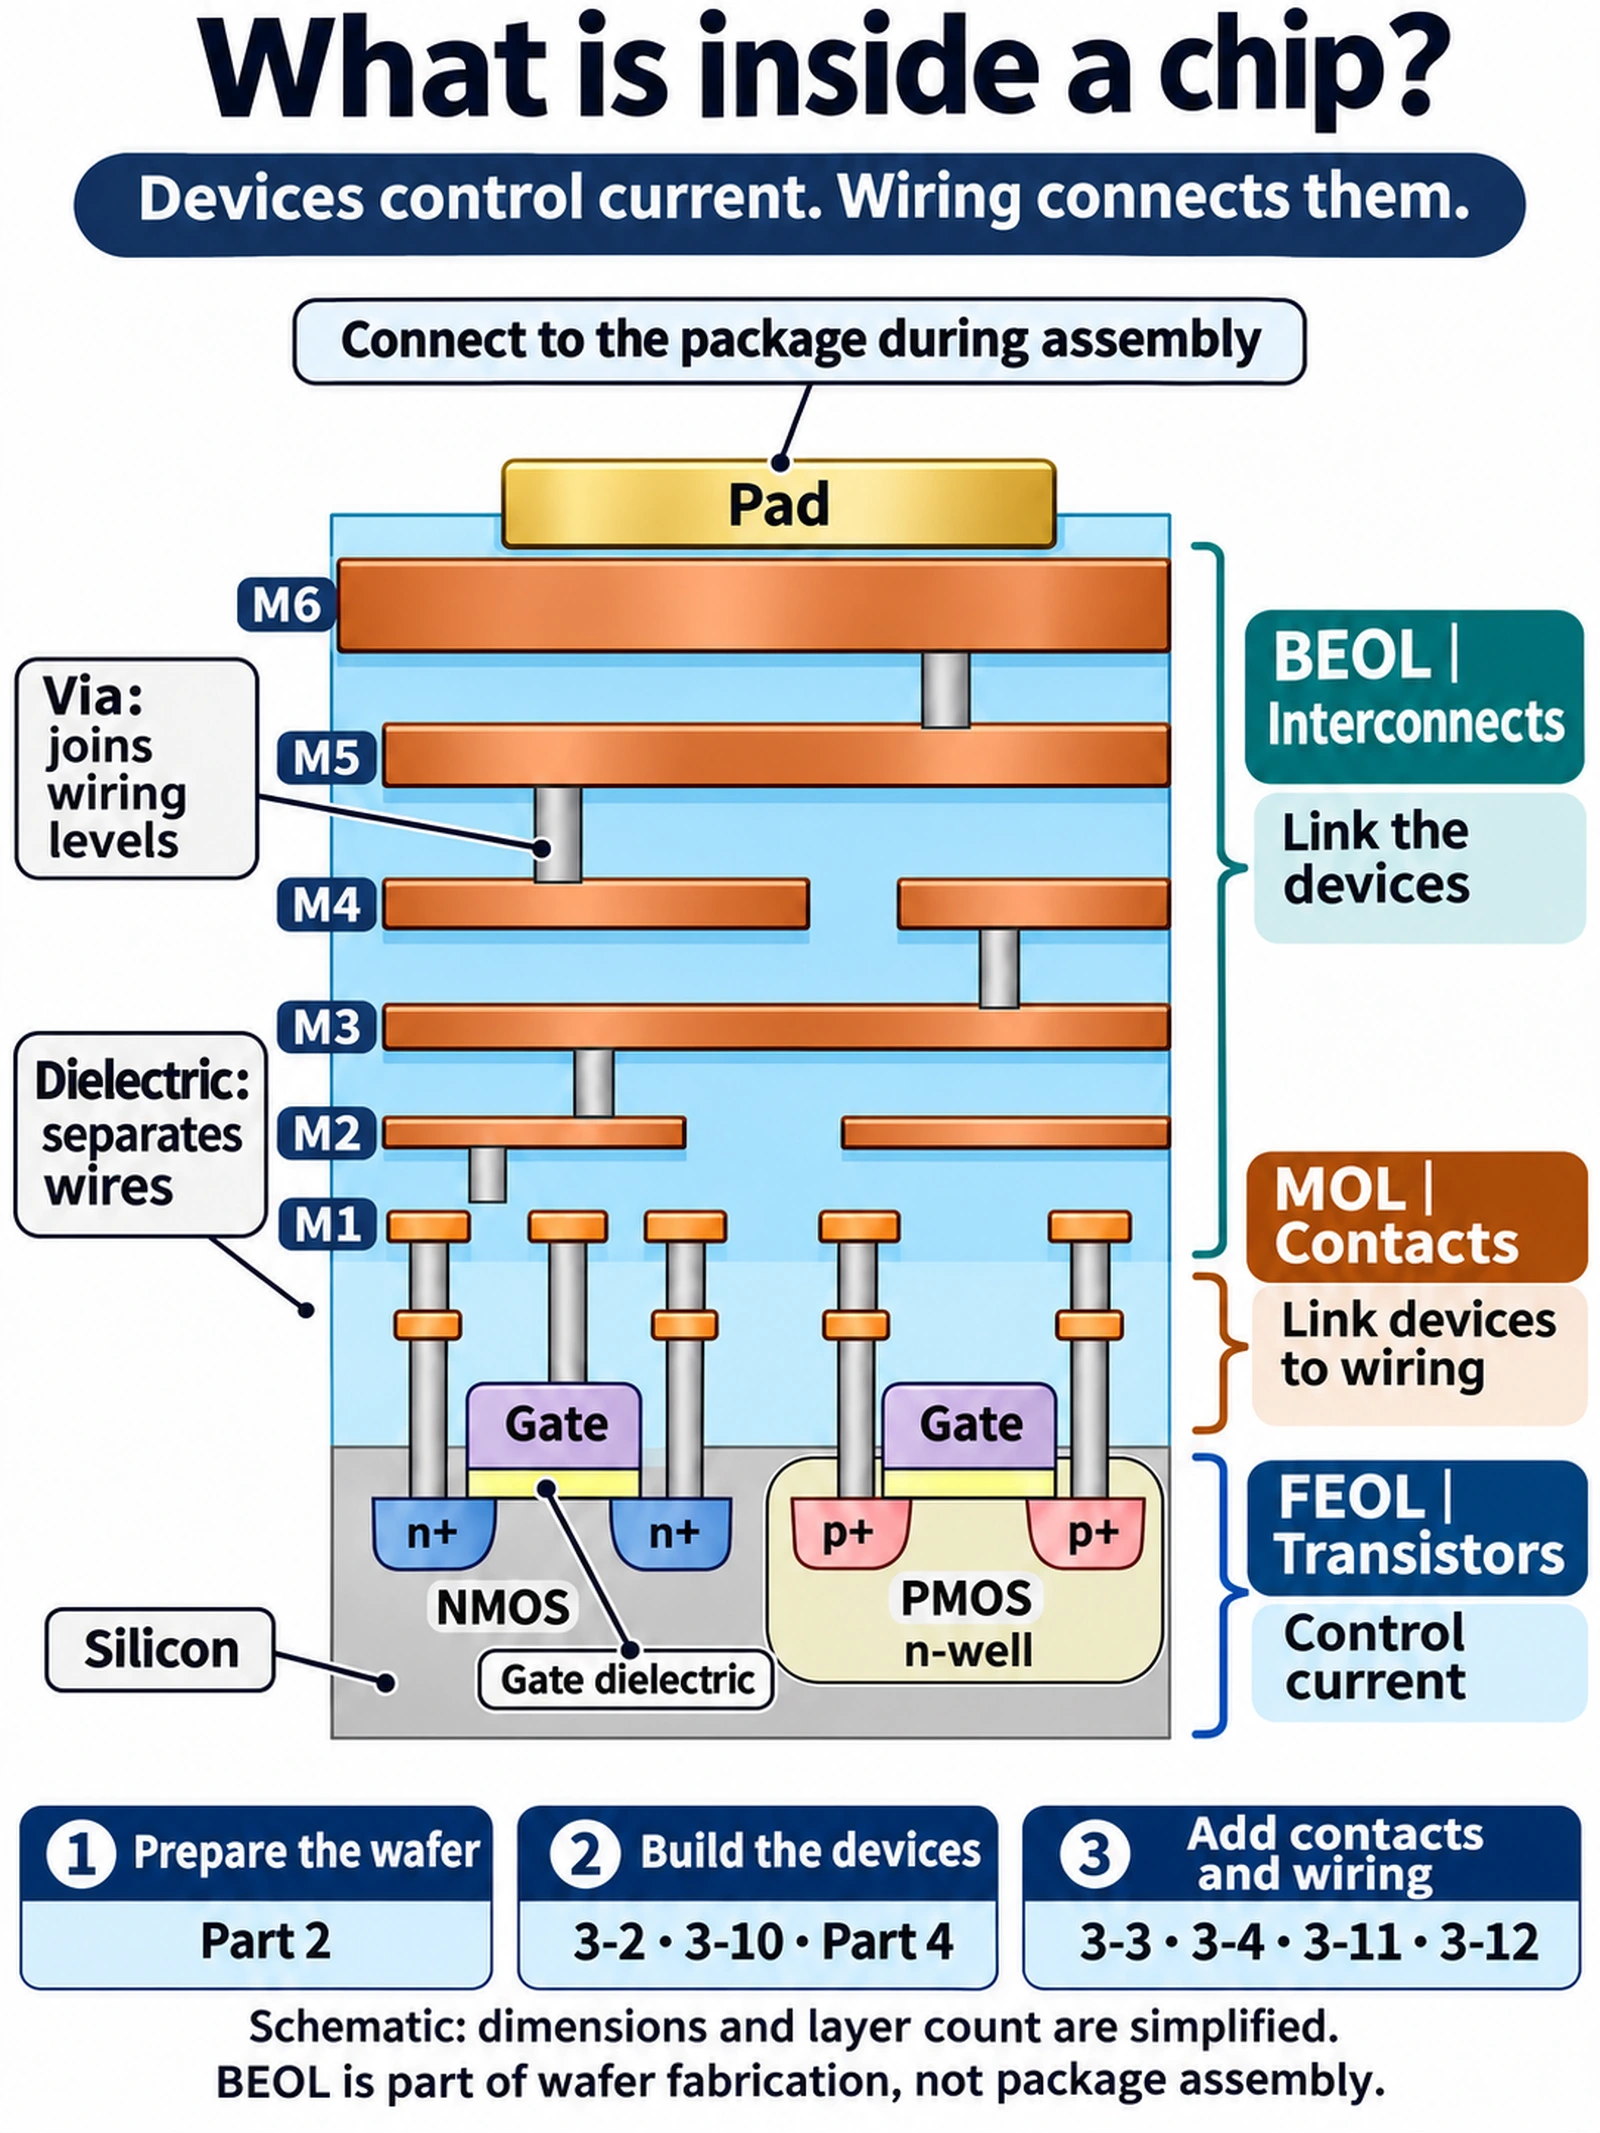
A transistor controls current between its source and drain; the gate controls that behaviour. Contacts bring its terminals into the wiring network. Horizontal metal lines connect different parts of the circuit, while vias join selected wiring levels vertically. Dielectric material separates conductors that should not touch.
The drawing uses planar transistors and six metal levels to keep those roles visible. It is not a complete working circuit. Connections can continue out of the plane of the section, and modern chips can use three-dimensional transistor structures and many more wiring levels. The thin gate dielectric separates the gate electrode from the channel. The drawing shows conventional front-side wiring; backside power delivery is a different arrangement, discussed below.
Why the wires matter as much as the switches
A fast transistor is useful only if its signals and power can get where they are needed. The lowest wiring levels make dense local connections. Higher levels are generally thicker and more widely spaced, supporting longer routes and larger currents. Imec describes stacks reaching around 15 levels, with three to six local levels, while another discussion uses 15–20 BEOL levels. Those are examples, not a fixed count for all products. [17][18][19]
Long, thin wires have more resistance: R = ρL/A, where L is length and A is cross-sectional area. Neighbouring conductors also store charge through their capacitance. Together, resistance and capacitance create RC delay. A narrower transistor does not automatically make a long wire faster.
That explains two important material choices. Copper has lower resistivity than aluminium, and low-k dielectrics reduce capacitance between wires. IBM’s account of its 1997 copper introduction reports roughly 40% lower resistance and a 15% processor speed improvement in that historical implementation; those figures are not universal gains for every chip. [20] Imec’s 2017 discussion also anticipated more than a 30% rise in interconnect delay in moving from the 10 nm to the 7 nm generation. Read that as a dated example of the problem, not a forecast newly made today. [21]
Power delivery faces a related difficulty. In a conventional front-side network, power reaches the devices through the metal stack, with increasingly fine wires and vias near the transistors. Resistance causes voltage loss along the route. Backside power delivery moves the power network to the opposite side of the wafer, separating it from much of the signal wiring and opening a more direct route to the devices. Imec’s 2022 article discusses the building blocks and the planned use of such approaches at 2 nm and beyond. Adoption depends on the manufacturer and process; the node label alone does not guarantee a particular power architecture. [18]
Wafer test: find defective dies before paying to package them
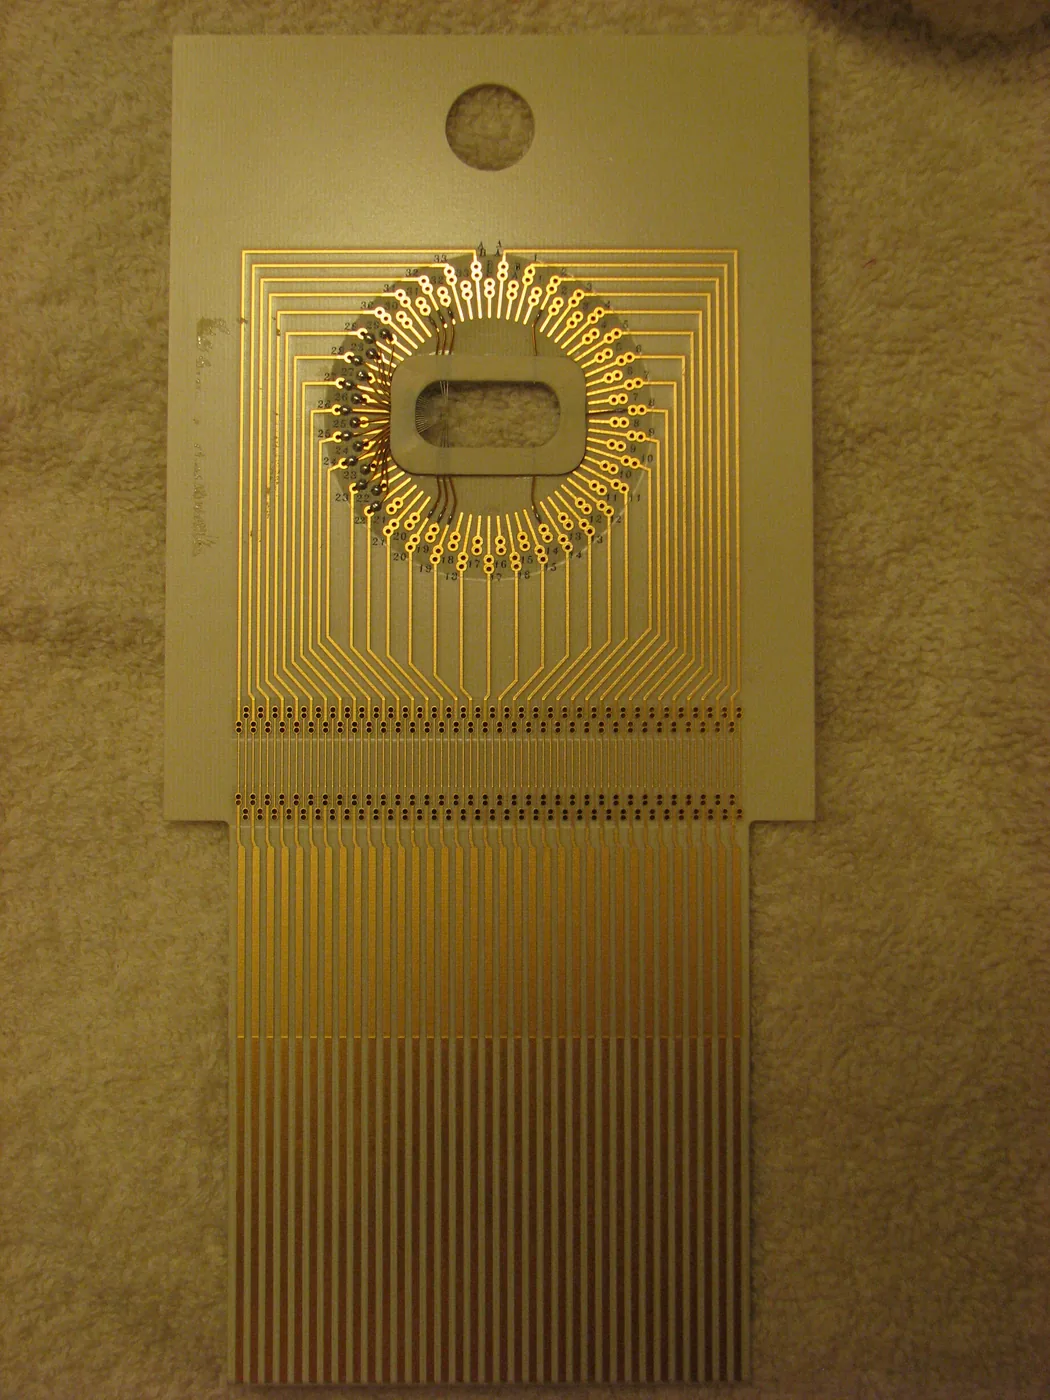
Image: Ajoones / Wikimedia Commons / CC BY 3.0.
After fabrication, a tester makes electrical contact with each die through a probe card. Results are recorded in a wafer map. Dies that fail the required checks can be excluded from assembly, avoiding the cost of packaging a known failure. The exact test flow varies with the product, but the economic logic is straightforward: detect problems before adding more value.
Assembly, final test and shipment
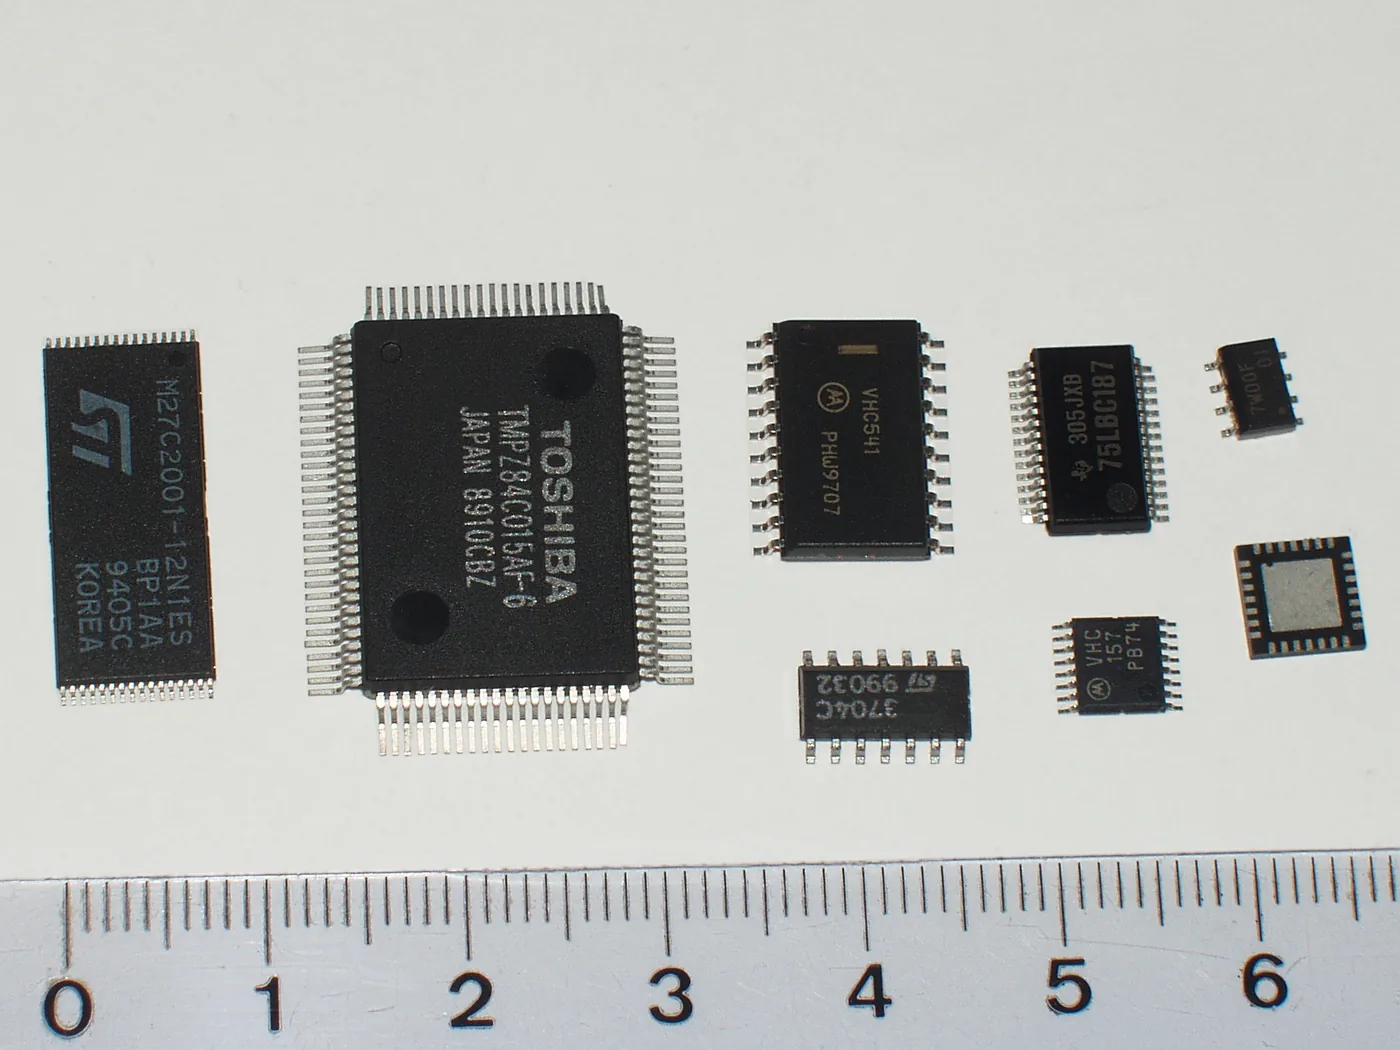
Image: NobbiP / Wikimedia Commons / CC BY-SA 3.0.
A conventional assembly flow may thin the wafer by grinding its back surface, separate it into dies by dicing, attach the selected dies to a package and form their electrical connections. Final testing then checks the assembled product before shipment. Advanced packaging can combine several dies and introduce additional intermediate steps, so this overview is a starting point rather than a universal sequence.
The accompanying assembly series explores wafer thinning, dicing, bonding, moulding and testing in more detail.
3. Why a fab has to be so clean
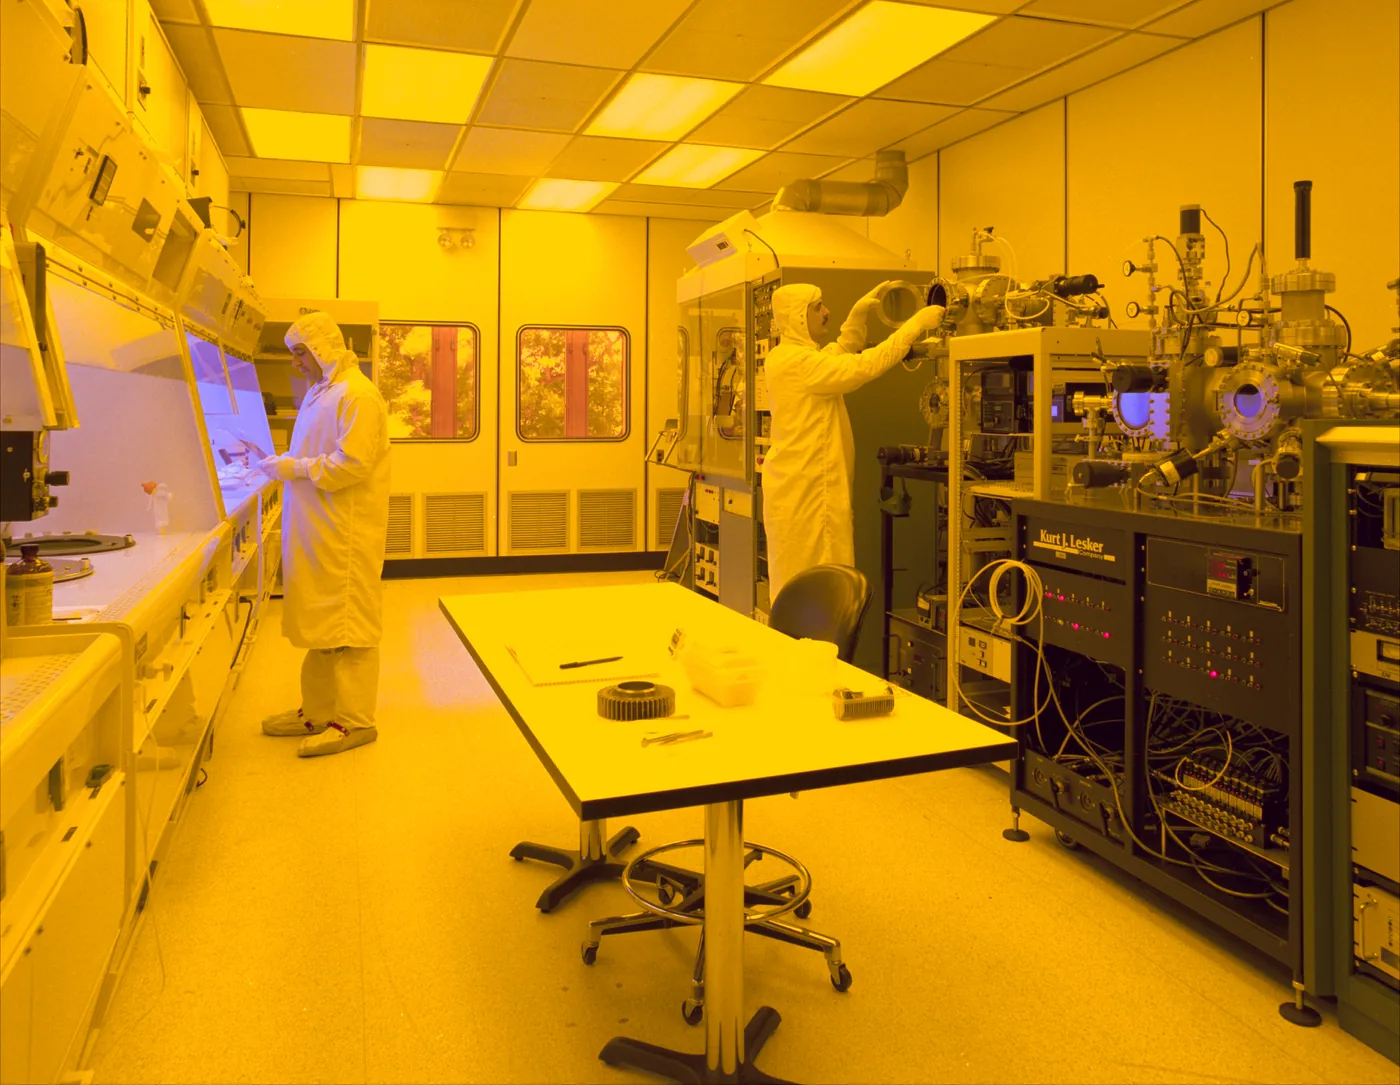
Image: NASA Glenn Research Center / Wikimedia Commons / public domain.
At nanometre dimensions, a particle too small to see can still be large enough to interrupt a wire or bridge two features that should remain separate. A cleanroom controls contamination so that each carefully patterned step has a chance of producing the intended result.
The contrast with ordinary air is striking. SIA/BCG’s 2021 report compares roughly 35 million particles of 0.5 µm or larger per cubic metre in urban air with a semiconductor cleanroom description allowing none of that size. ASML describes many chipmakers as using ISO Class 1 environments and gives an accessible comparison of extremely low particle counts. These explanations convey the engineering challenge; “zero” here should not be read as a claim that a factory contains literally no particles of any size. ISO 14644-1 defines cleanliness classes for specified particle sizes and sampling conditions. [1][2]
For a small spherical particle falling slowly through air, a simple Stokes-law estimate gives its terminal settling speed:
v ≈ ρgd2 / (18μ)Here ρ is particle density, g is gravitational acceleration, d is particle diameter and μ is air’s dynamic viscosity. The approximation neglects air buoyancy relative to particle density. The key feature is d squared: shrinking the diameter tenfold reduces the estimated settling speed a hundredfold.
Using ρ = 2,000 kg/m3 and μ = 1.8 × 10⁻⁵ Pa·s gives about 22 cm per hour for a 1 µm particle and about 2 mm per hour for a 0.1 µm particle. These are deliberately simple calculations, not measured cleanroom performance. At 100 nm, molecular slip needs to be included for a more accurate settling speed, and Brownian motion matters too.
The lesson remains useful: gravity will not promptly clear tiny contamination. Filtered airflow removes airborne particles, while carefully controlled local environments protect the wafer. Many cleanroom arrangements direct clean air downwards rather than relying on dust to settle unaided.
People are another source of particles. Clothing and skin continually release contamination, which is why workers wear covering garments and wafers travel in enclosed carriers rather than in open trays.
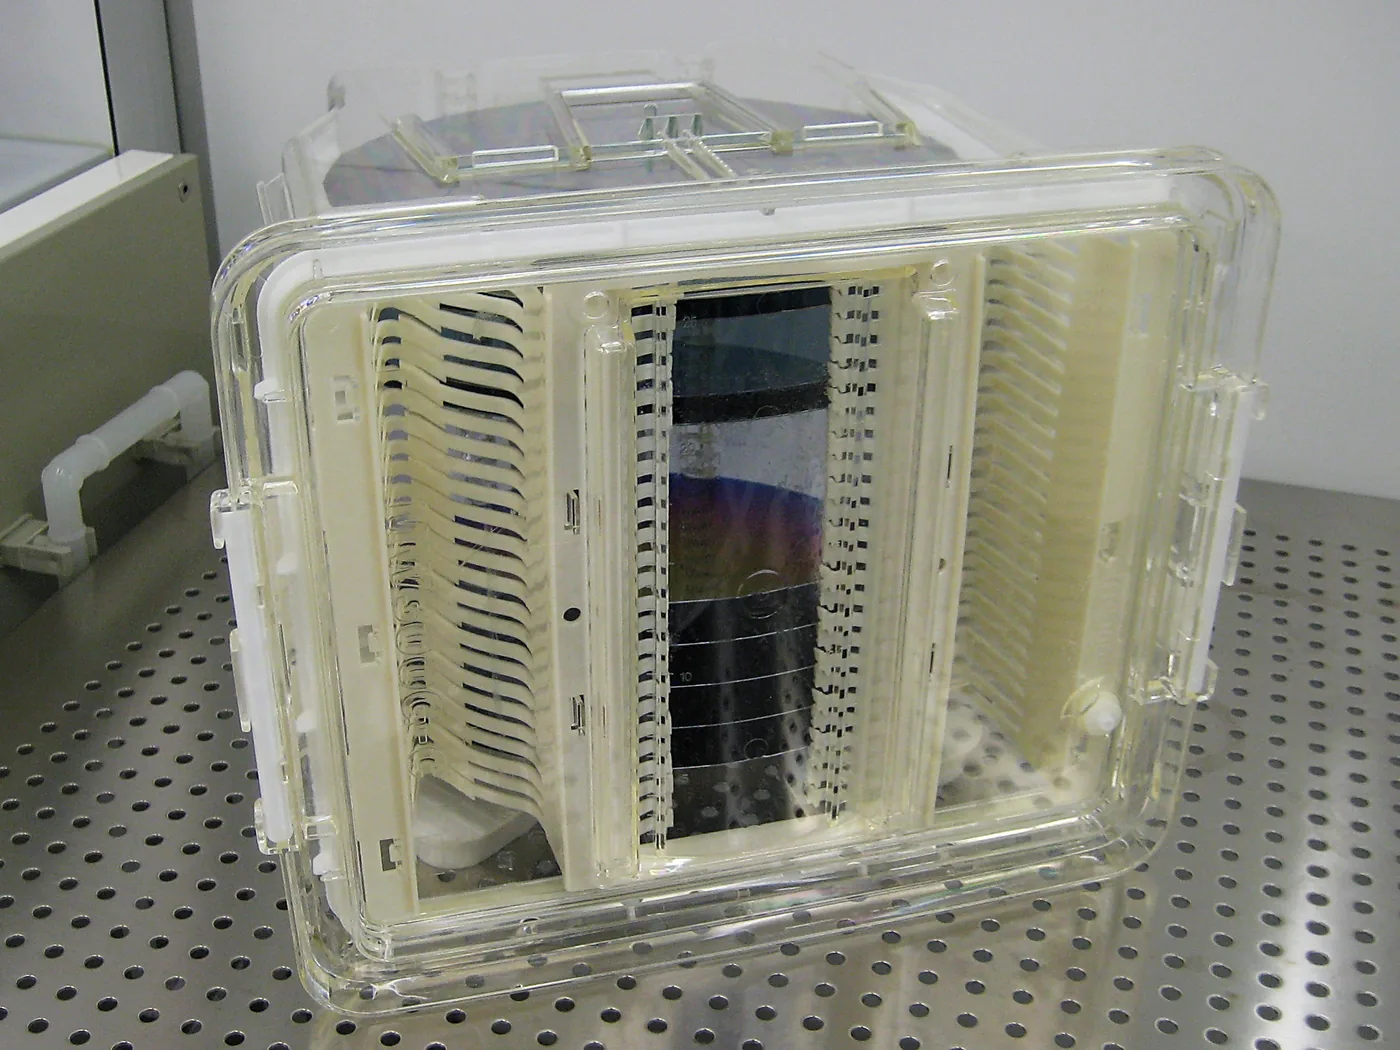
Image: Cepheiden / Wikimedia Commons / CC BY-SA 3.0.
Cleanroom control and wafer cleaning solve related but different problems. The room limits incoming airborne contamination. Cleaning removes particles, chemicals and residues already on the surface. Lesson 3-1 examines how the chemistry works.
4. Yield: how many dies actually work?
Yield is the fraction of manufactured dies that meet the required criteria. A wafer full of beautifully patterned circuits has little commercial value if too few of them work.
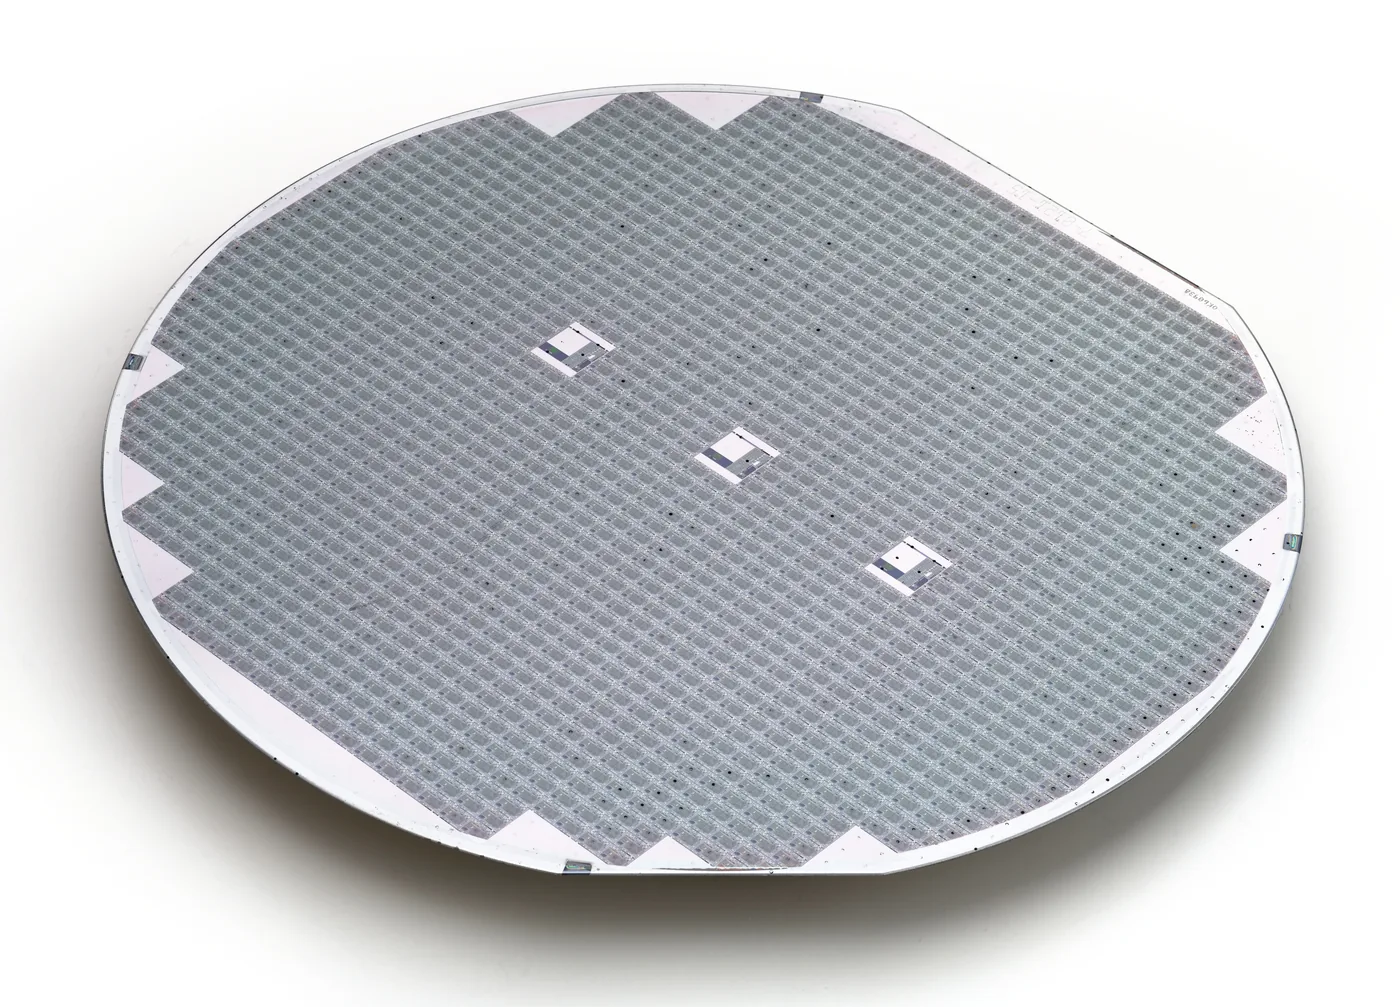
Image: Phiarc / Wikimedia Commons / CC BY-SA 4.0.
Assume fatal defects occur independently and at random, with an average density D0 per unit area. If any one such defect ruins a die of area A, the probability of avoiding them is:
Y = exp(−D0A)This is the simple Poisson yield model discussed in MIT’s manufacturing lectures. [4] For an illustrative defect density of 0.1 defects/cm2, it gives:
| Die area | Calculated yield |
|---|---|
| 1 cm2 | About 90% |
| 6 cm2 | About 55% |
The larger die occupies six times the area and is more likely to encounter a fatal defect. These are model results, not disclosed yields for a smartphone processor or GPU.
Real defects can cluster, and real products can include redundancy, repair and different performance grades. The simple model therefore has limits. Its value is to show why die area affects manufacturing risk, even before the cost of the package is considered.
This is one reason for chiplets: splitting a large design into smaller dies and joining them in a package can improve the manufacturing economics. The benefit must be weighed against assembly cost, interconnect performance and other design constraints. Lesson 3-13 examines how inspection and metrology help identify defects and their causes.
5. Why wafer diameter changes the economics
A larger wafer carries more copies of the same design. Moving from 200 mm to 300 mm increases the available area by (300/200)² = 2.25. Bosch gives the same area comparison. Shin-Etsu describes itself as the first commercial producer of 300 mm wafers and as a market leader across wafer sizes. [5][6]
There is also an edge effect. Rectangular dies do not tile a circular wafer perfectly, so some positions at the perimeter cannot produce a complete die.
One common geometric approximation is:
N ≈ π(d/2)2/S − πd/√(2S)Use consistent units: d is wafer diameter and S is die area. The first term divides wafer area by die area. The second approximates the edge loss. It does not include every practical restriction, such as scribe streets and edge exclusion.
| Wafer diameter | 1 cm2 die | 6 cm2 die |
|---|---|---|
| 200 mm | About 270 dies | About 34 dies |
| 300 mm | About 640 dies | About 91 dies |
For the smaller die, the estimated count grows by about 2.4 times, slightly faster than wafer area. The proportion lost at the edge is smaller. For the larger die the approximate ratio is about 2.7.
Combining unrounded gross counts with the yield example above gives roughly 580 working 1 cm2 dies, or roughly 50 working 6 cm2 dies, per 300 mm wafer. These are teaching calculations under the stated assumptions, not production forecasts.
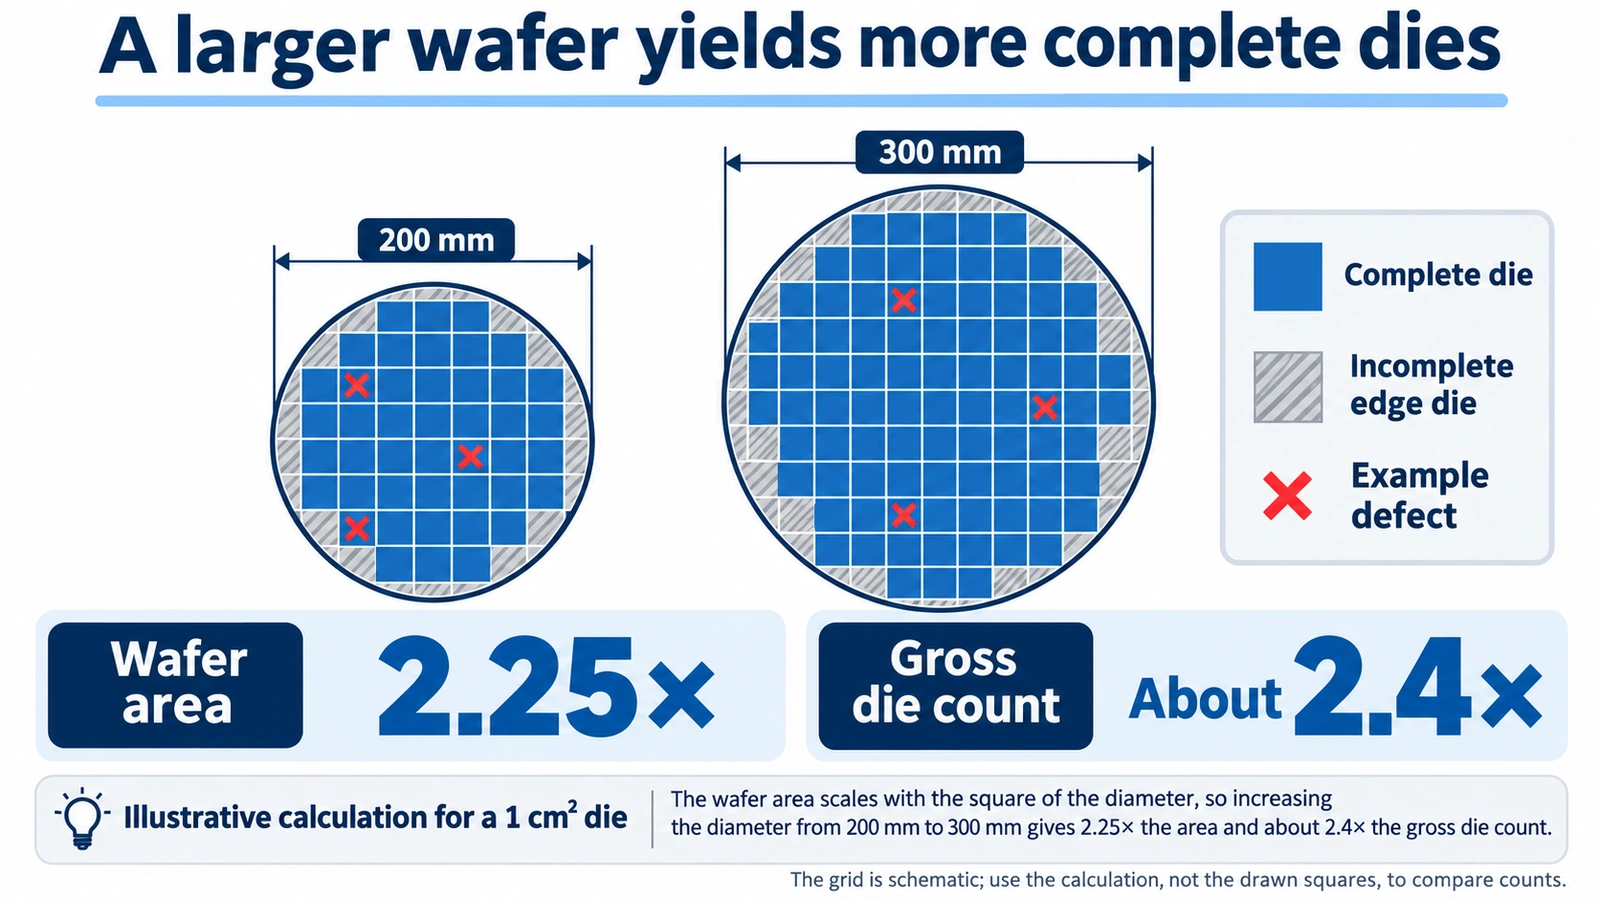
The grid illustrates the idea; do not count its squares to reproduce the table. Larger wafers are not automatically the lowest-cost choice for every product. Equipment cost, process maturity, capacity utilisation and available wafer technology also matter. Part 2 covers wafer production, and Lesson 5-2 returns to fab economics.
6. Who does what in the semiconductor industry?
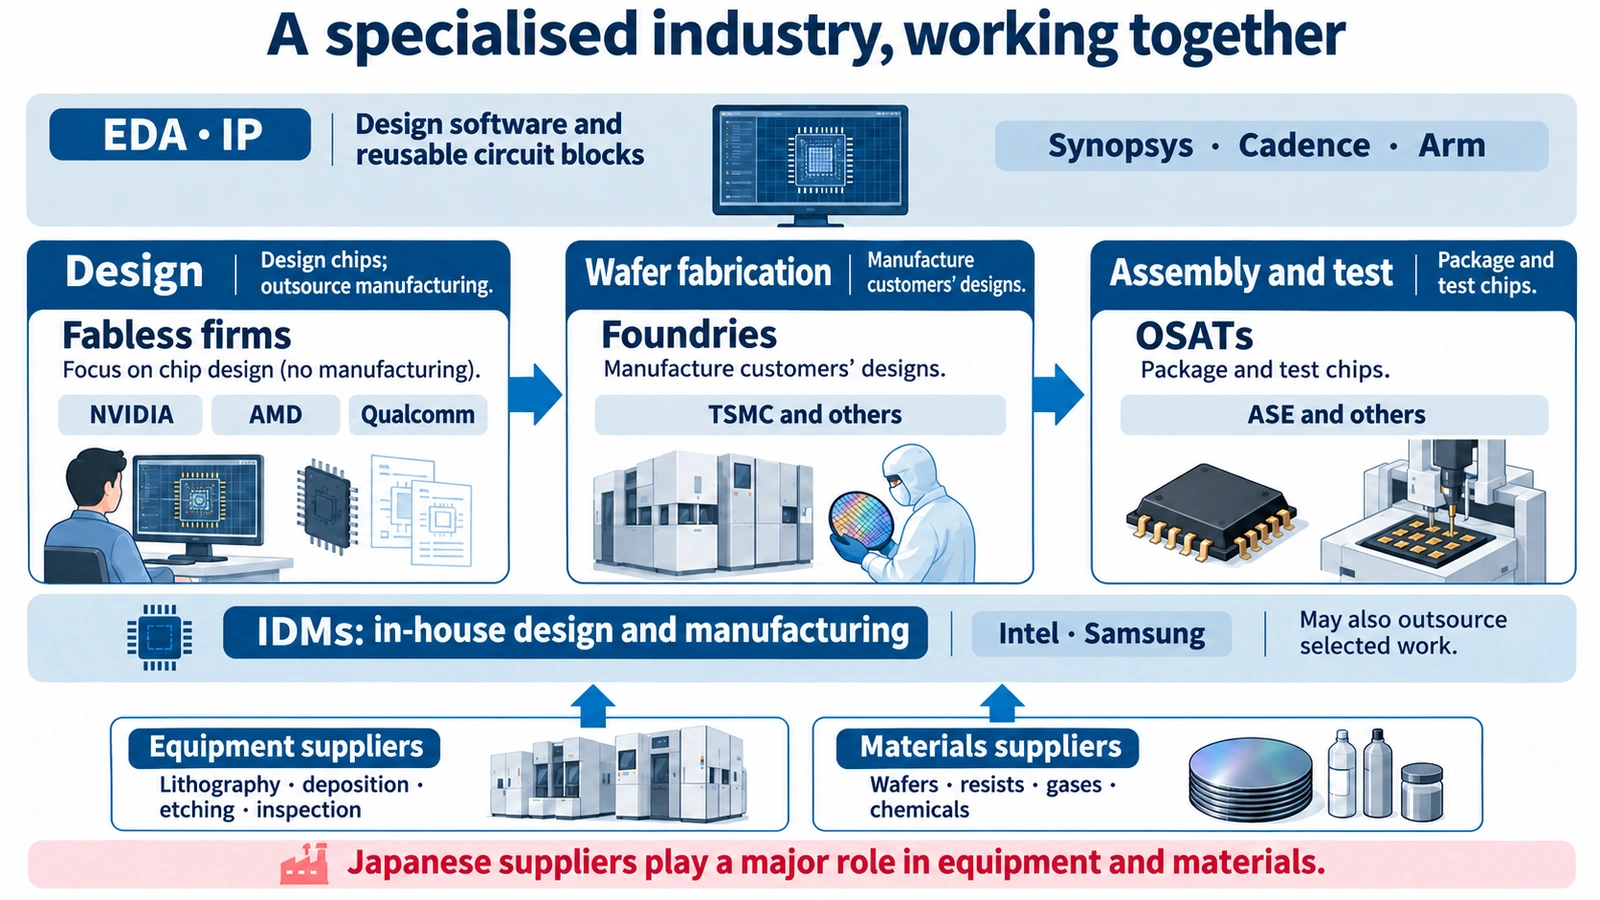
The production chain is a network of specialised capabilities. A fab is a wafer fabrication facility; a fabless company has chosen to concentrate on chip design and use external manufacturing partners.
| Business model or role | Main contribution | Examples |
|---|---|---|
| IDM: integrated device manufacturer | Combines in-house design and manufacturing; may also outsource work | Intel, Samsung Electronics |
| Fabless company | Designs chips and contracts out manufacturing | Qualcomm, NVIDIA, AMD |
| Foundry | Fabricates chips to customers’ designs | TSMC, GlobalFoundries, UMC |
| OSAT: outsourced semiconductor assembly and test | Packages and tests chips for customers | ASE |
| EDA and IP supplier | Provides design tools and reusable circuit blocks | Synopsys, Cadence, Arm |
| Equipment and materials supplier | Provides the tools and consumables used in manufacturing | ASML, Applied Materials, Lam Research, Tokyo Electron, KLA, Shin-Etsu, SUMCO |
These are useful roles, not watertight boxes. Companies can offer overlapping services. ASML’s overview explains the main models; NVIDIA’s annual report describes its own fabless and contract-manufacturing strategy and its work with outside suppliers throughout fabrication, assembly and test. [1][7]
Following value, rather than just counting factories
SIA/BCG’s 2024 report divides the industry’s 2022 value added across activities as follows. Value added means the value created at a stage, rather than its total sales or its share of manufacturing capacity. [9]
| Activity | Share of value added in the report |
|---|---|
| Chip design: logic 30%, memory 9%, discrete/analogue/optoelectronics and other categories 17% | 56% combined |
| Wafer fabrication | 19% |
| Manufacturing equipment | 12% |
| Assembly, packaging and test | 6% |
| Materials | 5% |
| EDA and core IP | 3% |
The reported rounded percentages add to 101%. The design total is our sum of the three design categories. This is a particular analytical breakdown for 2022; it is not a profit-margin table or a current market ranking.
Design creates value through architecture, engineering and reusable know-how. Fabrication, meanwhile, requires enormous physical investment. For scale, TSMC’s January 2026 announcement put its 2026 capital budget at US$52–56 billion. That is the outlook announced on that date, rather than a final spending total. [8]
The equipment and materials underneath the flow
SEMI reported worldwide semiconductor equipment sales of US$135.1 billion in 2025, up 15%. Mainland China accounted for US$49.3 billion, Taiwan US$31.5 billion and South Korea US$25.8 billion; Taiwan’s figure was up 90%. SEMI separately reported a US$73.2 billion semiconductor materials market in 2025, up 6.8%. These market definitions are broader than an individual front-end process family. [10][11]
| Supplier | Examples of equipment associated with it |
|---|---|
| ASML, Netherlands | Lithography systems |
| Applied Materials, US | A broad range including deposition and etching |
| Lam Research, US | Etching and deposition |
| Tokyo Electron, Japan | Coat/develop tracks, deposition, etching and cleaning |
| KLA, US | Inspection and metrology |
This is an orientation guide, not an exhaustive product list or sales ranking.
Why Japan appears so often in the supplier list
METI’s 2023 strategy material, using 2021 financial-year data, gives Japan a 31% share of semiconductor manufacturing equipment, behind the US at 35%, and a 48% share of key semiconductor materials. The materials grouping includes wafers, resists, CMP slurries, masks, target materials and bonding wire. These are historical shares within the source’s categories, not estimates for 2026. [3]
The same material gives ASML 92.8% of the 2021 lithography equipment market by value, followed by Canon at 4.6% and Nikon at 2.6%. A strong position in semiconductor equipment overall therefore does not imply leadership in every kind of tool. In silicon wafers, Shin-Etsu describes itself as a market leader and SUMCO states that it holds the second-largest global share. Those are the companies’ own descriptions. [3][6][12]
The practical lesson is that an advanced fab depends on specialised tools and materials from many places. A country can be essential to chipmaking without supplying the largest share of finished processors.
7. New capacity in Japan: JASM and Rapidus
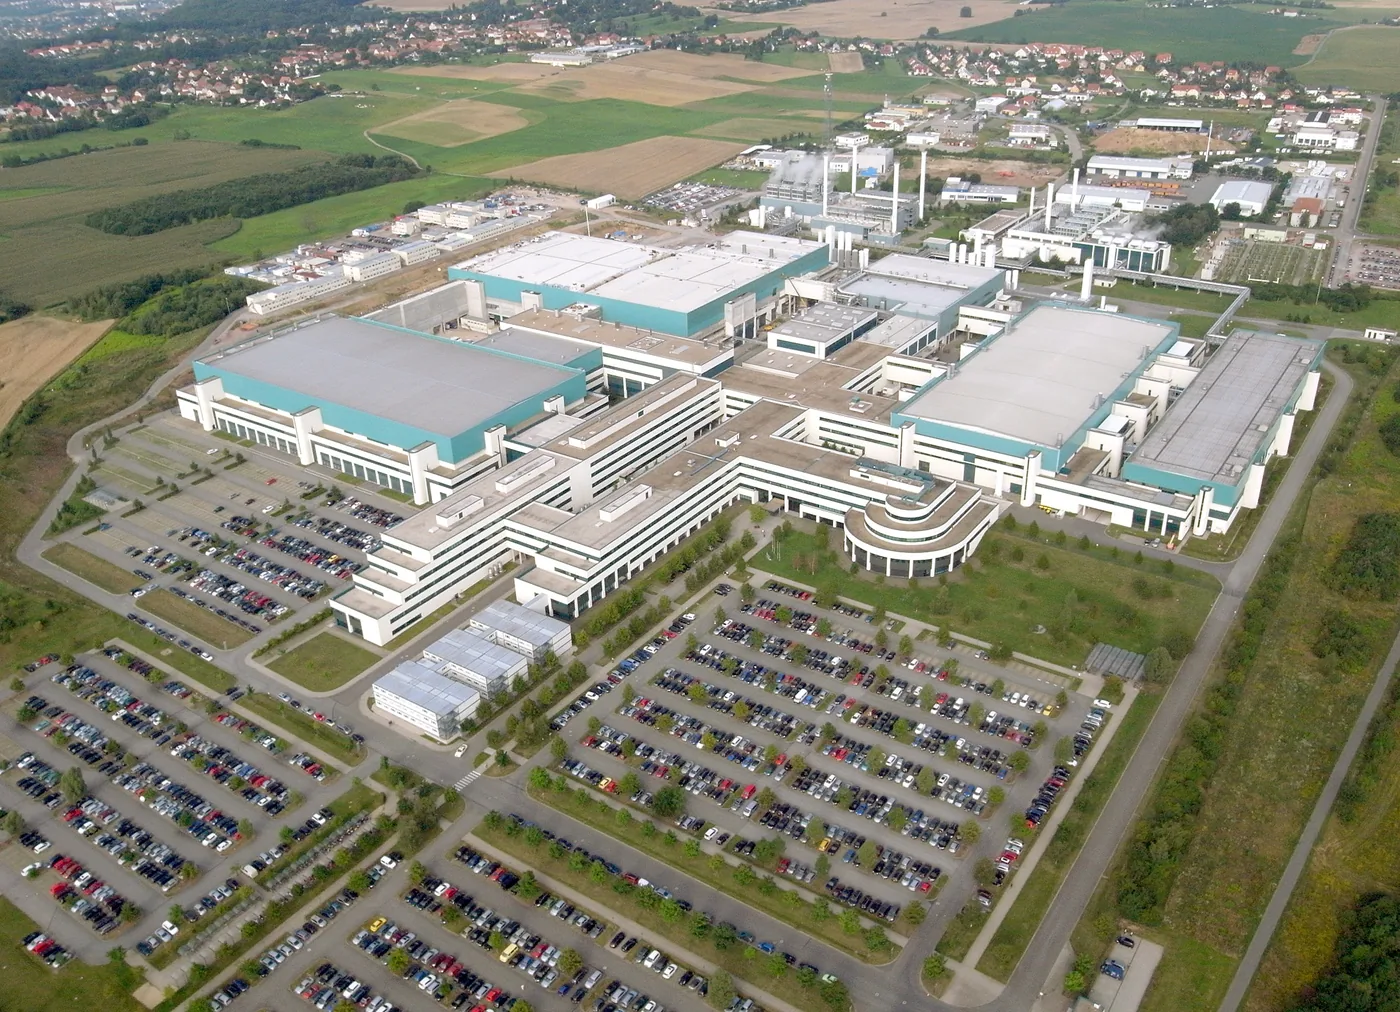
Image: Fensterblick. / Wikimedia Commons / CC BY-SA 3.0.
Japan’s recent projects provide two different examples of industrial investment. The snapshot below follows METI’s June 2026 briefing, also used in the Japanese edition. Announced capacities and schedules should be read as dated plans, not as a live construction tracker. [13]
JASM: a TSMC-led manufacturing operation in Kumamoto
Japan Advanced Semiconductor Manufacturing (JASM) is located in Kikuyo, Kumamoto Prefecture. The briefing describes the following projects and support under its TSMC-related measures. [13]
| Project | Technology described in the briefing | Stated capacity and milestone | Government support ceiling |
|---|---|---|---|
| First fab | 22/28 nm and 12/16 nm | 55,000 300 mm-equivalent wafers/month; first shipment in December 2024 | ¥476 billion |
| Second fab | Initially 12 nm and 6 nm; TSMC proposed a change to 3 nm in February 2026 | 48,000 300 mm-equivalent wafers/month; first shipment planned for Q4 2027 | ¥732 billion |
METI describes total approved TSMC-related support of approximately ¥1.2 trillion. Capacity, support ceilings and shipment targets describe different things: none is a statement of current output or money already paid in full. The proposed technology change should not be confused with completed production at that node. [13]
Rapidus: building towards leading-edge logic production
Rapidus is developing a leading-edge logic manufacturing capability at its IIM-1 site in Chitose, Hokkaido. Its July 2025 announcement describes pilot-line operation beginning in April 2025, a first EUV exposure on 1 April, and the start of prototyping and electrical characterisation of 2 nm-generation gate-all-around (GAA) transistors. Demonstrating devices on a pilot line is a milestone towards manufacturing; it is not the same as high-volume production. [14]
The cited company plan targets mass production in 2027. METI’s June 2026 briefing describes approximately ¥2.4 trillion in commissioned R&D support, alongside separate equity investment through the Information-technology Promotion Agency (IPA): ¥100 billion for FY2025 and ¥150 billion for FY2026. Keep those categories separate rather than treating them as a single kind of subsidy. [13][15]
TSMC announced in March 2025 that its expected total US investment would reach US$165 billion. Separately, SIA/BCG’s 2024 report projected that the US share of global capacity could rise from 10% in 2022 to 14% in 2032. The first is an announced investment programme; the second is a forecast under the report’s assumptions. Neither should be presented as an already achieved outcome. [9][16]
8. Where the rest of the series fits
Use the cross-section as a map. Some lessons explain how to prepare the silicon foundation. Others explain how to form the devices, and others build the contacts and wiring above them. Cleaning and inspection support the entire structure.
| Part | Lessons | Main subjects | Link to the cross-section |
|---|---|---|---|
| 1: Introductions | 1-1–1-4 | Semiconductor behaviour, materials and uses, AI, manufacturing and industry | The whole picture |
| 2: Making the wafer | 2-1 | Silicon purification and single-crystal growth: CZ and FZ methods | Silicon foundation |
| 2-2 | Wafer preparation, epitaxy and SOI | Silicon foundation | |
| 3: Process families | 3-1 | Cleaning and contamination chemistry | Across the structure |
| 3-2 | Oxidation and thermal processing | Mainly device formation | |
| 3-3–3-4 | CVD, ALD, sputtering and plating | Devices through interconnects | |
| 3-5–3-7 | Lithography, immersion, multiple patterning and EUV | Patterning across the structure | |
| 3-8–3-9 | Etching, plasma physics and high-aspect-ratio features | Across the structure | |
| 3-10 | Implantation and annealing | Device formation | |
| 3-11 | CMP | Particularly contacts and wiring | |
| 3-12 | Interconnects, damascene and backside power | Contacts and wiring | |
| 3-13 | Metrology, inspection and yield | Across the structure | |
| 4: Device structures | 4-1–4-3 | FinFET/GAA/CFET, DRAM/3D NAND and power devices | Device structures |
| 5: Putting it together | 5-1–5-3 | A CMOS process flow, fab economics and handover to assembly | The complete journey |
Titles and ordering from Lesson 2-2 onwards remain provisional. The next lesson starts with silicon’s raw material and follows the physical and chemical steps needed to grow a highly pure single crystal. The ideas introduced here—cleanliness, yield and wafer scale—will keep returning throughout the series.
9. Check your understanding
Put the main manufacturing stages in order, starting with design.
Show answer
Design → photomasks → wafer fabrication → wafer test → assembly and packaging → final test and shipment. Real products can add intermediate tests and packaging steps.
What cycle times does the 2021 SIA/BCG report give for front-end manufacturing?
Show answer
About 12 weeks on average, rising to 14–20 weeks for advanced products. These are the report’s figures, not a universal fab schedule.
Why is waiting for tiny particles to settle an inadequate contamination strategy?
Show answer
In the simple Stokes model, settling speed scales with diameter squared. Tiny particles settle very slowly; filtration, controlled airflow and enclosed wafer handling are needed.
In the simple yield model, what happens for 1 cm² and 6 cm² dies at 0.1 fatal defects/cm²?
Show answer
Y = exp(−D₀A) gives about 90% and 55%, respectively. The larger die is a bigger target. These are illustrative calculations, not measured production yields.
Why can die count increase by about 2.4 times when wafer area increases by 2.25 times?
Show answer
The larger wafer loses a smaller proportion of its area to incomplete dies at the circular edge. The result depends on die size and the counting assumptions.
What is the difference between a fabless company and a foundry?
Show answer
A fabless company designs chips and contracts out manufacturing. A foundry manufactures chips to customers’ designs.
In the cited historical METI data, does Japan’s roughly one-half share refer to equipment or key materials?
Show answer
Key materials: 48% in the source’s categories and 2021 financial-year data. The equipment figure is 31%.
What do FEOL, MOL and BEOL contribute, and is BEOL the same as package assembly?
Show answer
FEOL forms the active devices, MOL connects their terminals to wiring, and BEOL builds the interconnect network. BEOL belongs to wafer fabrication; assembly and packaging happen later.
10. A short glossary
- Annealing
- A controlled heat treatment used, among other purposes, to repair implantation damage and activate dopants.
- Backside power delivery
- An architecture that supplies power through a network on the back of the wafer rather than sharing the conventional front-side signal-wiring stack.
- BEOL
- Back-end-of-line: the interconnect stage within wafer fabrication, not package assembly.
- Capital expenditure
- Investment in long-lived assets such as fab buildings and manufacturing tools.
- Chiplet
- A smaller die designed to work with other dies in a package.
- Cleanroom
- A controlled environment with tightly limited airborne particle contamination.
- CMP
- Chemical mechanical planarisation: polishing that combines chemical action and mechanical removal.
- Contact
- A conductive connection from a device terminal into the interconnect network.
- Defect density
- The average number of relevant defects per unit area; the type of defect and model must be specified.
- Die
- An individual chip area on a wafer, or the piece of semiconductor after separation. The plural used here is dies.
- Dicing
- Separating a wafer into individual dies.
- EDA
- Electronic design automation: software used to design, verify and implement circuits.
- Epitaxy
- Growth of a crystalline layer whose crystal structure follows the underlying crystal.
- Etching
- Selective removal of material to create a structure or opening.
- EUV
- Extreme ultraviolet light; semiconductor EUV lithography uses a wavelength of about 13.5 nm.
- Fab
- A wafer fabrication facility.
- Fabless company
- A chip designer that relies on external manufacturing partners.
- FEOL
- Front-end-of-line: formation of active devices such as transistors.
- FOUP
- Front-opening unified pod, an enclosed wafer carrier commonly used inside a fab.
- FOSB
- Front-opening shipping box, a container used for wafer shipment between facilities.
- Foundry
- A business that fabricates semiconductor chips to customers’ designs.
- GAA
- Gate-all-around: a transistor structure in which the gate surrounds the channel.
- IDM
- Integrated device manufacturer: a company combining design and manufacturing capabilities.
- Interconnect
- Wiring that carries signals, clocks, power or ground within a chip.
- Ion implantation
- Introducing dopant ions into selected parts of a semiconductor.
- IP block
- A reusable circuit design licensed or reused within a larger chip.
- ISO 14644-1
- The international standard used to classify air cleanliness by particle concentration under specified conditions.
- JASM
- Japan Advanced Semiconductor Manufacturing, a TSMC-led manufacturing operation in Kumamoto.
- Layout
- The geometric patterns assigned to manufacturing layers in a chip design.
- Lithography
- Transferring a pattern into a light-sensitive coating on the wafer.
- Low-k dielectric
- An insulating material with low dielectric constant, used to reduce capacitance between wires.
- Metrology
- Measurement of dimensions, materials or other process characteristics.
- MOL
- Middle-of-line: the contacts and local connections between devices and the wiring network.
- OSAT
- Outsourced semiconductor assembly and test provider.
- Photomask
- A patterned master used during lithographic exposure; it may be transmissive or reflective.
- Photoresist
- A light-sensitive coating used to define a pattern for later processing.
- Pilot line
- A development manufacturing line used to establish and evaluate a process before volume production.
- Probe card
- The interface that makes electrical contact with dies during wafer testing.
- Rapidus
- A Japanese company developing leading-edge logic manufacturing in Chitose, Hokkaido.
- RC delay
- Signal delay associated with electrical resistance and capacitance.
- Tape-out
- Release of a completed design’s manufacturing data.
- Value added
- The value created at a particular stage, distinct from total sales or production capacity.
- Via
- A conductive connection between wiring levels, formed through an opening in insulating material.
- Wafer
- A thin semiconductor disc on which many dies are manufactured together.
- Wafer test
- Electrical testing while the dies remain on the wafer.
- Yield
- The fraction of dies or products that meet specified acceptance criteria at a stated stage.
11. Sources and reading notes
The numbered references preserve the Japanese edition’s source numbering. Japanese government documents are identified in English below; the linked originals remain in Japanese. Historical data and forward-looking statements retain their dates. The physical explanations and worked examples are written for this article rather than quoted from the sources.
- ASML — How microchips are made — Read source
- SIA / BCG — Strengthening the Global Semiconductor Supply Chain in an Uncertain Era, April 2021 — Read source
- METI, Japan — Semiconductor and Digital Industry Strategy, July 2023 (Japanese) — Read source
- MIT OpenCourseWare — 2.830J Control of Manufacturing Processes, Lecture 10: Yield — Read source
- Bosch Semiconductors — Glossary: Wafer — Read source
- Shin-Etsu Chemical — Investor relations FAQ — Read source
- NVIDIA / US SEC — Form 10-K for the year ended January 2026 — Read source
- TSMC — Fourth-quarter results and 2026 capital budget outlook, 15 January 2026 — Read source
- SIA / BCG — Emerging Resilience in the Semiconductor Supply Chain, May 2024 — Read source
- SEMI / PR Newswire — Worldwide semiconductor equipment sales for 2025, 8 April 2026 — Read source
- SEMI / PR Newswire — Worldwide semiconductor materials market for 2025, 12 May 2026 — Read source
- SUMCO — Corporate website: market position — Read source
- METI, Japan — Semiconductor policy: developments and future direction, 9 June 2026 (Japanese) — Read source
- Rapidus — Prototyping of leading-edge 2 nm GAA transistors, 18 July 2025 — Read source
- Rapidus — NEDO approves FY2026 plan and budget, 11 April 2026 — Read source
- TSMC — Intended expansion of US investment to US$165 billion, 4 March 2025 — Read source
- imec — A view on the logic technology roadmap — Read source
- imec — How to power chips from the backside, November 2022 — Read source
- B. Baas, University of California, Davis — EEC 116: Advanced metal interconnect — Read source
- IBM — Copper interconnects: IBM history — Read source
- imec — How to solve the back-end-of-line RC delay problem, September 2017 — Read source
12. Evidence map and calculation assumptions
| Topic | Supporting source or assumption | How to read the claim |
|---|---|---|
| Manufacturing layers and industrial roles | ASML [1] | General overview; layer counts and business models are not identical for every chip or company |
| Step counts, cycle time and contamination contrast | SIA/BCG 2021 [2]; METI 2023 [3] | Dated descriptions of manufacturing scale |
| FEOL, MOL and BEOL; wiring hierarchy and low-k materials | imec [17][18]; UC Davis [19] | Device, contact and interconnect roles; exact boundaries and counts vary by process |
| Copper introduction and RC-delay example | IBM [20]; imec 2017 [21] | Historical implementation and dated technology outlook |
| Backside power | imec 2022 [18] | Architecture and development context; not a universal node feature |
| Particle settling | Stokes estimate, density 2,000 kg/m³, viscosity 1.8 × 10⁻⁵ Pa·s | Approximate calculation; molecular-slip correction omitted at 100 nm |
| Yield example | Poisson model in MIT [4], with D₀ = 0.1 defects/cm² | Illustrative model, independent fatal defects, no redundancy or repair |
| Wafer area and gross die count | Bosch [5]; geometric approximation in Section 5 | Area ratio 2.25; counts rounded, edge loss approximated, streets and exclusion omitted |
| Working dies per wafer | Unrounded gross counts multiplied by exp(−D₀A) | About 580 and 50 under the teaching assumptions |
| Wafer supplier positions | Shin-Etsu [6]; SUMCO [12] | Company descriptions, not a new independent market-share survey |
| NVIDIA manufacturing model | NVIDIA annual report [7] | Company disclosure |
| Value-added shares and US capacity outlook | SIA/BCG 2024 [9] | 2022 breakdown; design total 56% is our sum; 2032 share is a forecast |
| TSMC capital budget and US investment | TSMC announcements [8][16] | January 2026 outlook and March 2025 announced programme |
| Equipment and materials markets | SEMI releases [10][11] | Reported 2025 market totals under SEMI’s definitions |
| Japan’s equipment/materials and lithography shares | METI 2023 [3] | Historical 2021 data and source-specific categories |
| JASM and government support | METI June 2026 [13] | Dated snapshot; proposed changes, capacity and shipment targets remain plans |
| Rapidus milestones and targets | Rapidus [14][15]; METI [13] | Pilot-line results distinguished from 2027 volume-production target; R&D and equity support separated |
English edition prepared on 3 November 2026. This article follows the scope of the Japanese edition, with independently written English explanations. Historical statistics and announced plans retain their source dates. Illustrations are learning aids, not manufacturing recipes or drawings to scale. Photograph credits accompany each image.
© 2026 Troy Technical. Original text and illustrations: all rights reserved, subject to applicable legal exceptions. Third-party photographs retain their stated licences. Links to this article are welcome.
Diagrams localised with the built-in OpenAI Image Gen tool for this English edition.