TECHNOLOGY EXPLAINER
Applications to Alloys and Structural Materials
- When machine learning proposes an alloy, what counts as "verified"?
Steels, aluminium alloys, nickel-base superalloys, shape memory alloys and composites: in structural materials too, researchers now use "materials informatics" (MI) to learn trends from past data and narrow down which compositions to try next. But the properties of an alloy depend on more than composition. They also depend on the heat (the melt lot), the processing and the heat treatment. And the data are few, and records of the same steel grade resemble one another. This article assumes a materials engineer who has never used machine learning. It sorts published cases by (1) validation inside the data, (2) confirmation by another calculation and (3) confirmation by actually making and measuring the alloy, and reads the phrase "AI found a new alloy" within what the papers actually state.
- The short version / before you start / where this fits in the series
- Why alloys suit MI, and why they are hard
- Who does what: calculation, AI and experiment
- Steel data: fatigue strength and the Matbench yield-strength task
- A pitfall in splitting data: when lots of the same grade fall on both sides
- Designs verified by experiment: superalloys, shape memory alloys, cast aluminium, steel, high-entropy alloys
- Cases that stop at calculation, and composites
- A materials engineer's view: your own data and experiment design
- Limits, what we could not confirm / summary
- How to read the yardsticks and standards
- Glossary
- References (primary sources)
- Claim-to-source audit
Sourced = stated in a published source (link given)
Our calculation = a value this article computed from stated assumptions
Not yet confirmed = plans, drafts, items under revision or otherwise not settled
Our own readings are marked as commentary. Inference is shown in bold. The checking date is 22 October 2026.
The numbers from papers (prediction error, strength, elongation and so on) are results for that paper's data, split and test conditions. We do not line up numbers from different papers to rank methods or alloys. Statements such as "an alloy proposed by AI" are given as the authors' claims, within the abstract or text of each paper. We could not find independent replication. The "synthetic data" examples in chapters 4 and 5 are calculations on made-up data created for this article, not the performance of any real alloy. We do not rank companies, alloys or models, and we give no advice on design or investment.
1. The short version / before you start / where this fits in the series
- MI is a tool for narrowing where to look. The number of possible alloy compositions is huge: mixing just five elements in 1 at.% steps gives about 4.6 million compositions, and eight elements give about 26 billion Our calculation. We cannot try them all, so a function that "learns trends from past data" is used to narrow down the next candidates.
- Some cases were verified by experiment, but they are few, and we found no independent replication. In a search for shape memory alloys, 36 compositions out of a space of about 800,000 were made, and 14 had a smaller thermal hysteresis than any in the original data Sourced [Reference 8]. There are also reports of making and measuring proposed alloys for a nickel-base superalloy, a cast aluminium alloy and a TWIP steel [References 6, 9, 10].
- "R² = 0.98" does not mean "unseen steel grades are predicted too". R² of 0.90 to 0.98 was reported for fatigue strength of steel, but under leave-one-out cross-validation (LOOCV), in which one record is held out at a time Sourced [Reference 2]. In synthetic data, R² was 0.98 with a random split and -0.31 (median) when a whole grade was held out Our calculation.
"Verified" comes in levels. Predicting well inside the data, agreeing with another calculation, and actually making and measuring the alloy answer different questions. When you read an article or a talk about an alloy, look for "which level of check", "who did it" and "how many alloys".
Machine learning is "an approximator that learns trends from past data". You show it many pairs of inputs (composition, heat-treatment conditions) and outputs (strength, fatigue strength), and it builds a function that predicts the output from the input. Limits of the analogy: it is weak outside the range of the data it learned from (extrapolation), and it does not understand physical laws or metallurgy.
Searching for materials is like "looking for treasure on a vast map", and MI is a tool for narrowing where to look. Whether it is treasure is not known until you dig (make and measure). "Verifying" in this article means that digging step.
Metallurgical terms (heat, quenching, tempering, at.%, wt.%) are familiar to materials engineers. Machine-learning terms (cross-validation, R², extrapolation and so on) are explained each time they appear. A heat is "a batch of steel made from one melt (a melt lot)".
This article is one of the application articles in the Materials Informatics series. The basics of machine learning are in our explainer on machine learning and neural networks; data and descriptors are in our explainer on materials data and descriptors; databases are in our explainer on materials databases and the FAIR principles; Bayesian optimization is in our explainer on Bayesian optimization and active learning. The nature of high-entropy alloys themselves (their definition, cryogenic toughness and so on) is covered in our explainer on high-entropy alloys, so here we stay with the MI viewpoint only. How to read evaluations continues in our explainer on how to read evaluation and reproducibility in MI.
2. Why alloys suit MI, and why they are hard
(1) Why they suit it: many combinations, and continuously adjustable composition
An alloy is a material whose composition can be varied continuously. Suppose you mix five elements in 1 at.% steps. How many compositions are there? Counting them is the same as counting the ways to split 100 marbles among 5 boxes, and the answer is 4,598,126. For eight elements it is 26,075,972,546 Our calculation (counting each element as allowed to be 0 at.%. Real alloys often leave out elements or limit their ranges, so treat this as a rough upper bound).
On top of that, the conditions of melting, casting, rolling and heat treatment multiply the possibilities. That is what the "vast map" analogy means. Instead of trying everything, we use machine learning that learns trends from past data to narrow down where to try next. The review by Hart and co-workers states that the pairing of machine learning and alloys has spread to metallic glasses, high-entropy alloys, shape memory alloys, magnets, superalloys, catalysts and structural materials, and that it summarizes both theoretical predictions and experimental validations Sourced [Reference 1].
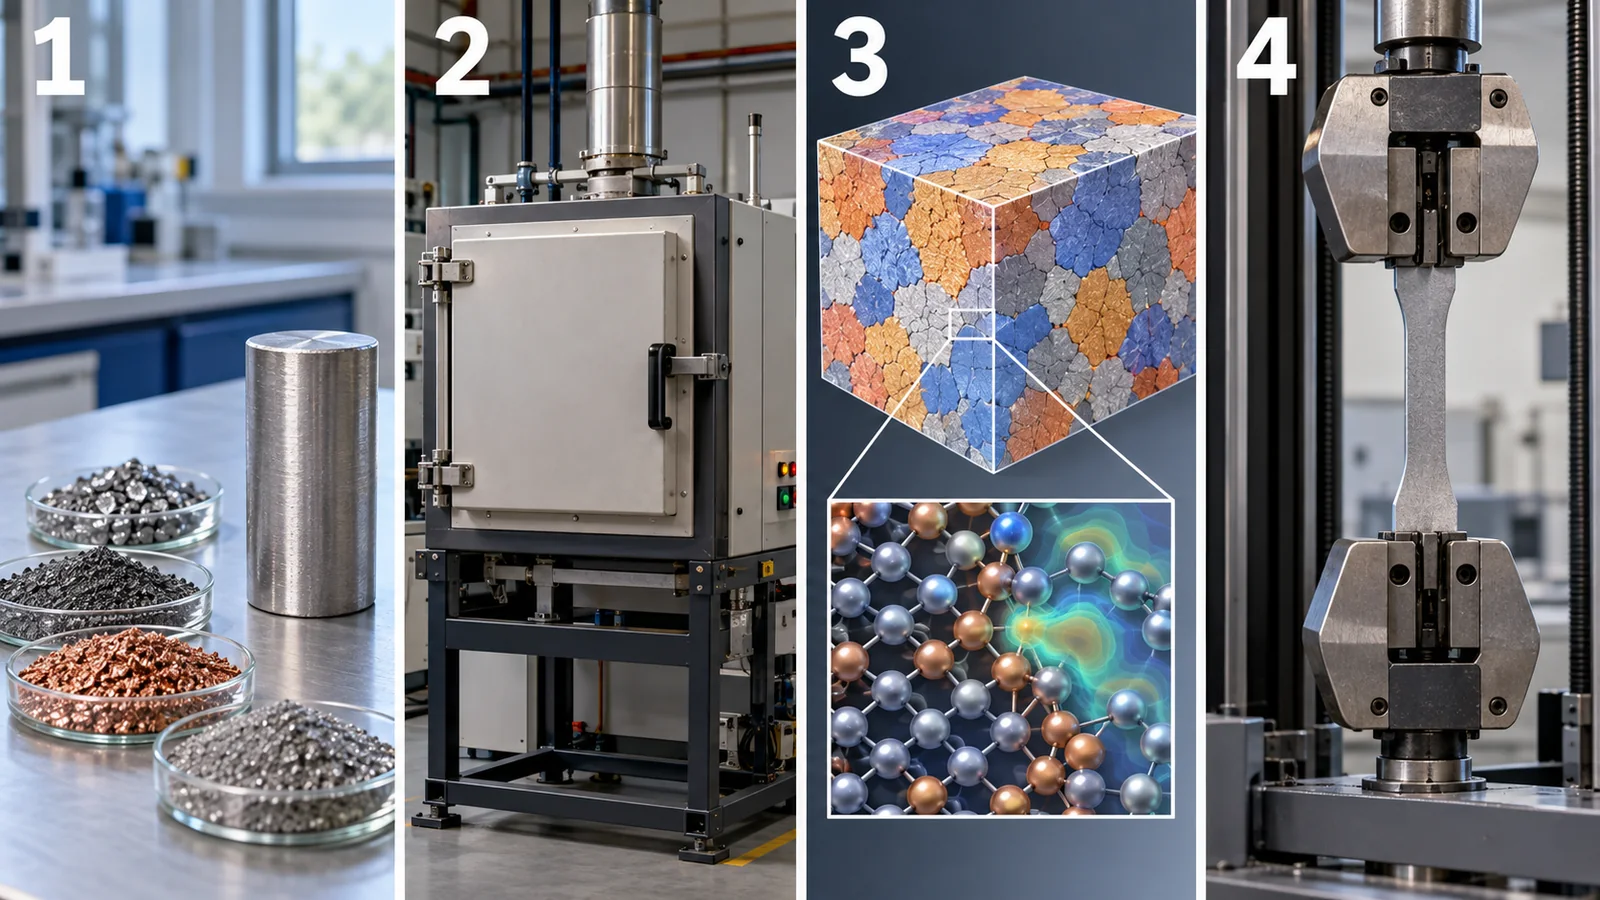
View original SVG, values and sources
Original SVG reference: Concept diagram (vector illustration). The path from composition to properties, and what is and is not often recorded. The examples in the boxes are our own illustration, not the process of a specific alloy.
(2) Why they are hard: few data and many hidden variables
As the figure shows, the properties of an alloy are set along the chain "composition, processing, heat treatment, microstructure, properties". Yet what is easy to find in papers and databases is only the composition, the main heat-treatment conditions and the final results. The microstructure in between (grain size, precipitates), the distribution of inclusions, the position the specimen was taken from and residual stress are often not recorded (commentary).
A second difficulty is bias in how similar the data are to each other. A common structure is that many heats of the same steel grade sit together, while different grades are far apart. To study scatter, the NIMS fatigue data sheets tested several heats for each grade (in the early editions, more than ten heats per grade) Sourced [Reference 3]. This is valuable data, but when you use it for machine learning you must watch for the fact that "another heat of the same grade" easily ends up on both the training side and the test side (chapter 5).
Even 1,000 records may carry little new information if they are just dozens of lots for each of a few grades; the amount of truly new information may be closer to the number of grades. What matters more than the count is the spread of composition, processing and heat treatment, and quality (whether measurement conditions are consistent). How to count data is also covered in our explainer on machine learning with small data.
3. Who does what: calculation, AI and experiment
Three parties appear in alloy design: "calculation", "AI" and "experiment". In this article we divide their roles as follows (the division used throughout this series).
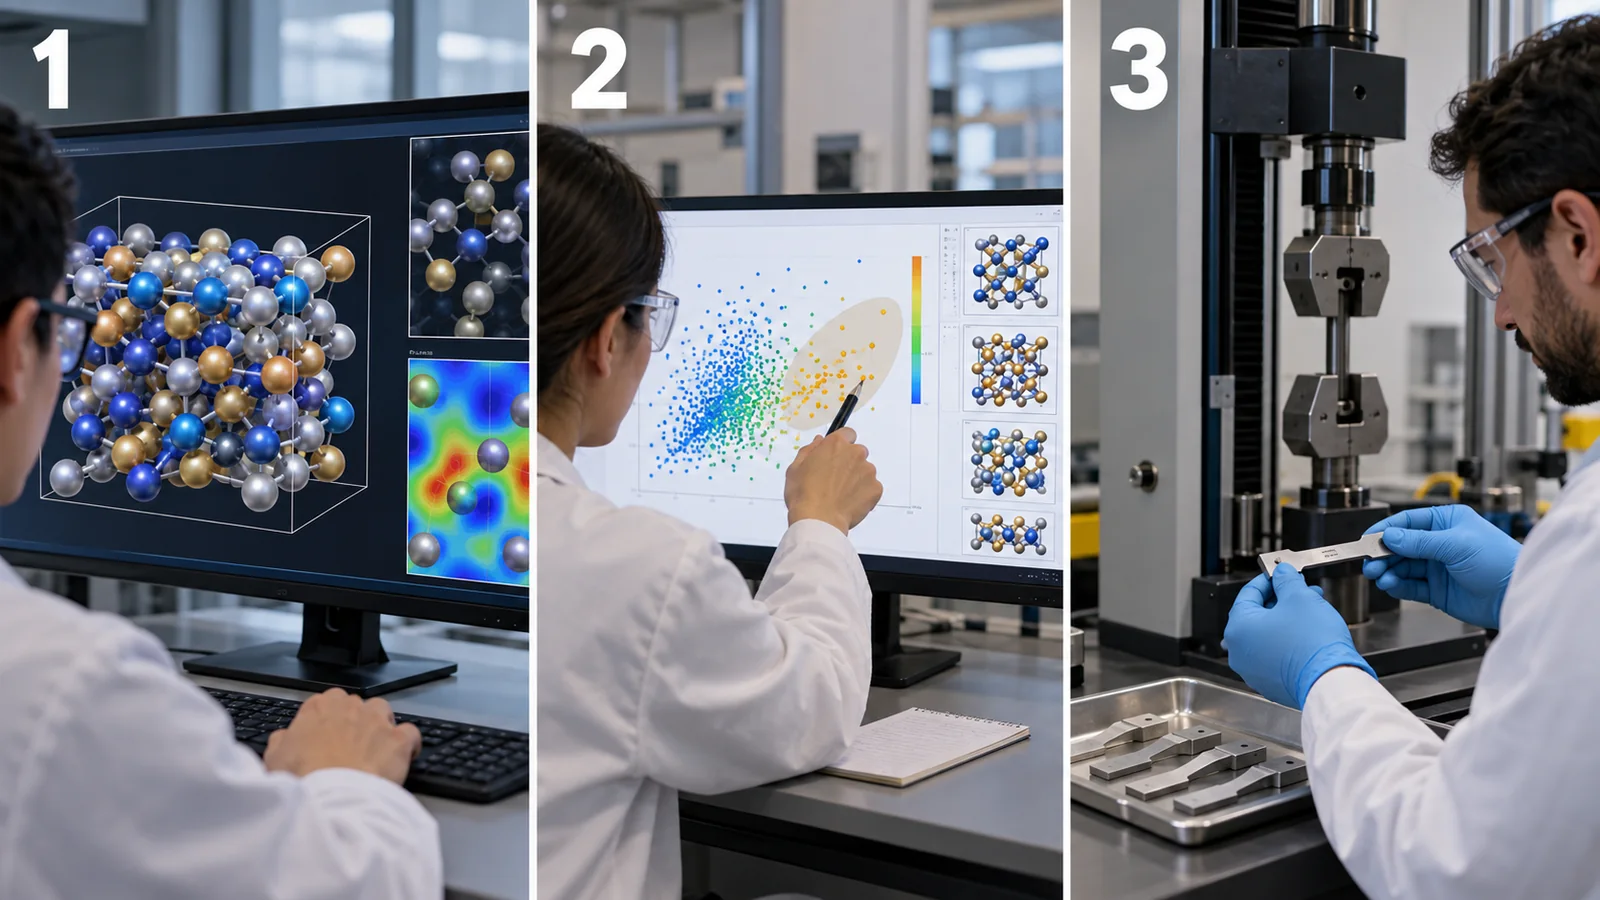
View original SVG, values and sources
Original SVG reference: Concept diagram (vector illustration). The roles of calculation, AI and experiment, as used throughout this series. AI is a tool that narrows where to look; it does not "invent" materials.
- Calculation: phase-diagram calculation (CALPHAD) computes the stability of phases from thermodynamic databases. First-principles calculation (DFT) is a physical simulation that computes properties from the behaviour of electrons. Both include approximations and may not agree with measurements.
- AI: learns trends from past data and proposes candidates to try next. Methods that also give how certain a proposal is (Gaussian processes, ensembles and so on) can tune whether to "try places not yet tried" or to "dig near where a hit was found". In the shape memory alloy search, an adaptive design that makes this "balance of exploitation and exploration" explicit was used Sourced [Reference 8].
- Experiment: make the proposed compositions and measure them. Feeding the results back into the data updates the next proposal (a closed loop). Most cases in this article include this "feeding back" step.
In the cast aluminium example, the three parties form one flow. Phase-diagram calculation gave the microstructure, this was added to the training data of a neural network, and together with a few experimental results Bayesian optimization chose the next composition Sourced [Reference 9] (chapter 6). Calculation "gives candidates cheaply and fast", AI "narrows where to look", and experiment "checks whether it is true".
4. Steel data: fatigue strength and the Matbench yield-strength task
Steel is one of the structural materials with the most complete datasets in MI research. Here we read two examples that use public data. Both are about prediction accuracy; neither is about making a new steel. To understand the numbers, we first explain two indicators with a small example.
Suppose three specimens have measured fatigue strengths of 400, 500 and 600 MPa, and a model predicts 420, 500 and 580 MPa. MAE (mean absolute error) is the average size of the miss: (20 + 0 + 20) / 3 = about 13.3 MPa. It has the same unit as the strength (MPa), so it is intuitive Our calculation.
R² (coefficient of determination) shows how much the misses shrank compared with always answering the average. Here the sum of squared deviations from the mean (500 MPa) is 20,000 and the sum of squared prediction errors is 800, so R² = 1 - 800 / 20,000 = 0.96 Our calculation. R² = 1 means every point is hit, 0 means no better than answering the average, and a negative value means worse than answering the average.
In other words, MAE is "how many MPa it misses by on average" and R² is "how much better than the average it is". With a wide spread of strengths, a high R² can still go with a large MAE. Look at both.
(1) NIMS rotating-bending fatigue data (Agrawal et al., 2014)
NIMS (National Institute for Materials Science, Japan) publishes fatigue data sheets for structural materials. According to a 2019 review, there were 126 data sheets at that time, covering carbon steels, low-alloy steels, stainless steels, high-strength steels, aluminium alloys, titanium alloys and others, with several heats tested per grade to examine scatter. They were once viewable on MatNavi and were to be published on NIMS's Materials Data Repository (MDR) Sourced [Reference 3].
Agrawal and co-workers used part of these data to predict the fatigue strength of steel (rotating-bending fatigue, strength at 10⁷ cycles) from composition and processing conditions Sourced [Reference 2].
- Data: 437 records: 371 carbon and low-alloy steels, 48 carburizing steels and 18 spring steels. There are 25 inputs: composition (wt.% of C, Si, Mn, P, S, Ni, Cr, Cu, Mo), upstream processing (ingot size, reduction ratio, inclusions) and heat treatment (normalizing, through-hardening, carburizing, tempering temperatures, times and cooling rates).
- Methods: 12 kinds (linear regression, support vector machine, decision trees, neural network, multivariate polynomial regression and others).
- Validation: LOOCV (leave-one-out cross-validation): hold out one record, learn from the rest, and predict the held-out record, one record at a time.
- Result: MAE ranged from 18.6 to 46.0 MPa and R² from 0.90 to 0.98. The top methods (multivariate polynomial regression, M5 model tree, neural network, REPTree) had R² above 0.97. The authors say accuracy improved over earlier work on the same data (R² of 0.88 to 0.94).
This is a good result as a prediction inside the data. But from what the paper describes, we read it with the following cautions (commentary from here on).
- The data fall into groups by steel grade (carbon and low-alloy, carburizing, spring). The paper also says clustering showed three groups [Reference 2].
- LOOCV leaves other specimens of the same heat and grade on the training side. This check cannot measure the ability to predict a "new steel grade" or a "new heat".
- We did not check whether the comparison with the earlier work used the same validation.
NIMS tested several heats per grade to learn the scatter between heats [Reference 3]. When you evaluate machine learning too, do not split specimens of the same heat between training and testing; the evaluation then comes closer to "does it hold for a new heat". A stricter evaluation holds out a whole grade (chapter 5).
In your own data, check whether the specimen ID carries a heat number. Without it you will be stuck when you design the evaluation. Examples of what to record are in the figure of chapter 8.
(2) The Matbench steels task: predicting yield strength from composition alone
Matbench is a common problem set for comparing methods that predict materials properties. Dunn and co-workers released it in 2020. It has 13 tasks (from 312 to about 132,000 records, from 10 data sources), and every task is evaluated with the same 5-fold nested cross-validation Sourced [Reference 4]. The steels task has 312 experimental records and is a regression predicting the yield strength (MPa) of steel from composition alone. The data come from a dataset of mechanical properties of steels provided by Citrine Informatics (Conduit and Bajaj, 2017) [References 4, 5].
On the official leaderboard (checked 22 October 2026), the baseline that "always answers the mean of the training data" (Dummy) has an MAE of 229.7 MPa, and the submitted methods range from 79.9 MPa (TPOT-Mat) to 143.0 MPa (gptchem) Sourced [Reference 5]. Every method has a smaller error than the "answer the mean" baseline, but a gap of tens of MPa on average remains.
Fatigue strength (Agrawal et al.) and yield strength (Matbench) differ in target variable, data, inputs and validation. The former has 25 inputs including processing and heat treatment; the latter has composition only. You cannot read "MAE of about 19 MPa versus about 80 MPa" as the former being better.
What we can say is that, because properties change with processing and heat treatment even at the same composition, composition-only input probably lacks information, and this result does not contradict that metallurgical common sense (commentary). Matbench is built as a "common yardstick" that compares all tasks by one procedure, and its authors themselves say that a split suited to the domain may estimate generalization error better [Reference 4].
5. A pitfall in splitting data: when lots of the same grade fall on both sides
Evaluating machine learning rests on testing the model on "data not used for learning". But alloy data contain many similar specimens of the same grade and heat. If you split the data at random, the "siblings" of every test specimen stay on the training side, and a high score comes just from borrowing the answer from next door (commentary).
Meredig and co-workers pointed this out in the context of materials discovery and reported that conventional machine-learning metrics overestimate performance for materials discovery. They proposed cross-validation that holds out a whole cluster of similar items (LOCO CV) Sourced [Reference 18]. Dunn and co-workers also say that cross-validation that splits by group is closer to the real use of predicting "chemical systems with no data" [Reference 4].
We reproduced this phenomenon with synthetic data small enough to check by hand.
- Data (made up): 12 steel grades, 25 heats each, 300 records in total. The centres of four inputs (numbers imitating composition and processing) are placed far apart per grade, and each grade is given a level offset that does not appear in the inputs (standard deviation 70 MPa). Heat-to-heat scatter is small and measurement noise is 12 MPa.
- Models: a "nearest-neighbour" model that answers with the average of the 3 closest records, and "linear regression" that fits a straight line.
- Evaluation: a random 5-fold split, and a split that holds out one whole grade.
Result (random seed 0): for nearest neighbours, R² was 0.978 (MAE 11.5 MPa) with the random split and -0.21 (MAE 76.0 MPa) with a grade held out. The medians over 20 random seeds are 0.976 and -0.31 (the range with a grade held out was -1.18 to 0.48). Linear regression gave 0.63 and -0.29 (seed 0): a straight-line fit also cannot pick up the level offset of each grade, so it did not work on an unseen grade Our calculation.
Our calculation. Python (NumPy), double precision. The data are made up for this article and are not properties of real steel. The point is not the size of the numbers but that "the same model can look very good, or worse than answering the average, depending only on the split".
In fact: R² only means something together with "how the data were split and what it was measured against". A high R² under a random split or LOOCV is a result under conditions where specimens of the same grade and heat are nearby. If you use the model on a new grade or on a composition range with no data (that is, extrapolate), you need to look at the error measured with such a split. In the synthetic data, an R² of 0.98 under the random split turned negative when a grade was held out Our calculation.
Holding out by heat, by grade, by composition system, or by year makes the evaluation stricter in that order. No one is "correct"; it depends on what you will use the model for. For "quality prediction of a new lot of the same grade", splitting by heat is probably enough. For "proposing candidates for a new grade", you need to split by grade. Decide the use first, then decide the split (commentary).
6. Designs verified by experiment: superalloys, shape memory alloys, cast aluminium, steel, high-entropy alloys
From here we read cases where "an alloy proposed by AI was actually made and measured". For each case we separate who made how many alloys, what was measured and what it was compared with. The numbers are as stated in the abstract or text of each paper.
(1) Searching for shape memory alloys by adaptive design (Xue et al., 2016)
In NiTi-based shape memory alloys, the transformation temperature differs between heating and cooling (thermal hysteresis, ΔT). A smaller gap is generally considered favourable for repeated use. Starting from 22 records of existing data, Xue and co-workers proposed the next composition, made and measured it, and fed the result back, repeating this 9 times. The search space was about 800,000 compositions. They made and measured 36 compositions, and 14 had a smaller ΔT than any of the original 22. The smallest was 1.84 K, for Ti50.0Ni46.7Cu0.8Fe2.3Pd0.2 Sourced [Reference 8].
In the treasure-hunt analogy, "exploitation" is digging more near where you found a hit, and "exploration" is trying places you have not dug yet. If you lean to one side, you either keep digging next door and miss other treasure, or spread out so widely that you never get closer to a hit. The method of Xue and co-workers chooses the next experiment while balancing the two [Reference 8]. This mechanism is covered in detail in our explainer on Bayesian optimization and active learning.
(2) A nickel-base superalloy and a molybdenum-base alloy meeting several conditions (Conduit et al.)
Conduit and co-workers built a computational tool that trains a neural network on existing data, predicts each property from composition and heat treatment, and searches for the alloy most likely to meet the targets. In designing a polycrystalline nickel-base superalloy they considered up to eleven conditions at once: cost, density, amount and solvus temperature of the γ′ phase, phase stability, fatigue life, yield stress, ultimate tensile strength, stress rupture, oxidation resistance and elongation. The authors report that experimental data show the proposed alloy meets the computed predictions and, in particular, exceeds commercial alloys in oxidation resistance and yield stress Sourced [Reference 6]. In the following molybdenum-base alloy, a similar design was done with the conditions of cost, phase stability, precipitate content, yield stress and hardness, and the authors report that its physical properties exceed commercial molybdenum-base alloys for forging dies [Reference 7].
The point to note is that cost and phase stability are among the conditions. The design looks for "an alloy that is strong within what can be made and bought", not just "a strong alloy". On the other hand, the abstracts do not give the number of experiments, the names of the commercial alloys compared, or the numerical values. We could not confirm the full text, so we do not quote numbers (an item we could not confirm).
(3) A cast aluminium alloy linking computational thermodynamics, machine learning and experiment (Zhang et al., 2023)
Zhang and co-workers designed the addition of Ti to an Al-Si-Mg-Sr casting alloy (A356-0.005Sr) to raise strength and ductility at the same time, combining phase-diagram calculation (CALPHAD), machine learning and experiment within a Bayesian optimization framework. They made six alloys with different Ti contents, used their measured mechanical properties for learning, and the recommended Ti content was 0.08 wt.%. When that composition was actually made and measured, the ultimate tensile strength was 199.6 MPa, the 0.2% yield strength 101.6 MPa and the elongation 12.3%, and the authors say this agreed well with the prediction Sourced [Reference 9].
This example shows that "even with small data, calculation and experiment together can narrow things down", but the only variable moved was the amount of Ti (in a low-addition range), so it is not a high-dimensional search (commentary). We did not check details such as the heat-treatment state of the specimens.
(4) A TWIP steel designed from literature data (Zhou et al., 2024)
Zhou and co-workers compared several machine-learning methods on 273 literature records for TWIP (twinning-induced plasticity) steel and built models predicting yield strength, tensile strength and elongation. Using SHAP analysis (a way to measure how much each input affected a prediction) and multi-objective optimization, they designed two new TWIP steels and made and measured them by a conventional route (hot forging, hot rolling, cold rolling and annealing). Yield strengths were 585 and 560 MPa, tensile strengths 1,055 and 1,101 MPa, and elongations 55% and 58.5%. The authors state that the yield strength, a known weakness of TWIP steel, was improved while the product of strength and elongation (58.0 and 66.4 GPa%) was kept Sourced [Reference 10]. We did not check the numerical values of the conventional TWIP steels used for comparison.
(5) High-entropy alloys and superalloys, updated with few experiments
- Raising hardness (Wen et al., 2019): in the Al-Co-Cr-Cu-Fe-Ni system, combining a machine-learning surrogate model with an experimental design method, they report making an alloy 10% harder than the best value in the original training data in only seven experiments. They also say that using descriptors based on alloy properties, as well as composition, worked better than composition alone Sourced [Reference 11].
- An Invar alloy with low thermal expansion (Rao et al., 2022): with closed-loop active learning that combines machine learning, DFT, thermodynamic calculations and experiments, they made and measured 17 new alloys out of millions of possible compositions, and report finding two high-entropy Invar alloys with an extremely low thermal expansion coefficient of about 2 × 10⁻⁶ K⁻¹ at 300 K Sourced [Reference 12].
- γ′ solvus temperature of superalloys (Liao et al., 2024): starting from sparse data, using clustering and other unsupervised learning, they report finding nine new superalloys whose chemistries differ from those in the training data, and three of them had a γ′ solvus temperature about 50 °C higher. It is an attempt to make up for the weakness of prediction-centred searches, which tend to stay inside the data (interpolation), by sampling aimed at extrapolation Sourced [Reference 13].
The definition and properties of high-entropy alloys are covered in detail in our explainer on high-entropy alloys. What we want to point out here is not how large the results are but how many experiments, and for which property, were used to verify. Hardness, thermal expansion coefficient and γ′ solvus temperature are each a single property; they do not verify the other properties needed to use the alloy as a structural material (toughness, corrosion resistance, workability, cost and so on) (commentary).
(6) The cases side by side: what was verified, how many, and how far
| Case | Data and method | What was verified by experiment (as stated in the paper) | Cautions (commentary) |
|---|---|---|---|
| Nickel-base superalloy [6] | Neural network on existing data; up to 11 conditions | The proposed alloy meets the computed predictions, and its oxidation resistance and yield stress exceed commercial alloys | No number of experiments or values in the abstract; no independent replication found |
| Molybdenum-base alloy [7] | Same; 5 conditions (cost, phase stability, precipitate content, yield stress, hardness) | The proposed alloy meets the predictions and exceeds commercial molybdenum-base alloys in properties | Same as above |
| NiTi shape memory alloy [8] | 22 original records, space of about 800,000, adaptive design | 36 compositions made and measured; 14 had a smaller ΔT than any original record; smallest 1.84 K | One property (ΔT). The success rate is a number inside this search |
| Cast aluminium (Ti addition) [9] | CALPHAD + neural network + Bayesian optimization; 6 experimental points | 0.08 wt.% Ti: UTS 199.6 MPa, yield 101.6 MPa, elongation 12.3% | Only the amount of Ti was varied |
| TWIP steel [10] | 273 literature records, comparison of methods, SHAP, multi-objective optimization | Two new steels: yield 585/560 MPa, UTS 1,055/1,101 MPa, elongation 55/58.5% | Numbers for conventional steel not checked |
| High-entropy alloy (hardness) [11] | Al-Co-Cr-Cu-Fe-Ni, surrogate model + experimental design | In 7 experiments, an alloy 10% harder than the best in the training data | Hardness only |
| High-entropy Invar alloy [12] | Closed loop of ML + DFT + thermodynamic calculation + experiment | Of 17 new alloys, two with a thermal expansion coefficient of about 2 × 10⁻⁶ K⁻¹ at 300 K | Thermal expansion only; other properties not checked |
| Superalloy (γ′ solvus) [13] | Sparse data + clustering etc. for extrapolation | Nine new alloys; three with about 50 °C improvement | γ′ solvus temperature only |
All Sourced (abstracts and text of each paper, checked 22 October 2026). The right-hand column is our commentary. The arrangement of the table is Our calculation (organization).
In fact: in the cases above, what AI (machine learning) did was to learn trends from past data and propose "compositions that look good to try next". Melting, processing, measuring and verifying the alloys were done by people and laboratory equipment. And the number of alloys made and measured was small: 36 (shape memory alloy), 17 (Invar alloy), 7 experiments (a harder alloy) and so on, a few to a few dozen. "Narrowed where to look and found hits with a few experiments" is closer to what the papers describe than "invented" (commentary).
7. Cases that stop at calculation, and composites
(1) Confirmation by calculation and confirmation by experiment are different
Pei and co-workers used a dataset of 1,252 multicomponent alloys to predict by machine learning whether a solid solution forms, and report an accuracy of 93%. They also built a new rule with a physical basis that uses only elemental properties (accuracy 73%), predicted solid solutions for combinations in three blocks of nine elements each, and say the agreement with phase-diagram calculation (CALPHAD) was 94% Sourced [Reference 14].
What was used for confirmation here was another calculation (CALPHAD), not an experiment measuring newly made alloys. Nor does the abstract say with what split (random, or by composition system) the 93% was obtained, and we did not check it. Kaufmann and Vecchio's ML-HEA was also validated by comparing the model with reliable experimental data for binary to quinary systems, and compared with methods such as CALPHAD Sourced [Reference 15]. This is comparison with existing experimental data, not measurement of newly made alloys.
Agreement between calculations shows that "the prediction is consistent with another calculation". That is an important check, but it is different from confirming that a real alloy can be made and shows the intended property (commentary).
(2) Composites: create data by simulation, then print and test
For composites (combinations of hard and soft materials and so on), experimental data are scarce, so some studies create data by finite-element analysis (FEA). Gu and co-workers trained a convolutional neural network on finite-element data for hundreds of thousands of structures, used a self-learning algorithm to create microstructural patterns of hierarchical materials that are stronger and tougher, and report that they confirmed this by additive manufacturing (3D printing) and testing Sourced [Reference 16]. The review by Chen and Gu summarizes, as an outlook, progress in applying machine learning to the analysis and design of composites [Reference 17].
How to read it: the training data in the work of Gu and co-workers are simulations, not experiments, and the tests were done on printed specimens. For structural fibre-reinforced composites (such as carbon-fibre-reinforced plastics), we could not find, within our search, a case where a machine-learning design proposal was made and tested. Composites are set by many factors (stacking sequence, fibre orientation, moulding conditions, interfaces), so designing the input is harder than for metal alloys (commentary).
8. A materials engineer's view: your own data and experiment design
From the cases so far, we pick out three points that help when you use your own alloy data for machine learning. All of them are our commentary, not an official guideline.
Of the five items in the figure, the heat number and the test standard and edition are especially hard to reconstruct later. With a heat number you can split an evaluation by heat or by grade (chapter 5). With the test standard and edition you can judge whether data from different periods may be mixed (chapter 10).
Please also keep the failure data from your lab notebook in the ledger (cracked, did not melt, could not be measured). Papers centre on successes and failures rarely appear in them (commentary), yet failure data help you learn "where predictions miss".
When you test a proposal from AI, decide the following before you see the result: the comparison material (a conventional material made in the same furnace, from the same lot and tested on the same machine), the number of repeats (to see whether the difference is larger than the scatter between heats), the test standard and edition (for tensile tests, ISO 6892-1 or JIS Z 2241; for rotating-bending fatigue, ISO 1143 or JIS Z 2274 and so on [References 20 to 23]), and the pass criterion (what counts as a "hit").
In the shape memory alloy example, the criterion was "smaller than any of the original 22 records" [Reference 8]. A criterion should be set to suit your own use. Not moving the criterion afterwards is the first step to reproducibility.
Easier to hand over: organizing huge numbers of combinations, visualizing trends, listing "places not yet tried", and ranking the next candidates.
Where expert judgement is needed: castability, weldability and workability; cost and supply; properties not included in the target such as corrosion; fit with standards and customer specifications; and judging the quality of the data (whether measurement conditions are consistent). The design of Conduit and co-workers included cost and phase stability among its conditions [Reference 6]. AI does not consider a property that is not put into the conditions. Deciding what to put in is the expert's job.
9. Limits, what we could not confirm / summary
(1) Depth of checking of the papers
We checked the review by Hart and co-workers, the two papers by Conduit and co-workers, the paper by Wen and co-workers, the paper by Kaufmann and Vecchio and the review by Chen and Gu within the abstract (or a published summary). We read the text of the papers by Agrawal and co-workers and by Dunn and co-workers, the review by Furuya and co-workers and the paper by Zhang and co-workers (the results numbers). The papers by Rao and co-workers, Liao and co-workers and Xue and co-workers were checked within the abstract. We did not check the validation procedure in the text (split, uncertainty, basis of comparison).
(2) Independent replication
For the cases in chapter 6, we could not find replication by an independent laboratory or reproduction on a different lot. We treat them as claims of the papers.
(3) Practical use and mass production
We could not confirm from primary sources that a proposed alloy was adopted in a part or standard or mass-produced. We have not written "commercialized" claims that rest only on announcements by companies or institutes.
(4) What we did not cover
Atomistic simulation of alloys with machine-learning interatomic potentials, process optimization in additive manufacturing, machine learning for corrosion, hydrogen embrittlement and fatigue cracks, and control of steelmaking processes are not covered. MLIPs are covered in our explainer on machine-learning interatomic potentials. Apart from the Matbench steels task (312 records, composition only), we did not confirm any common benchmark specific to alloys.
(5) Comparing numbers
Data, splits, metrics and test conditions differ from paper to paper. This article does not rank any method, alloy or research group.
- MI is a tool for narrowing the search range for alloys. Mixing five elements in 1 at.% steps gives about 4.6 million compositions, too many to try all Our calculation. The properties of an alloy change with processing, heat treatment and heat, not only composition.
- "Verified" comes in levels. Validation inside the data (LOOCV and so on), agreement with another calculation (CALPHAD and so on) and a few trial melts can be told apart, and we could not find independent replication Sourced.
- The cases verified by experiment are a few to a few dozen trial alloys, for a single property. The shape memory alloy search made 36 compositions, the Invar search 17 alloys and the harder-alloy search 7 experiments Sourced.
- A high R² alone does not make a model usable for a new steel grade. In synthetic data, the median R² of 0.98 under a random split became -0.31 (median) when a whole grade was held out Our calculation.
- In your own work, record heat numbers, test standards and failure data in a ledger, and decide the control and repeats before you verify. AI considers only the properties you put into the conditions.
10. How to read the yardsticks and standards
The quality of MI for alloys is measured with three yardsticks: prediction error (MAE, R²), how the data were split, and whether and how many alloys were verified by experiment. Error shows "how far it misses on average", the split shows "whether it also holds for new steel grades or compositions", and experimental verification shows "whether the alloy could really be made and measured". No single one of them tells the whole story. Meanwhile, measurements themselves have mechanical-testing standards (ISO, JIS). These define test methods; they do not decide how good an AI prediction is. We could not find a standard specific to MI for alloys. The checking date is 22 October 2026.
| What is evaluated | Representative benchmark or evaluation method (name, source) | Standards and guidance (ISO/IEC, JIS, FAIR and so on) | Cautions when reading |
|---|---|---|---|
| Prediction error (MAE, R²) | Matbench steels task (312 records, composition only, yield strength; 5-fold nested cross-validation) [4, 5] / fatigue strength of steel by Agrawal et al. (437 records, LOOCV) [2] Sourced | Could not be confirmed (a standard defining the prediction error of regression) | Look at both MAE and R². Do not rank numbers whose target, inputs and validation differ |
| How the data are split (generalization) | LOCO CV and the nearest-neighbour benchmark (Meredig et al., 2018) [18] / discussion of cross-validation by group (Dunn et al., 2020) [4] Sourced / synthetic data of this article (chapter 5) Our calculation | Could not be confirmed | Numbers from a random split or LOOCV hold where the same grade and heat are nearby. Split to suit the use |
| Confirmation by experiment | The statements in each paper (NiTi: 36 compositions, 14 beat the original data [8]; Invar alloy: 17 alloys [12]; others) Sourced | Could not be confirmed (a standard defining the verification procedure, number of alloys or criterion for alloys proposed by MI) | Check the number of alloys, the comparison material, the repeats and whether there is independent replication. Do not move the criterion afterwards |
| Measuring tensile properties | - | ISO 6892-1:2019 "Metallic materials - Tensile testing - Part 1: Method of test at room temperature" (published November 2019, confirmed after review in 2025 and still current) [20] / JIS Z 2241 "Method of tensile test for metallic materials" (title in Japanese) [23] Sourced | A standard is a test method. Values change with the specimen, strain rate and edition. We did not check the full text to see how closely ISO and JIS agree |
| Measuring fatigue properties | NIMS fatigue data sheets (126 sheets, as of the 2019 review) [3] Sourced | ISO 1143:2021 "Metallic materials - Rotating bar bending fatigue testing" (published July 2021) [21] / ISO 1099:2026 "Metallic materials - Fatigue testing - Axial force-controlled method" (published October 2026; the 2017 edition is withdrawn) [22] / JIS Z 2274 "Testing method for rotating bending fatigue of metallic materials" (title in Japanese) [23] Sourced | We did not check which standard and edition the NIMS data follow. Procedures may change when an edition is revised |
| Publishing and reusing data | NIMS MDR (publishes the fatigue data sheets with DOIs) [3] | FAIR principles (Wilkinson et al., 2016) [19] / ISO/IEC 5259-1:2024 "Artificial intelligence - Data quality for analytics and machine learning (ML) - Part 1: Overview, terminology, and examples" (published July 2024) [25] Sourced | FAIR is a set of principles (recommended) and is not legally binding. The full text of ISO/IEC standards is paid, so we did not check the requirements |
| Terms for AI | - | ISO/IEC 22989:2022 "Artificial intelligence concepts and terminology" (published July 2022) [24] Sourced | A standard of terms. It does not decide how good an alloy prediction is |
| A standard specific to MI for alloys | Could not be confirmed | Could not be confirmed | Read the conditions in each paper, on the premise that there is no common pass criterion |
The arrangement of the table is Our calculation (organization). Numbers, titles, publication dates and status of standards were checked on the official ISO pages and the JIS search of the Japanese Industrial Standards Committee (JISC) (checked 22 October 2026). The full texts are paid, so we stay with the scope statements. ASTM standards are not covered in this article, and we did not consult the ASTM site.
Cautions when reading (for materials engineers)
- A leaderboard score is not the strength of your own alloy: the top methods in the Matbench steels task give numbers for 312 records with composition only. It is worth re-measuring on your own grades, your own processing conditions and your own tests.
- Prediction and experimental verification are different questions: even with a high R², it remains a "prediction" until you make and measure the alloy. Conversely, one hit in an experiment must be checked for chance with repeats and a control.
- A standard is a "test method" and does not guarantee "alloy quality": ISO 6892-1 and ISO 1143 define how to measure. Even a value from a "test following the standard" changes with specimen, edition and conditions. The FAIR principles are also a recommendation and do not guarantee that data are correct.
- Plans and achievements differ: the 2026 edition of ISO 1099 was published only in October 2026. The old edition (2017) is withdrawn. When you quote a measured result, add the edition of the standard.
11. Glossary
- MI (materials informatics)
- Using materials data and machine learning to advance the search for and design of materials.
- Machine learning
- An approximator that learns trends from past data. Weak outside the range of the data.
- Regression
- A machine-learning task of predicting a number such as strength.
- Heat
- A batch of steel or alloy made from one melt (a melt lot).
- Steel grade
- A type of steel classified by composition and manufacturing route (carbon steel, carburizing steel, spring steel and so on).
- Rotating-bending fatigue
- A test that applies bending load to a rotating round bar to examine fatigue.
- Fatigue strength (10⁷ cycles)
- The stress endured for 10⁷ load cycles.
- Cross-validation
- Splitting the data, hiding part of it to test the prediction, then swapping and repeating.
- LOOCV
- Cross-validation that holds out one record at a time (leave-one-out).
- LOCO CV
- Cross-validation that holds out a whole cluster of similar items. Used to evaluate extrapolation.
- R² (coefficient of determination)
- How much the misses shrank compared with answering the average. Can be negative.
- MAE (mean absolute error)
- The average size of the prediction misses. Same unit as the target.
- Interpolation / extrapolation
- Predicting inside / outside the range of the data. Extrapolation is hard.
- CALPHAD
- A method that computes phase diagrams and phase stability from thermodynamic databases.
- DFT (density functional theory)
- A physical simulation that computes properties from the behaviour of electrons. Includes approximations.
- Bayesian optimization
- A way of choosing the next point to try wisely with few trials. Balances exploitation and exploration.
- Adaptive design / active learning
- Choosing the next experiment again from the results so far.
- Closed loop
- A mechanism that repeats proposal, experiment and feeding back into the data.
- Surrogate model
- An approximate model that predicts results quickly in place of an expensive calculation or experiment.
- SHAP
- An analysis that gives, as numbers, how much each input affected a prediction.
- Thermal hysteresis ΔT
- In a shape memory alloy, the temperature gap between forward and reverse transformation.
- γ′ phase
- The precipitate phase that strengthens nickel-base superalloys. Its solvus temperature is one measure of heat resistance.
- TWIP steel
- A high-manganese steel whose elongation comes from twins formed during deformation (twinning-induced plasticity steel).
- Invar alloy
- An alloy with extremely small thermal expansion.
- FAIR principles
- Principles for making data findable, accessible, interoperable and reusable.
12. References (primary sources)
- Hart G. L. W., Mueller T., Toher C., Curtarolo S. "Machine learning for alloys", Nature Reviews Materials 6, 730-755 (2021), DOI 10.1038/s41578-021-00340-w (abstract checked) - doi.org/10.1038/s41578-021-00340-w
- Agrawal A., Deshpande P. D., Cecen A., Basavarsu G. P., Choudhary A. N., Kalidindi S. R. "Exploration of data science techniques to predict fatigue strength of steel from composition and processing parameters", Integrating Materials and Manufacturing Innovation 3, 8 (2014), DOI 10.1186/2193-9772-3-8 (open access, full text checked) - doi.org/10.1186/2193-9772-3-8
- Furuya Y., Nishikawa H., Hirukawa H., Nagashima N., Takeuchi E. "Catalogue of NIMS fatigue data sheets", Science and Technology of Advanced Materials 20, 1055-1072 (2019), DOI 10.1080/14686996.2019.1680574 (open access, full text checked) - doi.org/10.1080/14686996.2019.1680574
- Dunn A., Wang Q., Ganose A., Dopp D., Jain A. "Benchmarking materials property prediction methods: the Matbench test set and Automatminer reference algorithm", npj Computational Materials 6, 138 (2020), DOI 10.1038/s41524-020-00406-3 (open access, full text checked) - doi.org/10.1038/s41524-020-00406-3
- Matbench official page "matbench_steels" (leaderboard and data description, checked 22 October 2026) - matbench.materialsproject.org/.../matbench_v0.1_matbench_steels/
- Conduit B. D., Jones N. G., Stone H. J., Conduit G. J. "Design of a nickel-base superalloy using a neural network", Materials & Design 131, 358-365 (2017), DOI 10.1016/j.matdes.2017.06.007 (abstract checked on arXiv:1803.03039) - doi.org/10.1016/j.matdes.2017.06.007
- Conduit B. D., Jones N. G., Stone H. J., Conduit G. J. "Probabilistic design of a molybdenum-base alloy using a neural network", Scripta Materialia 146, 82-86 (2018), DOI 10.1016/j.scriptamat.2017.11.008 (abstract checked) - doi.org/10.1016/j.scriptamat.2017.11.008
- Xue D., Balachandran P. V., Hogden J., Theiler J., Xue D., Lookman T. "Accelerated search for materials with targeted properties by adaptive design", Nature Communications 7, 11241 (2016), DOI 10.1038/ncomms11241 (open access, abstract checked) - doi.org/10.1038/ncomms11241
- Zhang S., Yi W., Zhong J., Gao J., Lu Z., Zhang L. "Computer Alloy Design of Ti Modified Al-Si-Mg-Sr Casting Alloys for Achieving Simultaneous Enhancement in Strength and Ductility", Materials 16, 306 (2023, published online 28 December 2022), DOI 10.3390/ma16010306 (open access, full text checked) - doi.org/10.3390/ma16010306
- Zhou X., Xu J., Meng L., Wang W. et al. "Machine-Learning-Assisted Composition Design for High-Yield-Strength TWIP Steel", Metals 14, 952 (2024), DOI 10.3390/met14080952 (open access, abstract checked) - doi.org/10.3390/met14080952
- Wen C., Zhang Y., Wang C., Xue D. et al. "Machine learning assisted design of high entropy alloys with desired property", Acta Materialia 170, 109-117 (2019), DOI 10.1016/j.actamat.2019.03.010 (abstract checked) - doi.org/10.1016/j.actamat.2019.03.010
- Rao Z., Tung P.-Y., Xie R. et al. "Machine learning-enabled high-entropy alloy discovery", Science 378, 78-85 (2022), DOI 10.1126/science.abo4940 (abstract checked) - doi.org/10.1126/science.abo4940
- Liao W., Yuan R., Xue X., Wang J. et al. "Unsupervised learning-aided extrapolation for accelerated design of superalloys", npj Computational Materials 10, 171 (2024), DOI 10.1038/s41524-024-01358-8 (open access, abstract checked) - doi.org/10.1038/s41524-024-01358-8
- Pei Z., Yin J., Hawk J. A., Alman D. E., Gao M. C. "Machine-learning informed prediction of high-entropy solid solution formation: Beyond the Hume-Rothery rules", npj Computational Materials 6, 50 (2020), DOI 10.1038/s41524-020-0308-7 (open access, abstract checked) - doi.org/10.1038/s41524-020-0308-7
- Kaufmann K., Vecchio K. S. "Searching for high entropy alloys: A machine learning approach", Acta Materialia 198, 178-222 (2020), DOI 10.1016/j.actamat.2020.07.065 (abstract checked) - doi.org/10.1016/j.actamat.2020.07.065
- Gu G. X., Chen C.-T., Richmond D. J., Buehler M. J. "Bioinspired hierarchical composite design using machine learning: simulation, additive manufacturing, and experiment", Materials Horizons 5, 939-945 (2018), DOI 10.1039/C8MH00653A (abstract checked) - doi.org/10.1039/c8mh00653a
- Chen C.-T., Gu G. X. "Machine learning for composite materials", MRS Communications 9, 556-566 (2019), DOI 10.1557/mrc.2019.32 (abstract checked) - doi.org/10.1557/mrc.2019.32
- Meredig B., Antono E., Church C. et al. "Can machine learning identify the next high-temperature superconductor? Examining extrapolation performance for materials discovery", Molecular Systems Design & Engineering 3, 819-825 (2018), DOI 10.1039/C8ME00012C (abstract checked) - doi.org/10.1039/C8ME00012C
- Wilkinson M. D. et al. "The FAIR Guiding Principles for scientific data management and stewardship", Scientific Data 3, 160018 (2016), DOI 10.1038/sdata.2016.18 - doi.org/10.1038/sdata.2016.18
- ISO "ISO 6892-1:2019 Metallic materials - Tensile testing - Part 1: Method of test at room temperature" (ISO page) - iso.org/standard/78322.html
- ISO "ISO 1143:2021 Metallic materials - Rotating bar bending fatigue testing" (ISO page) - iso.org/standard/79575.html
- ISO "ISO 1099:2026 Metallic materials - Fatigue testing - Axial force-controlled method" (ISO page) - iso.org/standard/85731.html
- Japanese Industrial Standards Committee (JISC) JIS search (numbers and titles of JIS Z 2241 and JIS Z 2274 checked; titles in Japanese) - jisc.go.jp/app/jis/general/GnrJISSearch.html
- ISO/IEC "ISO/IEC 22989:2022 Information technology - Artificial intelligence - Artificial intelligence concepts and terminology" (ISO page) - iso.org/standard/74296.html
- ISO/IEC "ISO/IEC 5259-1:2024 Artificial intelligence - Data quality for analytics and machine learning (ML) - Part 1: Overview, terminology, and examples" (ISO page) - iso.org/standard/81088.html
13. Claim-to-source audit
| Claim in the text | Basis | Label |
|---|---|---|
| Machine learning and alloys have spread to metallic glasses, high-entropy alloys, shape memory alloys, magnets, superalloys, catalysts and structural materials, and the review summarizes theoretical predictions and experimental validations | Abstract of Hart et al. (2021) Reference 1 https://doi.org/10.1038/s41578-021-00340-w | Sourced |
| NIMS fatigue data: 437 records (371 carbon and low-alloy steels, 48 carburizing, 18 spring), 25 inputs, rotating-bending fatigue (10⁷ cycles), 12 methods, LOOCV, MAE 18.6 to 46.0 MPa, R² 0.90 to 0.98, earlier work R² 0.88 to 0.94, three clusters | Text of Agrawal et al. (2014) Reference 2 https://doi.org/10.1186/2193-9772-3-8 | Sourced |
| The NIMS fatigue data sheets number 126 (as of 2019), several heats were tested per grade (ten or more in the early editions), and the move from MatNavi to MDR is described | Text of Furuya et al. (2019) Reference 3 https://doi.org/10.1080/14686996.2019.1680574 | Sourced |
| Matbench has 13 tasks (312 to 132,752 records, 10 data sources) and 5-fold nested cross-validation; the steels task has 312 experimental records from Citrine; cross-validation by group is discussed | Text of Dunn et al. (2020) Reference 4 https://doi.org/10.1038/s41524-020-00406-3 | Sourced |
| The steels task is composition-only, 312 records, yield-strength regression; MAE of Dummy 229.7 MPa, TPOT-Mat 79.9, AutoML-Mat 82.3, MODNet 87.8, RF-SCM/Magpie 103.5, CrabNet 107.3, Darwin 123.3, gptchem 143.0 MPa | Matbench official page (checked 22 October 2026) Reference 5 https://matbench.materialsproject.org/Leaderboards%20Per-Task/matbench_v0.1_matbench_steels/ | Sourced |
| Nickel-base superalloy: neural-network design with up to 11 conditions; the proposed alloy meets predictions and exceeds commercial alloys in oxidation resistance and yield stress | Abstract of Conduit et al. (2017) Reference 6 https://doi.org/10.1016/j.matdes.2017.06.007 | Sourced |
| Molybdenum-base alloy: design with 5 conditions; experiment meets predictions and exceeds commercial molybdenum-base alloys in properties | Abstract of Conduit et al. (2018) Reference 7 https://doi.org/10.1016/j.scriptamat.2017.11.008 | Sourced |
| NiTi shape memory alloy: about 800,000 compositions, 36 compositions (9 loops), 14 with smaller ΔT than the original 22, smallest 1.84 K (Ti50.0Ni46.7Cu0.8Fe2.3Pd0.2) | Abstract of Xue et al. (2016) Reference 8 https://doi.org/10.1038/ncomms11241 | Sourced |
| Cast aluminium: measured properties of six alloys with different Ti used for learning, 0.08 wt.% Ti recommended, measured UTS 199.6 MPa, yield 101.6 MPa, elongation 12.3%, in good agreement with prediction | Text of Zhang et al. (2023) Reference 9 https://doi.org/10.3390/ma16010306 | Sourced |
| TWIP steel: 273 literature records, two new steels with yield 585/560 MPa, UTS 1,055/1,101 MPa, elongation 55/58.5%, strength-elongation product 58.0/66.4 GPa% | Abstract of Zhou et al. (2024) Reference 10 https://doi.org/10.3390/met14080952 | Sourced |
| Al-Co-Cr-Cu-Fe-Ni: in 7 experiments, an alloy 10% harder than the best in the training data; descriptors outperform composition alone | Abstract of Wen et al. (2019) Reference 11 https://doi.org/10.1016/j.actamat.2019.03.010 | Sourced |
| High-entropy Invar alloys: closed loop, 17 new alloys, two with a thermal expansion coefficient of about 2 × 10⁻⁶ K⁻¹ at 300 K | Abstract of Rao et al. (2022) Reference 12 https://doi.org/10.1126/science.abo4940 | Sourced |
| Superalloys: nine new alloys, three with γ′ solvus temperature about 50 °C higher, sampling aimed at extrapolation | Abstract of Liao et al. (2024) Reference 13 https://doi.org/10.1038/s41524-024-01358-8 | Sourced |
| Solid-solution formation predicted at 93% for 1,252 alloys, new rule 73%, predictions for three blocks (nine elements each) agree 94% with CALPHAD | Abstract of Pei et al. (2020) Reference 14 https://doi.org/10.1038/s41524-020-0308-7 | Sourced |
| ML-HEA was compared with reliable experimental data for binary to quinary systems and also with CALPHAD and other methods | Abstract of Kaufmann and Vecchio (2020) Reference 15 https://doi.org/10.1016/j.actamat.2020.07.065 | Sourced |
| Composites: learning from hundreds of thousands of finite-element structures, confirmed by additive manufacturing and testing; a review gives an outlook on machine learning | Abstracts of Gu et al. (2018) and Chen and Gu (2019) Reference 16 https://doi.org/10.1039/c8mh00653a Reference 17 https://doi.org/10.1557/mrc.2019.32 | Sourced |
| Conventional machine-learning metrics overestimate performance for materials discovery; LOCO CV and the nearest-neighbour benchmark were introduced | Abstract of Meredig et al. (2018) Reference 18 https://doi.org/10.1039/C8ME00012C | Sourced |
| The FAIR principles are a concise and measurable set of principles for improving the reusability of data | Abstract of Wilkinson et al. (2016) Reference 19 https://doi.org/10.1038/sdata.2016.18 | Sourced |
| Numbers, titles and status of ISO 6892-1:2019 (November 2019, confirmed in 2025), ISO 1143:2021 (July 2021, under systematic review) and ISO 1099:2026 (published October 2026, 2017 edition withdrawn) | ISO pages (checked 22 October 2026) Reference 20 https://www.iso.org/standard/78322.html Reference 21 https://www.iso.org/standard/79575.html Reference 22 https://www.iso.org/standard/85731.html | Sourced |
| Numbers and titles of JIS Z 2241 and JIS Z 2274 | JIS search of JISC Reference 23 https://www.jisc.go.jp/app/jis/general/GnrJISSearch.html | Sourced |
| Numbers, titles and publication dates of ISO/IEC 22989:2022 (July 2022) and ISO/IEC 5259-1:2024 (July 2024) | ISO pages Reference 24 https://www.iso.org/standard/74296.html Reference 25 https://www.iso.org/standard/81088.html | Sourced |
| About 4.6 million (4,598,126) compositions for five elements and about 26 billion (26,075,972,546) for eight elements; the R² = 0.96 and MAE = about 13.3 MPa example; synthetic-data R² (nearest neighbours 0.978 / -0.214, linear 0.633 / -0.289; medians over 20 seeds 0.976 / -0.306 and others) | Our calculation (Python and NumPy; synthetic data, random seeds 0 to 19). Not data on real alloys | Our calculation |
| That no independent replication, practical use or mass production could be confirmed for the cases in chapter 6; some numbers for the nickel-base superalloy, molybdenum-base alloy and TWIP steel, demonstrations in CFRP and similar composites, and a standard specific to MI for alloys, could not be confirmed and are not stated | Not found in the primary sources we could reach in this survey | Commentary |
| The five levels of "verified", the items of the ledger, what AI can take over versus what needs an expert, and readings such as "LOOCV does not test new steel grades" and "only Ti was varied" | Our own organization and commentary based on published content; not views stated by the institutions concerned | Commentary |
| That figures 2 to 9 are explanatory drawings or plots of published numbers, not observations of real data, and that figure 1 is a frame for an AI-generated image | Note by this article | Commentary |
Last updated: 22 October 2026 / Sources are limited to primary ones (peer-reviewed papers, arXiv preprints, official data-publication pages, and the official ISO and JISC pages). The full texts of ISO standards are paid and were not checked. The synthetic-data examples are calculations on data made up for this article, not the performance of real alloys. Independent replication, practical use and mass production, some numbers in the text of certain papers, demonstrations on real composite structures, and a standard specific to MI for alloys could not be confirmed and are therefore not stated. The figures are explanatory concept diagrams, drawings that include our own calculation, or plots of published numbers; Fig. 1 is a frame for an AI-generated image (image not yet placed).