TECHNOLOGY EXPLAINER
Applications to Battery Materials
— telling "predicted" from "confirmed by experiment" in the search for electrolytes and electrodes
A growing number of studies search for battery materials with data, calculation and AI: solid-electrolyte candidates narrowed from tens of millions, or electrolyte formulations found by robots. But even when a report says "found by AI", the basis may be a calculated prediction, a trend in past experimental data, or a result that was actually synthesized and measured. This article checks examples for electrolytes, electrodes and cells against primary sources and sorts them with a "ladder of confirmation" that shows how far each was verified. The chemistry of batteries themselves is left to our explainer on the chemistry and comparison of next-generation batteries; here we concentrate on how the search is done.
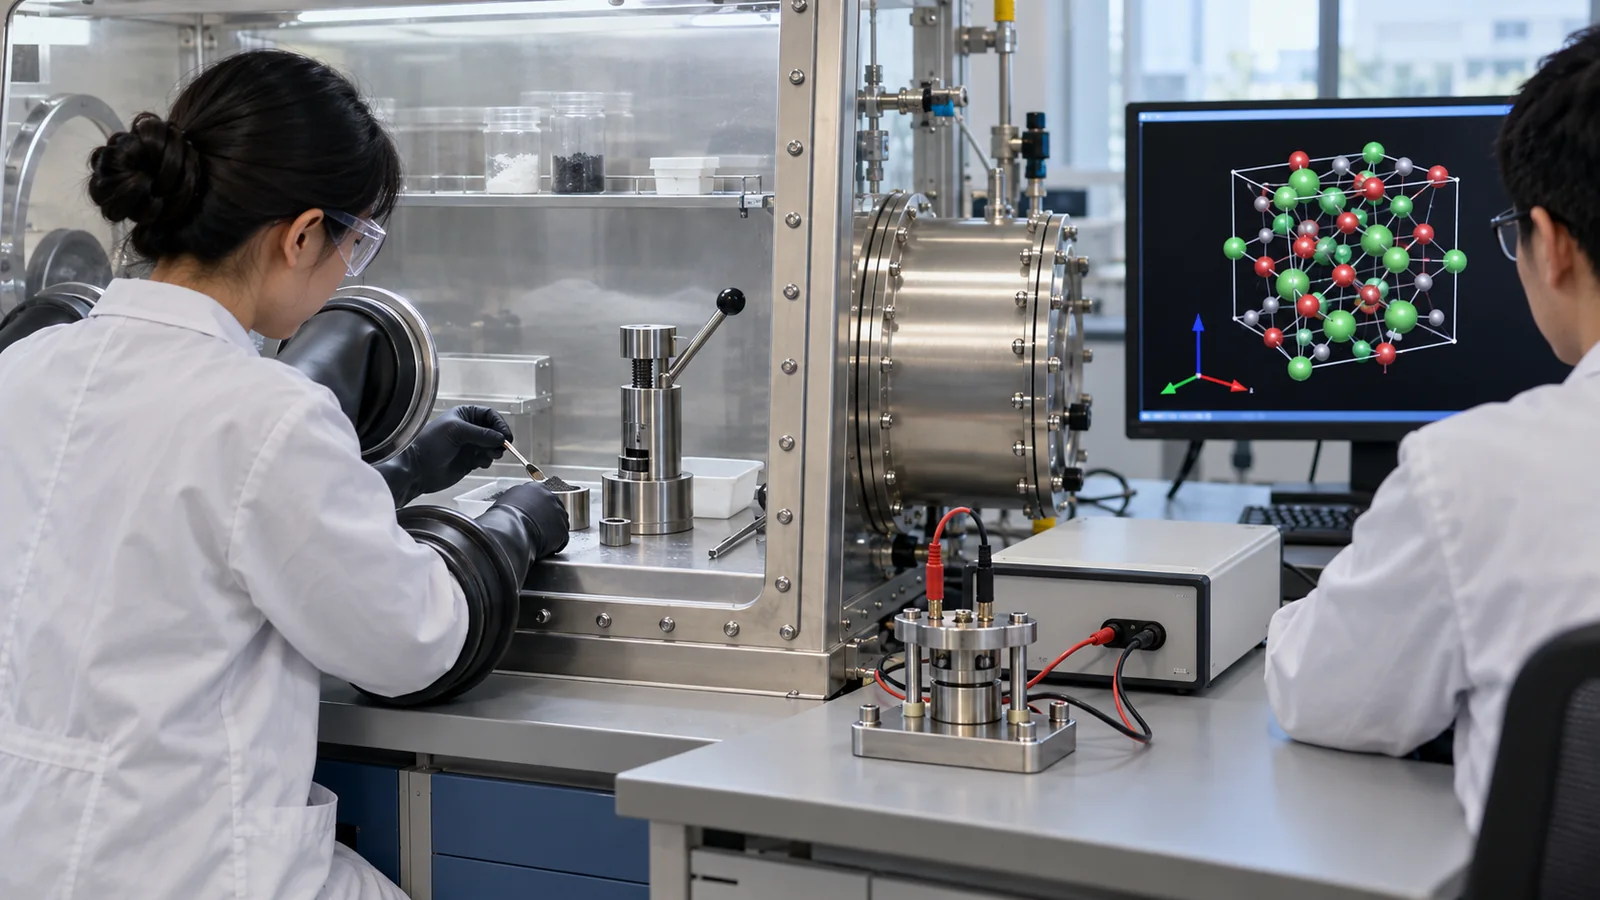
- The short version / before you read / where this sits in the series
- What we search for in battery materials — three ways of searching
- A vast map — feeling the number of candidates with our own calculation
- Solid-electrolyte search 1 — a funnel from thousands of entries (Sendek et al.)
- Solid-electrolyte search 2 — from tens of millions of candidates to synthesis (GNoME, Chen et al.)
- Electrode materials — predicting voltage and capacity
- Electrolytes and charging conditions — searching by running experiments automatically
- The data problem — collecting experimental conductivity data
- Telling prediction from experiment — the ladder of confirmation
- A materials engineer's view
- Limits, what could not be confirmed, and summary
- How to read the yardsticks and standards
- Glossary
- References
- Claim-to-source audit
Sourced = stated in published material (link given)
Our calculation = a figure this article derived, with the assumptions spelled out
Not yet confirmed = plans, work in progress or proposals, so not final
Readings for materials research are marked separately as Commentary. Inference is shown in bold. Claims by companies and research groups are treated as claims.
The calculations in Sections 3, 5 and 6 are examples we computed from reported values and atomic masses. They do not describe the performance of any real battery or material. Figures from papers are given with their conditions; they do not rank research groups or methods. For Chen et al. we checked the details in the preprint (arXiv) text and only the abstract of the published version (JACS), so numbers in the published version may differ. The checking date is 22 October 2026. We do not make company or investment judgments.
1. The short version / before you read / where this sits in the series
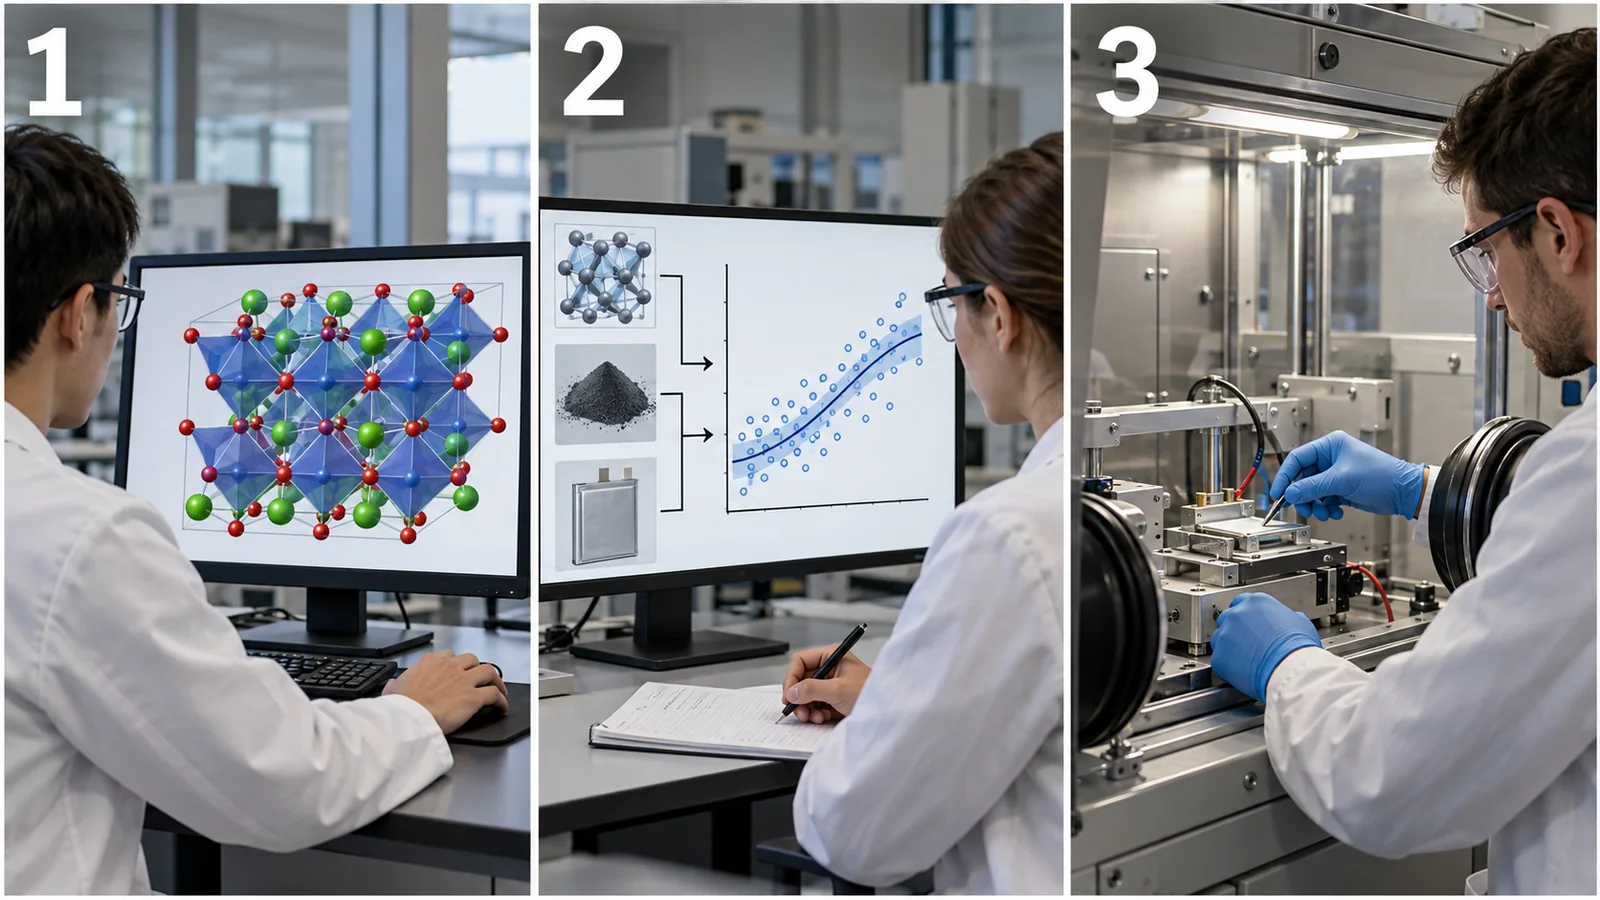
- There are three ways of searching for battery materials: (1) narrow down by calculation (DFT, or AI that imitates it), (2) learn from past experimental data, (3) run experiments automatically. The weight of the basis for an answer differs by type Sourced [Ref. 1, 4, 12].
- Read "predicted" and "confirmed by experiment" separately: a study that narrowed 12,831 known crystals to 21 solid-electrolyte candidates delivered a "prediction". Another, which narrowed 32.6 million candidates, synthesized four compositions, confirmed the predicted structure for one of them and measured its conductivity Sourced [Ref. 1, 4].
- What finally confirms is synthesis, measurement and cell testing: calculated and measured conductivities differ in conditions, and in one case differ by thousands of times. We could not confirm the cause of the gap from the paper Our calculation.
It is enough to know the roles of the positive electrode, negative electrode and electrolyte. No MI background is needed. Keep three ideas in mind first.
- Materials search = "looking for treasure on a vast map": the candidates are enormous and cannot all be tried. MI is a tool for narrowing where to look.
- Machine learning = "an approximator that learns trends from past data": it is weak outside the range it learned (extrapolation). It does not understand the laws of physics.
- The division of labor among calculation, experiment and AI: calculation "produces candidates cheaply and quickly", experiment "checks whether it is really so", and AI "narrows where to look". DFT (density functional theory) is a physics simulation that computes the properties of a material from the behavior of its electrons; it contains approximations and does not necessarily agree with measurements.
This article is one of the application explainers in our series on materials informatics (MI). The kinds of batteries, their chemistry and the "material, cell, system" three-layer way of reading numbers are in the explainer on the chemistry and comparison of next-generation batteries. The calculations behind this article are in the explainers on quantum chemistry and materials simulation, the fundamentals of density functional theory and machine-learning interatomic potentials; Bayesian optimization is in the explainer on Bayesian optimization and active learning, and robotic experiments are in the explainer on autonomous laboratories. This article can be read on its own; the necessary background is explained in the text.
2. What we search for in battery materials — three ways of searching
Searches for battery materials fall into three types according to "what we want to decide". The table is this article's own arrangement.
| What is searched | Properties we want to know | The "answer" MI produces | The experiment that checks it |
|---|---|---|---|
| Solid electrolytes | Ionic conductivity, electrochemical stability window (ESW), low electronic conductivity, chemical stability, ease of synthesis | Predictions of stability and conductivity by DFT or AI; classification of "fast-conductor likeness" from past experimental data | Synthesis, powder XRD, conductivity measured by AC impedance, interface tests against electrodes |
| Electrode materials | Voltage, capacity, structural stability, volume change | Voltage and capacity calculated by DFT; AI that imitates them | Synthesis, charge-discharge tests in half cells and full cells |
| Electrolytes (liquid) | Conductivity, stability, fast-charging performance | Next formulations proposed by Bayesian optimization | Mixing and measurement by robots, tests in cells |
| Cell lifetime and charging conditions | Cycle life, degradation | Lifetime predicted from data of the first few cycles | Long-term cycling tests |
The table is this article's own arrangement (commentary).
View original SVG, values and sources
Original SVG reference: Concept diagram (vector drawing). Three ways of searching for battery materials with MI. The basis of the answer differs: "calculation", "past experimental data" or "the experiment itself". This leads into the "ladder of confirmation" in Section 9. The grouping is this article's own; the examples are the studies listed in the references.
A solid electrolyte is not usable just because lithium ions move fast in it. It must not conduct electrons (low electronic conductivity), must not decompose within the voltage range of the electrodes (wide electrochemical stability window), must not react with the electrodes (chemically stable), and must be makeable and cheap. Sendek et al. list structural and chemical stability, low electronic conductivity and low cost as conditions Sourced [Ref. 1]. Few materials meet all of these at once, so the search is not "maximize one property" but narrowing by several conditions (our commentary).
3. A vast map — feeling the number of candidates with our own calculation
Why do we need AI and calculation to narrow things down? Look at the number of candidates. Chen et al. started from 54 elements for battery materials [Ref. 4]. Just choosing sets of 3, 4 or 5 elements from them gives the following numbers of element choices (Our calculation).
- 3 elements: C(54, 3) = 24,804 ways
- 4 elements: C(54, 4) = 316,251 ways
- 5 elements: C(54, 5) = 3,162,510 ways
That counts only sets of elements. Even for the same set, differences in ratio (composition) and crystal structure multiply the candidates by orders of magnitude. In fact, Chen et al. made 32,598,079 initial candidates by replacing atoms in known crystal structures (the 2022 version of ICSD) with other elements of the same valence Sourced [Ref. 4]. Cubuk et al. reported a way, using physical insight, of screening billions of compositions for conductivity Sourced [Ref. 3].
The bottom row of the figure is the number of compositions Chen et al. actually tried to synthesize: 4. Looking at 32.6 million by calculation and four in the lab. This drop is why it matters to read "prediction" and "experiment" separately (our commentary). By analogy, it is like picking a few books from a whole library's collection and checking what is inside. The analogy has a limit: unlike a book, what a material "contains" can change with how it is synthesized.
4. Solid-electrolyte search 1 — a funnel from thousands of entries (Sendek et al.)
(1) What they did
In 2017, Sendek et al. reported a method that applies conditions one after another to narrow down 12,831 lithium-containing crystals in the Materials Project (a database of calculated materials [Ref. 11]). The flow is shown in Fig. 4 Sourced [Ref. 1].
- First narrowing: with conditions such as thermodynamic stability (energy above the convex hull, Ehull = 0 eV/atom), no transition metals, a band gap of 1 eV or more and an oxidation-side voltage of 4 V or more, 12,831 entries became 317 (a 92.2% reduction). The strictest condition was stability: only 11.5% (1,472) passed [Ref. 1].
- Conductivity classification: from literature values of measured lithium-ion conductivity (40 materials, of which 11 are superionic), logistic regression learned "superionic likeness". Superionic is defined there as 10⁻⁴ S/cm or more at room temperature. This classification took 317 entries to 21 [Ref. 1].
- Where the result stands: the 21 are "promising structures", and the authors say that few of them have been examined experimentally [Ref. 1]. So the outcome of this study is a prediction.
A follow-up from the same group reports a search in which machine learning chooses candidates and DFT molecular dynamics (DFT-MD, which follows the motion of atoms by calculation) computes conductivity. Compared with random search, it was 2.7 times more likely to find fast lithium-ion conductors, with at least a 45-fold improvement in the log-average room-temperature conductivity, and the classification model had an F1 score of 0.50, 3.5 times that of random guessing Sourced [Ref. 2 (preprint)]. The "conductivity" here is a value calculated by DFT-MD (single crystal), not a measured value. The candidates were also chosen from about 12,000 known materials that had been "synthesized and characterized experimentally" [Ref. 2].
For a given set of elements, there is a lower line (the convex hull) that joins the "most stable combinations". Ehull is how far above that line a material sits (how much higher its energy is); at 0, the material is the most stable by calculation. The larger the value, the more easily it is thought to decompose into other phases. But many materials with a slightly higher Ehull can in fact be made and used (metastable phases). The condition of Sendek et al. (Ehull = 0) removes metastable materials from the start. The paper also gives a supplementary list under relaxed conditions (Ehull of 0.1 eV/atom or less and others; 56 entries) [Ref. 1].
Only 40 materials with known experimental conductivity were used for training. It still worked as a classifier because an effective combination was chosen from "descriptors" (numbers that express the arrangement of atoms) and a simple model (logistic regression) was used. The paper reports that no single descriptor had predictive power, while a combination of several gave a useful degree of it [Ref. 1]. Handling small data is covered in our explainer on small-data machine learning.
Practical cautions: (1) of the 40, 11 are superionic, so a "good material" is itself rare. (2) The training data are literature values, with varied temperatures, sample preparation and measurement methods (Section 8). (3) The classifier's answer is a "probability", and the 21 judged superionic are a relative ranking among the 317. The final confirmation is to synthesize and measure.
5. Solid-electrolyte search 2 — from tens of millions of candidates to synthesis (GNoME, Chen et al.)
(1) GNoME: the number of "candidates" found by calculation
A Google DeepMind group trained graph neural networks at scale to predict the stability of crystals, and reported more than 2 million structures "below the current convex hull" (more stable by calculation than known materials). As one example of downstream use, they screened solid-electrolyte candidates Sourced [Ref. 5]. Specifically, with a holistic screen that excludes transition metals and filters by lithium fraction, they found 528 "promising lithium-ion conductors", 25 times the number in the earlier study (Sendek et al. [Ref. 1]). According to the methods section, this number comes from filters based on the band gap and on stability against a lithium-metal anode [Ref. 5]. So 528 is the result of a computational screen, not a count of measured conductivities.
The abstract also says that 736 of the stable structures had already been independently realized in experiments [Ref. 5]. That count refers to the stable structures as a whole, not to the 528 conductors. Meanwhile, Cheetham and Seshadri examined the claims of this work and commented that they found scant evidence for compounds that satisfy novelty, credibility and utility together, and that expertise in synthesis and crystallography needs to be built in Sourced [Ref. 6]. We set out the claims of the study and the commentary side by side and do not judge which is right (the evaluation of crystal-structure prediction is covered in our explainer on crystal structure prediction and stability).
(2) Chen et al.: from 32.6 million candidates to four compositions synthesized
A group at Microsoft (Azure Quantum) and the U.S. Pacific Northwest National Laboratory (PNNL) combined machine learning with large-scale cloud computing to search for solid electrolytes, and reported the work through to experimental confirmation Sourced [Ref. 4]. The flow was as follows.
- Generating candidates: choose 54 elements and, in known crystal structures, replace atoms with elements of the same valence, giving 32,598,079 initial candidates.
- Predicting stability: with machine-learning potentials (M3GNet, CHGNet and others) and first-principles calculations, about 500,000 were predicted to be potentially stable.
- Property filters: using the electrochemical stability window (ESW), band gap, conductivity from ab initio molecular dynamics (AIMD) and so on, they narrowed to 18 promising candidates (8,795 compounds entered the ESW filter).
- Synthesis and measurement: four rare-earth halides at the top (the Pna2₁ phase of Li₃YCl₆, Li₅YCl₈, Li₇Y₂Cl₁₃ and Na₂LiYCl₆) were synthesized and their structure and conductivity examined.
Here are the experimental results alongside the calculated values (the same content as the upper table of Fig. 5).
| Composition (predicted structure) | Calculated (AIMD, 300 K) | What happened in the experiment |
|---|---|---|
| Li₃YCl₆ (Pna2₁) | 12.17 mS/cm | Synthesis gave a different known phase (P-3m1) |
| Li₅YCl₈ (Cmmm) | 1.12 mS/cm | Synthesis attempted; Li₃YCl₆ (P-3m1) obtained |
| Li₇Y₂Cl₁₃ (Pn-3) | 1.70 mS/cm | Synthesis attempted; Li₃YCl₆ (P-3m1) obtained |
| Na₂LiYCl₆ (R-3) | 0.12 mS/cm | Powder XRD matched the predicted structure. 2.2×10⁻⁶ S/cm at 100 °C, activation energy 0.6 eV. The parent Na₃YCl₆: 6.0×10⁻⁸ S/cm at 100 °C, 0.82 eV |
Source: Table 1 and the text of Chen et al. (arXiv version). Sourced. The paper notes that the P-3m1 phase of Li₃YCl₆ is a known material in which Li and Y share sites.
Three things can be read from this table.
- The predicted phase is not always formed: in three of the four, the target structure was not obtained and the known Li₃YCl₆ (P-3m1) formed instead. In one (Na₂LiYCl₆) the predicted structure was confirmed. The authors say confirmation by single-crystal XRD is in progress Sourced [Ref. 4].
- Calculated and measured values cannot be compared directly: the calculated value for Na₂LiYCl₆ (300 K) is 0.12 mS/cm (1.2×10⁻⁴ S/cm), and the measurement is 2.2×10⁻⁶ S/cm at 100 °C. Converting the measurement to 300 K (assuming the activation energy of 0.6 eV is constant) gives about 2×10⁻⁸ S/cm, so the calculated value is about 5,000 to 6,000 times larger Our calculation. However, the calculation is for the Li conductivity of an ideal ordered structure, while the measurement is on a pressed powder in which Na and Li are mixed and grain boundaries exist. We could not confirm the cause of the gap from the paper (Inference: several factors probably overlap).
- Experiments are laborious: the paper states that the crystallinity of the samples was strongly affected by humidity during handling and measurement, that the background from Kapton tape and broadened peaks made it hard to refine lattice parameters, and that small amounts of NaCl and LiCl remained in some compositions [Ref. 4].
The misunderstanding: they searched 32.6 million candidates and discovered a new electrolyte.
What is correct: they narrowed 32.6 million candidates by calculation and synthesized four compositions; for one of them (the Na₂LiYCl₆ family) the predicted structure and a measured conductivity were confirmed. Whether that conductivity is at a level usable for a solid electrolyte needs discussion, and the paper's wording stops at "showing potential to serve as solid electrolytes" [Ref. 4]. Confirming performance in a battery is described by the authors as "currently being assessed" Not yet confirmed.
The division of labor among calculation, experiment and AI: AI and calculation "narrowed it down to four", and experiment "checked whether it is really so".
The paper by Chen et al. states that most known electrolytes, such as the sulfide Li₁₀GePS₁₂ and the oxide Li₇La₃Zr₂O₁₂, would not have passed the filters used (for example the strict ESW condition). It also states that the calculations used only ordered structures with well-defined atom positions, although many fast lithium conductors have disordered positions or defects, which were not handled Sourced [Ref. 4].
In practice, the conditions of a search are the "priorities" the searcher has set. A strict condition cuts the effort of searching but misses good materials outside the condition (our commentary). When using such a search in your own work, first check "why each condition was made strict" and "whether known good materials pass the condition". A condition that known materials fail is a cue to revisit it.
6. Electrode materials — predicting voltage and capacity
(1) Capacity follows from the molar mass (our calculation)
The "capacity" of an electrode material is how much (charge of) lithium can be moved in and out per gram of material. When one Li carries one electron, the theoretical capacity is 26,801 mAh/mol divided by the molar mass (g/mol); that is the Faraday constant, 96,485 C/mol, divided by 3.6 to convert to mAh. Our calculation
- LiFePO₄ (molar mass 157.76): 26,801 / 157.76 ≈ 170 mAh/g
- LiCoO₂ (molar mass 97.87): ≈ 274 mAh/g if all the Li comes out; ≈ 137 mAh/g if only half is used (the "half" is an assumption for illustration)
- Graphite (LiC₆, per C₆): ≈ 372 mAh/g
This calculation helps with searching. It shows that, for capacity, materials built from light elements that can move as much Li as possible are advantageous. However, the amount of Li actually usable (not all can be removed), the voltage and the volume change need separate evaluation (our commentary).
(2) Voltage is computed from an energy difference
The idea of computing voltage is to take the energy (calculated by DFT) of the "lithium-inserted" and "lithium-removed" states, find the energy needed to remove lithium from the difference, and convert that to a voltage (our explanation). The 1997 paper by Aydinol et al., as its title says, calculated the intercalation voltage of lithium-transition-metal oxide electrodes from first principles [Ref. 15] (we checked it only at the title level). Hautier et al. evaluated phosphate cathode materials by high-throughput first-principles calculations and organized the voltage ranges by redox couple and the limits on capacity Sourced [Ref. 8].
(3) What machine learning predicts is a "calculated value"
Joshi et al. used voltage data from the Materials Project to predict electrode voltages with a deep neural network, a support vector machine and kernel ridge regression, and proposed nearly 5,000 candidates for Na- and K-ion batteries Sourced [Ref. 9]. Li et al. compiled calculated cathode voltages for 5,577 and 2,423 structure pairs (Li-ion and Li-free cathodes) and reported that a machine-learning model predicting voltage from chemical formulas showed state-of-the-art performance against two established models (Roost and CrabNet) Sourced [Ref. 10].
What matters is that the correct answers (labels) of these models are voltages calculated by DFT, not measured voltages. However accurate the AI, that accuracy is "how fast it can imitate DFT" (our commentary). How far DFT voltages differ from measured ones is a separate question, and we could not confirm it from the abstracts of these papers within the range we checked.
The right side of Fig. 6 is an example of how a voltage error acts on an energy estimate. For a material with a 3.5 V mean voltage, if the calculated voltage is off by 0.3 V, the specific-energy estimate is off by about 8.6% (Our calculation; the 0.3 V error is an assumption for illustration). Voltage multiplies directly into energy density, so the size of the calculation error bears on judging practicality.
The theoretical capacity and calculated voltage of an electrode material are numbers at the "material" level. In a cell, the weight of the current collector, separator, electrolyte and packaging is added, and the energy density falls well below the material figure. This "material, cell, system" three-layer way of reading is covered in detail in our explainer on the chemistry and comparison of next-generation batteries. The numbers in this article are at the material level.
7. Electrolytes and charging conditions — searching by running experiments automatically
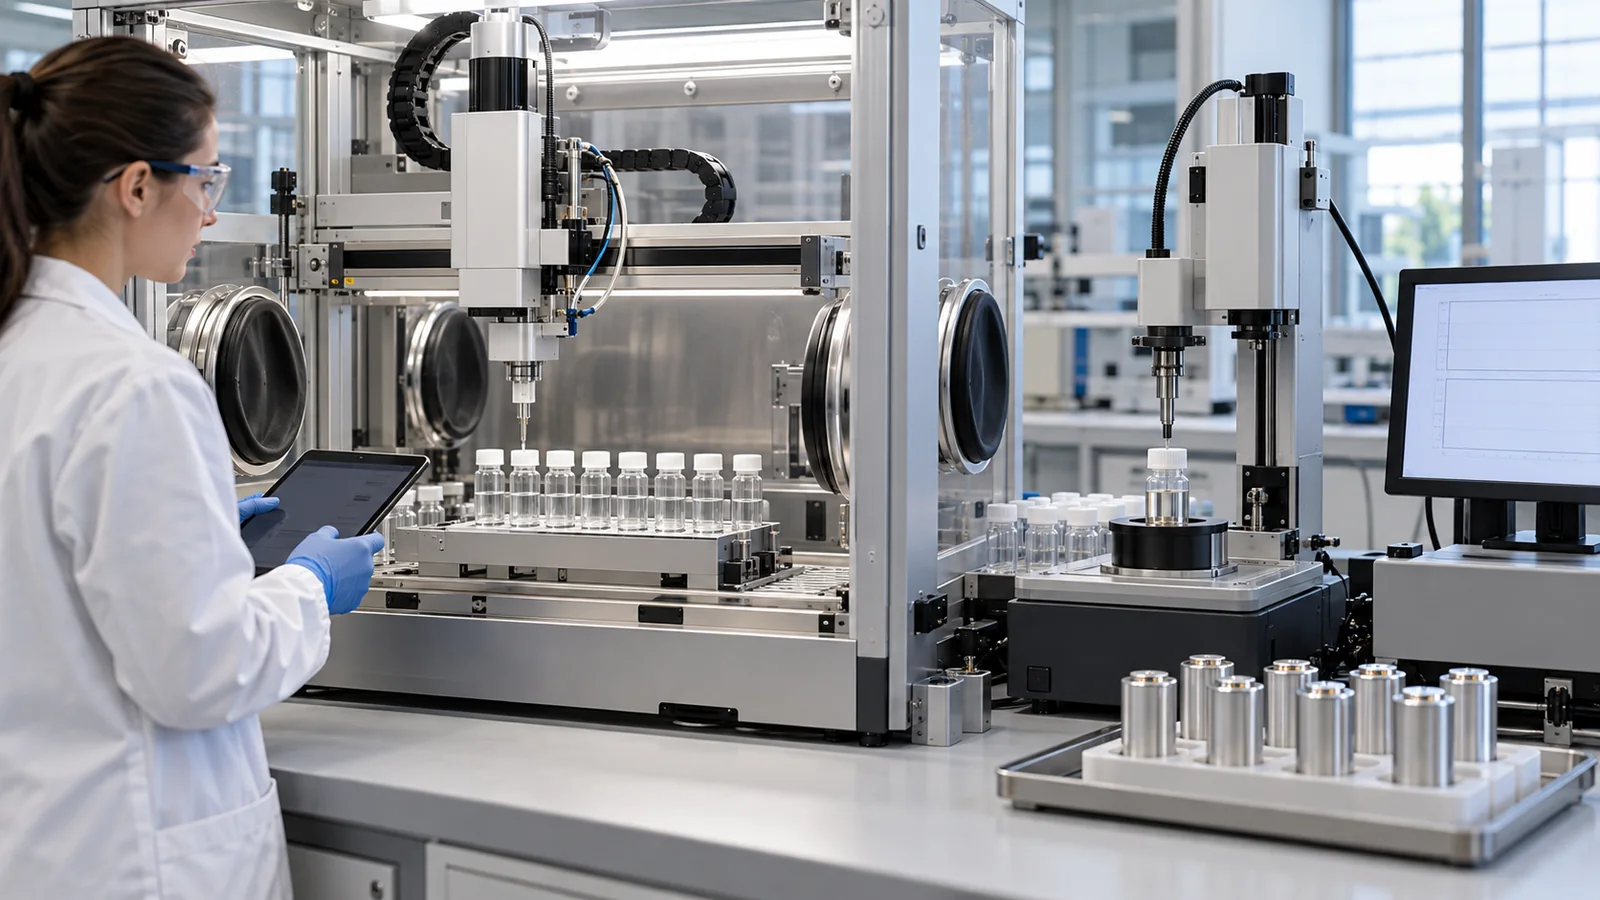
So far we have looked at searching for materials by calculation. The other way is to run the experiment itself automatically and let AI choose the next condition. In batteries, the following have been reported (Fig. 7).
(1) Electrolyte formulation: Dave et al. (2022)
Dave et al. combined a robot (Clio) with an experiment planner based on Bayesian optimization (Dragonfly) and optimized electrolyte conductivity over one salt and a mixture of three solvents. In two working days and 42 experiments they identified six electrolytes suited to fast charging, and report that this was six times faster than random search by the same automated experiment. As a check in real batteries, in 220 mAh pouch cells (graphite and LiNi₀.₅Mn₀.₃Co₀.₂O₂), cells with the robot-developed electrolytes showed better fast-charging performance than a baseline electrolyte chosen in advance Sourced [Ref. 12].
The feature of this study is that it searched with measured values (conductivity) and then confirmed in cells. On the other hand, what was optimized was one metric, conductivity; lifetime, safety and cost are outside the study's evaluation (our commentary).
(2) Charging conditions: Attia et al. (2020) and Severson et al. (2019)
Attia et al. combined an early-prediction model (predicting lifetime from the first few cycles) with Bayesian optimization and identified a long-cycle-life protocol among 224 candidates of 6-step, 10-minute fast-charging protocols in 16 days. They state that an exhaustive search without early prediction would take more than 500 days (about 31 times, by Our calculation) Sourced [Ref. 13]. The study of Severson et al., on which that early prediction was based, tested 124 commercial lithium iron phosphate/graphite cells under fast-charging conditions to produce data with widely varying lifetimes of 150 to 2,300 cycles, and predicted lifetime from the first 100 cycles with a test error of 9.1% (classifying lifetime into two groups from the first 5 cycles had an error of 4.9%) Sourced [Ref. 14].
The misunderstanding: the lifetime prediction is accurate (9.1%), so it can be used for materials search.
What is correct: the subject of Severson et al. is the lifetime by charging condition of one type of commercial cell (lithium iron phosphate/graphite), not a prediction for new materials. Whether the model carries over to other batteries or materials is not shown in that work [Ref. 14]. "Changing conditions of the same battery" and "a different material" differ in how hard they are to predict (our commentary).
8. The data problem — collecting experimental conductivity data
MI starts from data. There is an example of organizing experimental conductivity data in the solid-electrolyte field. Hargreaves et al. released an expert-curated dataset of lithium solid-electrolyte conductivities. It holds 820 records measured by AC impedance spectroscopy, collected from 214 sources, each with a composition, an expert-assigned structural label and the conductivity at a particular temperature (5 to 873 °C). There are 403 unique compositions with a conductivity near room temperature (15 to 35 °C). With this data they trained a CrabNet-based classifier of high versus low ionic conductivity, as "a practical tool to aid experimentalists in prioritizing candidates" Sourced [Ref. 7].
Sendek et al. trained on 40 materials [Ref. 1]. Compared with that, the number of compositions is about ten times larger (403). But more data do not always mean higher accuracy. Even for the same composition, conductivity can change a great deal with the synthesis method, density, grain boundaries, and the temperature and method of measurement (our commentary). The data in papers are collections of values that contain such differences. The quality of the data and the record of measurement conditions set the ceiling of prediction.
The conductivity of a solid electrolyte is usually measured on a pressed powder (a pellet). The boundaries between powder grains (grain boundaries) are hard for ions to cross, and if pressing leaves many gaps the overall conductivity falls. Even for the same crystal, if the firing temperature or cooling changes how disordered the atomic arrangement is, the conductivity can change. So a value in a paper mixes "the property of the material itself" with "the effect of how that sample was made and measured" (our commentary).
9. Telling prediction from experiment — the ladder of confirmation
Here we line up the reports so far by "how far they were confirmed". For battery materials, it helps to divide the stages of confirmation into five rungs (this article's own arrangement).
- Calculated prediction: prediction of stability, voltage or conductivity by calculation or AI
- Synthesized, structure confirmed: actually make it, and confirm by powder XRD and so on that it is the target phase
- Material property measured: measure conductivity and so on
- Performance confirmed in a cell: make a battery and measure charge-discharge, lifetime and fast charging
- Independent check, long-term, mass production: replication by other groups, long-term reliability, reproduction at scale
As Fig. 9 shows, the rung reached differs by report. The 528 of GNoME and the 21 of Sendek et al. are at rung 1 (prediction). Chen et al. went through rungs 1 to 3 (Na₂LiYCl₆), and confirmation in a cell is described as in progress Not yet confirmed. Dave et al. searched electrolyte formulations by experiment and reached rungs 3 and 4 (conductivity measurement and pouch cells). Among the reports covered in this article there was none for which rung 5 (independent verification, mass production) could be confirmed.
When you see an article or announcement about a new battery material, first check "which rung of the ladder this result is".
- A rung 1 (prediction) story: "candidates were found". Whether it can be made, and whether measurement gives the same value, comes later.
- A rung 2 or 3 story: "made and measured". But how the sample was made and measured affects the result. Reproducibility (another lot, another operator) is the next question.
- A rung 4 story: "it worked in a cell". Check whether the baseline battery compared against is fair and whether the test conditions (temperature, current, cell build) are close to real use.
- A rung 5 story: only when independent verification, long-term tests and reproduction in mass production are confirmed does it come close to "usable as a material".
10. A materials engineer's view
- Record synthesis and preparation conditions: raw materials, atmosphere (the dew point of the glove box), firing temperature, time and cooling, grinding, pressing pressure, pellet density. The paper by Chen et al. also states that humidity strongly affected crystallinity [Ref. 4]. A conductivity without conditions becomes hard to use later.
- Keep the measurement conditions with the data: for conductivity, the temperature, the electrodes (type of blocking electrode), pressure, frequency range and method of analysis. This is also why the dataset of Hargreaves et al. records conductivity with temperature (5 to 873 °C) [Ref. 7].
- Keep the "could not be made" data: in three of four cases, Chen et al. got a known phase instead of the target structure [Ref. 4]. That record of "differed from the aim" is valuable data for improving the next prediction. It rarely appears in papers, so it is worth keeping in-house.
- Fix the yardstick for comparison: when evaluating a new material, measure a baseline material under the same conditions every time (a known electrolyte, a baseline electrolyte). Dave et al. also show their improvement against a baseline electrolyte [Ref. 12].
- Check by lot and by operator: being good in one lot is a different question from reproducing in another lot. In evaluating AI predictions too, validating split by lot gives figures closer to real operation.
What can be left to AI, and where expert judgment is needed
| Situation | Easier to leave to AI | Needs expert judgment |
|---|---|---|
| Pre-selecting candidates | Narrowing thousands to millions of candidates to a few dozen by stability, stability window and conductivity guides | Which conditions to make strict, and how far. Checking whether known good materials pass |
| Synthesis | (Repetitive mixing by robots) | The synthesis route, atmosphere and firing conditions. Working out why a predicted phase did not form |
| Measuring properties | Measurements with a fixed procedure, recording of data | Reading apart the effects of how the sample was made (grain boundaries, density); judging whether a measurement is valid |
| Confirming in a cell | Optimizing charging conditions (Attia et al. [13]), early lifetime prediction (Severson et al. [14]) | Designing tests close to real use, safety, cost, and the outlook for mass production |
The table is this article's own arrangement (commentary).
11. Limits, what could not be confirmed, and summary
(1) Papers whose published text we could not check
We checked Chen et al. in the text of the preprint (arXiv) and only the abstract of the published version (JACS). The 2019 follow-up by Sendek et al. was checked from the abstract of the preprint (the final wording of the published version is unchecked). The 2017 paper of Sendek et al. was checked in the authors' public PDF. Hautier et al., Severson et al. and Aydinol et al. are cited from the abstract or the title.
(2) The cause of the gap between calculated and measured values
For Na₂LiYCl₆ of Chen et al., we showed by our conversion that calculated (AIMD) and measured conductivities differ by about 5,000 to 6,000 times. We could not confirm the cause of the gap (the difference between an ideal structure and a real sample, grain boundaries, mixed Na and Li, the assumption in the temperature extrapolation and so on) from the paper.
(3) From laboratory to mass production
Among the reports covered, there were none for which independent verification, long-term reliability or mass production could be confirmed. We do not cover applications of MI in companies' battery development, patents or commercialization.
(4) Materials and methods not covered
We do not cover negative-electrode materials, binders, electrolyte additives, interfaces (SEI), individual discussions of sulfide, oxide and polymer solid electrolytes, materials for sodium and multivalent-ion batteries, or extraction of battery data from the literature by large language models. All-solid-state batteries are covered in another field of this series.
(5) Developments in Japan
We did not survey efforts on MI for battery materials in Japan (national research projects, data infrastructure at research institutes).
- There are three ways of searching for battery materials. Narrowing by calculation, learning from past experimental data, and running experiments automatically. The weight of the basis differs by type Sourced
- The candidates are enormous and only a handful can be confirmed by experiment. Choosing 5 of 54 elements alone gives about 3.16 million ways; the initial candidates of Chen et al. were about 32.6 million, and four were tried in synthesis Our calculation / Sourced
- "Predicted" and "confirmed by experiment" are different. The 21 of Sendek et al. and the 528 of GNoME are computational narrowing (predictions). Chen et al. synthesized four and confirmed structure and conductivity for one; calculated and measured conductivities differ by about 5,000 to 6,000 times by our conversion Sourced / Our calculation
- In many cases, what machine learning predicts for electrodes is the DFT calculated value. A 0.3 V voltage error corresponds to about 9% error in specific energy (an assumed example) Our calculation
- Reports that run experiments automatically have gone on to cell confirmation. The electrolyte work found six in two working days and 42 experiments and improved on a baseline in pouch cells; the charging-condition work found its answer among 224 candidates in 16 days. The metrics optimized are limited Sourced
- Read news of a new material by "which rung of the ladder". There was no report within this article's scope for which independent verification or mass production could be confirmed.
12. How to read the yardsticks and standards
How good MI for battery materials is depends on what is taken as the correct answer (a DFT value or a measurement), how the evaluation data are split, what it is compared against (random search, exhaustive search, a baseline electrolyte) and how far it was confirmed (the ladder of Section 9). There are international standards for measuring the performance of batteries (cells) themselves, but we could not find an international standard specific to MI for battery materials (prediction models or searches). Here is what we could confirm (checked 22 October 2026).
| Item evaluated | Representative benchmarks and evaluation methods (name and source) | Standards and guidelines (ISO/IEC, NIST and others) | Cautions when reading |
|---|---|---|---|
| Predicting crystal stability | Matbench Discovery (Riebesell et al., Nature Machine Intelligence, 2025): a framework for evaluating machine-learning energy models as pre-filters in a search for stable crystals; it points to a misalignment between regression metrics and task-relevant classification metrics [17]. Matbench (Dunn et al., 2020) [16] Sourced | Could not be confirmed | Even when regression error is small, false positives can be frequent near the boundary of 0 eV/atom above the convex hull [17]. Take special care in searches that use Ehull = 0 as a condition (Section 4) |
| Predicting solid-electrolyte conductivity | Experimental dataset: Hargreaves et al. (820 records, 214 sources, 403 compositions) [7]. An example metric: F1 score (Sendek et al. report 0.50, 3.5 times random guessing [2]) Sourced | Could not be confirmed (we could not find a standard on how to measure conductivity) | Literature values mix sample preparation and measurement conditions. An evaluation against DFT-MD calculated values is different from one against measurements |
| Predicting electrode voltage and capacity | Evaluations that take Materials Project calculated voltages as the answer (Joshi et al. [9], Li et al. [10]) Sourced | Could not be confirmed | Because the answer is a DFT calculated value, the gap to measurements is a separate matter |
| Predicting cell lifetime | The data of Severson et al. (124 cells, lifetimes of 150 to 2,300 cycles) and a test error of 9.1% [14] Sourced | IEC 62660-1:2018 "Secondary lithium-ion cells for the propulsion of electric road vehicles — Part 1: Performance testing" (2nd edition, published December 2018; test procedures for capacity, power density, energy density, storage life and cycle life of cells for electric vehicles; checked on the IEC page) [18]. IEC 61960-3:2017 (performance tests for prismatic and cylindrical lithium secondary cells for portable applications; published February 2017) [19] Sourced | The standards are test procedures for cells, not evaluation criteria for AI predictions. The standards' texts (test conditions) are paid and were not checked |
| Efficiency of optimizing by experiment | Comparison with random search (Dave et al.: 6 times [12]) and with exhaustive search (Attia et al.: 16 days versus more than 500 days [13]) Sourced | Could not be confirmed | The multiple depends on what is compared against (random search, exhaustive search). Check whether it is a comparison within the same automated experiment or against a different method |
| Sharing and reuse of data | FAIR principles (Wilkinson et al., 2016) [21]. The EU's BIG-MAP (Battery Interface Genome – Materials Acceleration Platform) set a goal of making battery discovery 5 to 10 times faster in 5 to 10 years [22]; its website states that it closed on 29 February 2024, and also describes efforts on sharing and standardizing battery data [20] Sourced | (FAIR is a set of principles, not an ISO-type standard) | The principles are recommendations, not requirements. The BIG-MAP goal (5 to 10 times) is a plan, and we could not confirm its achievement Not yet confirmed |
| Replication and independent verification | Setting a study's claims beside commentary on them (GNoME and the commentary of Cheetham et al. [5, 6]) Sourced | Could not be confirmed | When a claim is contested, read both sides. Check whether rung 5 (independent verification) exists |
The arrangement of the table is Our calculation (arrangement). The numbers, titles, editions and publication dates of IEC standards were checked on the official IEC pages (webstore.iec.ch) (22 October 2026). The texts of standards are paid, so only their scope is noted.
Cautions when reading (for materials engineers)
- A benchmark ranking is not the ability on your material: Matbench Discovery and the like evaluate "stability prediction" on calculated data. Ease of actual synthesis and performance in a battery must be confirmed separately.
- Tell prediction from experimental confirmation: always check which rung of the ladder in Section 9 a result is at. "Found by AI" is often a rung 1 story.
- Pitfalls of leakage and splitting: if materials of the same family straddle training and evaluation, accuracy is overstated (see our explainers on reading benchmarks and evaluation and on reading MI results and reproducibility). When training data are as few as the 40 of Sendek et al., the method of evaluation matters all the more.
- How strong a principle or standard is: the FAIR principles are recommendations, and IEC standards bind only when cited in law or a contract (the latter is our commentary). A project that has closed (BIG-MAP) and evaluations in progress are treated as Not yet confirmed.
13. Glossary
- Solid electrolyte
- A solid material that carries ions in a battery in place of a liquid.
- Ionic conductivity
- How easily ions flow, in S/cm. Sendek et al. define 10⁻⁴ S/cm or more as superionic.
- Electrochemical stability window (ESW)
- The voltage range in which a material can be used without decomposing.
- DFT (density functional theory)
- A physics simulation that computes the properties of a material from the behavior of its electrons. It contains approximations.
- AIMD / DFT-MD
- A method that follows the motion of atoms in time while computing the forces on them with DFT. Used to calculate conductivity.
- Ehull (energy above the convex hull)
- How much higher in energy a material is than the most stable combination. At 0, it is the most stable by calculation.
- Metastable phase
- A phase that is not the most stable but can in fact be made and does not readily break down.
- Materials Project
- A database that publishes calculated properties of materials.
- Machine-learning potential
- AI that learns from DFT results and quickly gives the forces on atoms.
- Logistic regression
- A simple classification method that outputs the probability of "which group".
- F1 score
- A classification metric (0 to 1) that looks at both misses and false alarms.
- Descriptor
- A "business card" for a material: composition or structure turned into numbers.
- Bayesian optimization
- A method in which AI chooses the next condition to try, to find the best condition with few trials.
- AC impedance spectroscopy
- A method that applies an alternating voltage and measures how easily ions flow (the resistance).
- Grain boundary
- The boundary between powder grains. Ions often cross it with difficulty.
- Pouch cell
- A battery with electrodes and electrolyte inside a film-type casing.
- Theoretical capacity
- The theoretical upper limit of charge that can be moved in and out per gram of material (mAh/g).
- Cycle life
- A guide to how many charge-discharge cycles a battery can repeat.
- FAIR principles
- Principles for making data findable, accessible, interoperable and reusable.
- MI (materials informatics)
- Using data, calculation and machine learning to make materials research more efficient.
14. References
- Sendek A. D., Yang Q., Cubuk E. D., Duerloo K.-A. N., Cui Y., Reed E. J. "Holistic computational structure screening of more than 12 000 candidates for solid lithium-ion conductor materials", Energy Environ. Sci. 10, 306–320 (2017), DOI 10.1039/c6ee02697d (text checked in the authors' public PDF) — doi.org/10.1039/c6ee02697d
- Sendek A. D. et al. "Machine Learning-Assisted Discovery of Solid Li-Ion Conducting Materials", Chem. Mater. 31, 342–352 (2019), DOI 10.1021/acs.chemmater.8b03272 (the abstract of the preprint arXiv:1808.02470 was used for checking) — arxiv.org/abs/1808.02470
- Cubuk E. D., Sendek A. D., Reed E. J. "Screening billions of candidates for solid lithium-ion conductors: A transfer learning approach for small data", J. Chem. Phys. 150, 214701 (2019), DOI 10.1063/1.5093220 — doi.org/10.1063/1.5093220
- Chen C. et al. "Accelerating Computational Materials Discovery with Machine Learning and Cloud High-Performance Computing: from Large-Scale Screening to Experimental Validation", J. Am. Chem. Soc. 146, 20009–20018 (2024), DOI 10.1021/jacs.4c03849 (the text of the preprint arXiv:2401.04070 was used to check details) — arxiv.org/abs/2401.04070
- Merchant A. et al. "Scaling deep learning for materials discovery", Nature 624, 80–85 (2023), DOI 10.1038/s41586-023-06735-9 — nature.com/articles/s41586-023-06735-9
- Cheetham A. K., Seshadri R. "Artificial Intelligence Driving Materials Discovery? Perspective on the Article: Scaling Deep Learning for Materials Discovery", Chem. Mater. 36, 3490–3495 (2024), DOI 10.1021/acs.chemmater.4c00643 (open access) — doi.org/10.1021/acs.chemmater.4c00643
- Hargreaves et al. "A database of experimentally measured lithium solid electrolyte conductivities evaluated with machine learning", npj Comput. Mater. 9, 9 (2023), DOI 10.1038/s41524-022-00951-z (open access) — doi.org/10.1038/s41524-022-00951-z
- Hautier G. et al. "Phosphates as Lithium-Ion Battery Cathodes: An Evaluation Based on High-Throughput ab Initio Calculations", Chem. Mater. 23, 3495–3508 (2011), DOI 10.1021/cm200949v — doi.org/10.1021/cm200949v
- Joshi R. P. et al. "Machine Learning the Voltage of Electrode Materials in Metal-Ion Batteries", ACS Appl. Mater. Interfaces 11, 18494–18503 (2019), DOI 10.1021/acsami.9b04933 — doi.org/10.1021/acsami.9b04933
- Li H. H., Chen Q., Ceder G., Persson K. A. "Voltage Mining for (De)lithiation-Stabilized Cathodes and a Machine Learning Model for Li-Ion Cathode Voltage", ACS Appl. Mater. Interfaces 16, 69379–69387 (2024), DOI 10.1021/acsami.4c15742 — doi.org/10.1021/acsami.4c15742
- Jain A. et al. "Commentary: The Materials Project: A materials genome approach to accelerating materials innovation", APL Mater. 1, 011002 (2013), DOI 10.1063/1.4812323 — doi.org/10.1063/1.4812323
- Dave A. et al. "Autonomous optimization of non-aqueous Li-ion battery electrolytes via robotic experimentation and machine learning coupling", Nat. Commun. 13, 5454 (2022), DOI 10.1038/s41467-022-32938-1 (open access) — doi.org/10.1038/s41467-022-32938-1
- Attia P. M. et al. "Closed-loop optimization of fast-charging protocols for batteries with machine learning", Nature 578, 397–402 (2020), DOI 10.1038/s41586-020-1994-5 — doi.org/10.1038/s41586-020-1994-5
- Severson K. A. et al. "Data-driven prediction of battery cycle life before capacity degradation", Nat. Energy 4, 383–391 (2019), DOI 10.1038/s41560-019-0356-8 — doi.org/10.1038/s41560-019-0356-8
- Aydinol M. K. et al. "Ab initio calculation of the intercalation voltage of lithium-transition-metal oxide electrodes for rechargeable batteries", J. Power Sources 68, 664–668 (1997), DOI 10.1016/s0378-7753(96)02638-9 — doi.org/10.1016/s0378-7753(96)02638-9
- Dunn A. et al. "Benchmarking materials property prediction methods: the Matbench test set and Automatminer reference algorithm", npj Comput. Mater. 6, 138 (2020), DOI 10.1038/s41524-020-00406-3 (open access) — doi.org/10.1038/s41524-020-00406-3
- Riebesell J. et al. "A framework to evaluate machine learning crystal stability predictions", Nat. Mach. Intell. 7, 836–847 (2025), DOI 10.1038/s42256-025-01055-1 (open access) — nature.com/articles/s42256-025-01055-1
- IEC "IEC 62660-1:2018 Secondary lithium-ion cells for the propulsion of electric road vehicles — Part 1: Performance testing" (IEC Webstore page) — webstore.iec.ch/en/publication/28965
- IEC "IEC 61960-3:2017 Secondary cells and batteries containing alkaline or other non-acid electrolytes — Secondary lithium cells and batteries for portable applications — Part 3: Prismatic and cylindrical lithium secondary cells and batteries made from them" (IEC Webstore page) — webstore.iec.ch/en/publication/29603
- BIG-MAP "BIG-MAP (Battery Interface Genome – Materials Acceleration Platform)" (official site) — big-map.eu
- Wilkinson M. D. et al. "The FAIR Guiding Principles for scientific data management and stewardship", Sci. Data 3, 160018 (2016), DOI 10.1038/sdata.2016.18 — doi.org/10.1038/sdata.2016.18
- BIG-MAP "BIG-MAP" (project description page; used to check the name and the goal) — big-map.eu/big-map
15. Claim-to-source audit
| Claim in the text | Basis | Label |
|---|---|---|
| 12,831 lithium-containing crystals, 317 by conditions (92.2% fewer), 21 by the conductivity classification. 11.5% (1,472) satisfy Ehull = 0. The classifier was trained on 40 materials with measured literature values (11 superionic); threshold 10⁻⁴ S/cm or more. Most of the 21 have not been examined experimentally | Abstract and text of Sendek et al. (2017) (authors' public PDF) Reference 1 https://doi.org/10.1039/c6ee02697d | Sourced |
| Follow-up: machine learning selects and DFT-MD computes conductivity. 2.7 times random search, at least a 45-fold improvement in log-average conductivity, F1 score 0.50 (3.5 times random guessing). Chosen from about 12,000 known materials (abstract of the preprint) | Abstract of Sendek et al. (2019) (arXiv version) Reference 2 https://arxiv.org/abs/1808.02470 | Sourced |
| A method that transfers physical insight to screen billions of compositions for conductivity | Abstract of Cubuk et al. (2019) Reference 3 https://doi.org/10.1063/1.5093220 | Sourced |
| Chen et al.: 54 elements, 32,598,079 initial candidates, about 500,000 stable candidates, 18 promising candidates (8,795 entered the ESW filter), synthesis of four halides, the structure match and conductivity of Na₂LiYCl₆ (2.2×10⁻⁶ S/cm at 100 °C, 0.6 eV), Li₃YCl₆ and others being known phases, effects of humidity and background, most known electrolytes failing the filters, ordered structures only | Chen et al. (abstract from the published version, details from the text of the arXiv version) Reference 4 https://arxiv.org/abs/2401.04070 | Sourced |
| GNoME: more than 2 million structures below the convex hull, 736 independently realized in experiments, 528 promising Li-ion conductors (filters: band gap and stability against Li metal) | Abstract, text and methods of Merchant et al. (2023) Reference 5 https://www.nature.com/articles/s41586-023-06735-9 | Sourced |
| Examination of the claims of GNoME: scant evidence for compounds satisfying novelty, credibility and utility, and a need to build in expertise (the critics' claim) | Abstract of Cheetham and Seshadri (2024) Reference 6 https://doi.org/10.1021/acs.chemmater.4c00643 | Sourced |
| An experimental conductivity dataset for lithium solid electrolytes (820 records, 214 sources, 403 compositions, 5 to 873 °C) and a CrabNet classifier | Abstract of Hargreaves et al. (2023) Reference 7 https://doi.org/10.1038/s41524-022-00951-z | Sourced |
| High-throughput first-principles evaluation of phosphate cathodes (voltage ranges, limits on capacity) | Bibliographic data and an outline of the abstract of Hautier et al. (2011) Reference 8 https://doi.org/10.1021/cm200949v | Sourced |
| Machine learning of voltage: about 5,000 Na- and K-battery candidates proposed from Materials Project data; calculated voltages for 5,577 and 2,423 pairs and a comparison with Roost and CrabNet | Abstracts of Joshi et al. (2019) and Li et al. (2024) Reference 9 https://doi.org/10.1021/acsami.9b04933 Reference 10 https://doi.org/10.1021/acsami.4c15742 | Sourced |
| The Materials Project is an open dataset that uses high-throughput computing to uncover the properties of known inorganic materials | Abstract of Jain et al. (2013) Reference 11 https://doi.org/10.1063/1.4812323 | Sourced |
| Dave et al.: robot Clio and the Bayesian optimizer Dragonfly, 6 electrolytes in 2 working days and 42 experiments, 6 times faster than random search, improved fast charging in 220 mAh pouch cells (graphite | NMC532) | Abstract of Dave et al. (2022) Reference 12 https://doi.org/10.1038/s41467-022-32938-1 | Sourced |
| Attia et al.: early prediction plus Bayesian optimization, 224 candidates in 16 days (more than 500 days for exhaustive search) | Abstract of Attia et al. (2020) Reference 13 https://doi.org/10.1038/s41586-020-1994-5 | Sourced |
| Severson et al.: 124 LFP/graphite cells, lifetimes of 150 to 2,300 cycles, a test error of 9.1% from the first 100 cycles, a two-group classification error of 4.9% from the first 5 cycles | Abstract of Severson et al. (2019) Reference 14 https://doi.org/10.1038/s41560-019-0356-8 | Sourced |
| First-principles calculation of the intercalation voltage of lithium-transition-metal oxide electrodes (title level) | Title and bibliographic data of Aydinol et al. (1997) Reference 15 https://doi.org/10.1016/s0378-7753(96)02638-9 | Sourced |
| Matbench (13 tasks) and Matbench Discovery (evaluating pre-filters for stable crystals, misalignment of regression and classification metrics, false positives near 0 eV/atom above the hull) | Abstracts of Dunn et al. (2020) and Riebesell et al. (2025) Reference 16 https://doi.org/10.1038/s41524-020-00406-3 Reference 17 https://www.nature.com/articles/s42256-025-01055-1 | Sourced |
| Numbers, titles and scope of IEC 62660-1:2018 (2nd edition, 12 December 2018; performance and life testing of cells for electric vehicles; capacity, power density, energy density, storage life, cycle life) and IEC 61960-3:2017 (7 February 2017; portable lithium secondary cells) | IEC Webstore pages Reference 18 https://webstore.iec.ch/en/publication/28965 Reference 19 https://webstore.iec.ch/en/publication/29603 | Sourced |
| BIG-MAP closed on 29 February 2024, is one of the six projects of BATTERY 2030+, and has efforts on sharing and standardizing battery data | The official BIG-MAP site Reference 20 https://www.big-map.eu/ | Sourced |
| Title and bibliographic data of the FAIR principles (Wilkinson et al., 2016) | Bibliographic data of the paper Reference 21 https://doi.org/10.1038/sdata.2016.18 | Sourced |
| The full name of BIG-MAP (Battery Interface Genome – Materials Acceleration Platform) and its goal of making battery discovery 5 to 10 times faster than the current rate (within 5 to 10 years). Part of BATTERY 2030+ | The project description page of BIG-MAP Reference 22 https://www.big-map.eu/big-map | Sourced / Not yet confirmed |
| C(54,3) = 24,804, C(54,4) = 316,251, C(54,5) = 3,162,510. Theoretical capacities: LiFePO₄ 170, LiCoO₂ 274 (137 if half), graphite 372 mAh/g. Voltage errors of 0.1 to 0.5 V giving 2.9 to 14.3% for a material with a 3.5 V mean voltage. Conversion of the measured Na₂LiYCl₆ value to 300 K (about 2×10⁻⁸ S/cm by extrapolation with 0.6 eV) and its ratio to the calculated value (about 5,000 to 6,000 times). 500 / 16 ≈ 31 times | Our calculation (binomial coefficients, atomic masses and the Faraday constant, Arrhenius extrapolation). The reported values are those of Chen et al. and Attia et al. Not measurement results on real batteries | Our calculation |
| An international standard specific to MI for battery materials, a standard for measuring conductivity, the cause of the gap between calculated and measured values, and reports in which independent verification or mass production could be confirmed | Could not be confirmed in the primary sources accessible within the scope of this survey, so they are not stated | Commentary |
| The readings that "a strict condition also drops known good materials", "the same composition gives different conductivities depending on how the sample is made", "what machine learning predicts is, in many cases, the DFT calculated value" and "the five rungs of the ladder of confirmation", and the arrangement of what to leave to AI and what experts decide | This article's arrangement and commentary based on published content. Not views stated by any institution | Commentary |
| That Figs. 2 to 7 and 9 are explanatory drawings, not real observations, and that Figs. 1 and 8 are ImageGen-generated conceptual illustrations | Note by this article | Commentary |
Last updated 22 October 2026. Sources are limited to primary material (peer-reviewed papers, arXiv papers, and the official pages of IEC and BIG-MAP). The texts of IEC standards are paid and could not be checked. The calculation examples are computed by us from reported values and atomic masses, not measurement results on real batteries or materials. An international standard specific to MI for battery materials, a standard for measuring conductivity, the cause of the gap between calculated and measured conductivity, and reports in which independent verification or mass production could be confirmed could not be confirmed and are not stated here. All figures are explanatory concept graphics or drawings that include our calculations. Figs. 1 and 8 are ImageGen-generated conceptual illustrations, and none of them shows a real instrument or measurement result.