TECHNOLOGY EXPLAINER
Benchmarks and How to Read AI Evaluations
— the version, settings, scoring, error and evaluator behind a "score"
The performance of generative AI is usually quoted as a "score" on MMLU, GPQA, SWE-bench and the like. But a score depends on the version of the question set, the prompt format, the number of samples, the thinking strength, the use of tools, the scoring method, the error that comes from the number of items, and who ran the test. Widely used benchmarks can also be retired within a few years by contamination (leakage into training data), errors and saturation. This article sets out, from primary sources, the original papers and settings of representative benchmarks; how settings move scores; how to estimate error (our calculations); real cases of contamination and saturation; who runs evaluations; the methods and limits of LLM-as-judge, human evaluation and leaderboards such as LMArena; and the guidance from NIST, ISO/IEC, HELM and MLCommons. It is organized as a procedure for materials engineers to read a score and to evaluate on their own problems.
- What a "score" is made of (the short version)
- Types of evaluation and the pipeline — where deviations creep in
- Original papers and settings of representative benchmarks
- Settings move scores — format, pass@k, thinking strength, serving
- Estimating error — item counts and confidence intervals (our calculation)
- Contamination, errors and saturation — the "life" of a benchmark
- Who measured it — the evaluator
- LLM-as-judge, human evaluation and leaderboards (such as LMArena): methods and limits
- A materials engineer's view — evaluating on your own problems
- Limits, and what could not be confirmed
- How to read evaluations and standards
- Glossary
- References (primary sources)
- Claim-to-source audit
Sourced = stated in published material (link given)
Our calculation = a figure this article derived, with the assumptions spelled out
Not yet confirmed = a draft, under revision or pre-peer-review, and not final
Our readings of how things work and how to use them are marked separately as Commentary. Inference is shown in bold.
The benchmark figures and descriptions of leaderboards here belong to a particular version, settings, evaluator and date. Figures from different settings are not ranked against each other to say which model is better. Third-party leaderboards (Arena, HELM and others) are treated as reference values, with their method and date stated, and their rankings are not asserted as fact. Model names, how benchmarks are run and policies change quickly, so they are dated. For anything after the check date (15 October 2026), confirm on the official page.
1. What a "score" is made of (the short version)
- A score is a composite of question set, run settings, scoring, aggregation and reporting party: NIST's initial public draft AI 800-2 (January 2026) organizes automated benchmark evaluation into three stages and nine practices: define the objectives and select benchmarks, implement and run the evaluation, and analyze and report the results. It also says that if the aim is comparison, the more consistent the evaluation settings across models, the more comparable the resultsSourced[Ref. 33]. Note that this is a draft of voluntary guidance.
- Benchmarks have a life span: The latest LLMs score above 90% on MMLU, which led to the harder HLE [Ref. 15]. An estimated 6.49% of MMLU questions contain errors [Ref. 3], and in February 2026 OpenAI stopped reporting SWE-bench Verified scores, citing contamination among other reasons [Ref. 10]Sourced.
- A score without an error bar cannot be read: For a hypothetical 30-question set at 80% accuracy, item sampling alone gives a 95% interval of about ±14 pointsOur calculation (Chapter 5). Leaderboards based on human votes, such as Arena, also need to be read with their method and intervals in mind (Chapter 8).
Read a benchmark score as a five-part set: version, settings, scoring, item count (error) and evaluator. If any one is missing, the score is not a basis for ranking it against other numbers. And a high score does not mean the model is usable for your own task (Chapter 9).
2. Types of evaluation and the pipeline — where deviations creep in
(1) Four types of evaluation
Evaluations of language models can be organized into four types by how they are scored (our classification).
- Matching against the answer key: MMLU (multiple choice), GPQA (multiple choice), GSM8K, MATH and AIME (matching the final answer) and similar [Ref. 1, 4, 6, 7].
- Run and score: As in HumanEval, generated code is run against unit tests to decide pass or fail. SWE-bench judges whether a fix to an issue in a real repository passes the tests [Ref. 5, 8].
- Judgement by humans or LLMs: MT-Bench, Chatbot Arena (human preference votes), parts of HELM Capabilities (LLM judges) and similar [Ref. 23, 24, 29].
- Updating benchmarks: LiveCodeBench, LiveBench and others, which add new problems continuously to avoid contamination [Ref. 13, 14].
Separately, there is a type that measures safety (suppression of harmful output); MLCommons' AILuminate evaluates the resistance of a system across 12 hazard categories [Ref. 30]. This article focuses on how to read capability evaluations; agent and safety evaluation are covered in our explainers on agent evaluation and safety and on AI safety evaluation and risk management.
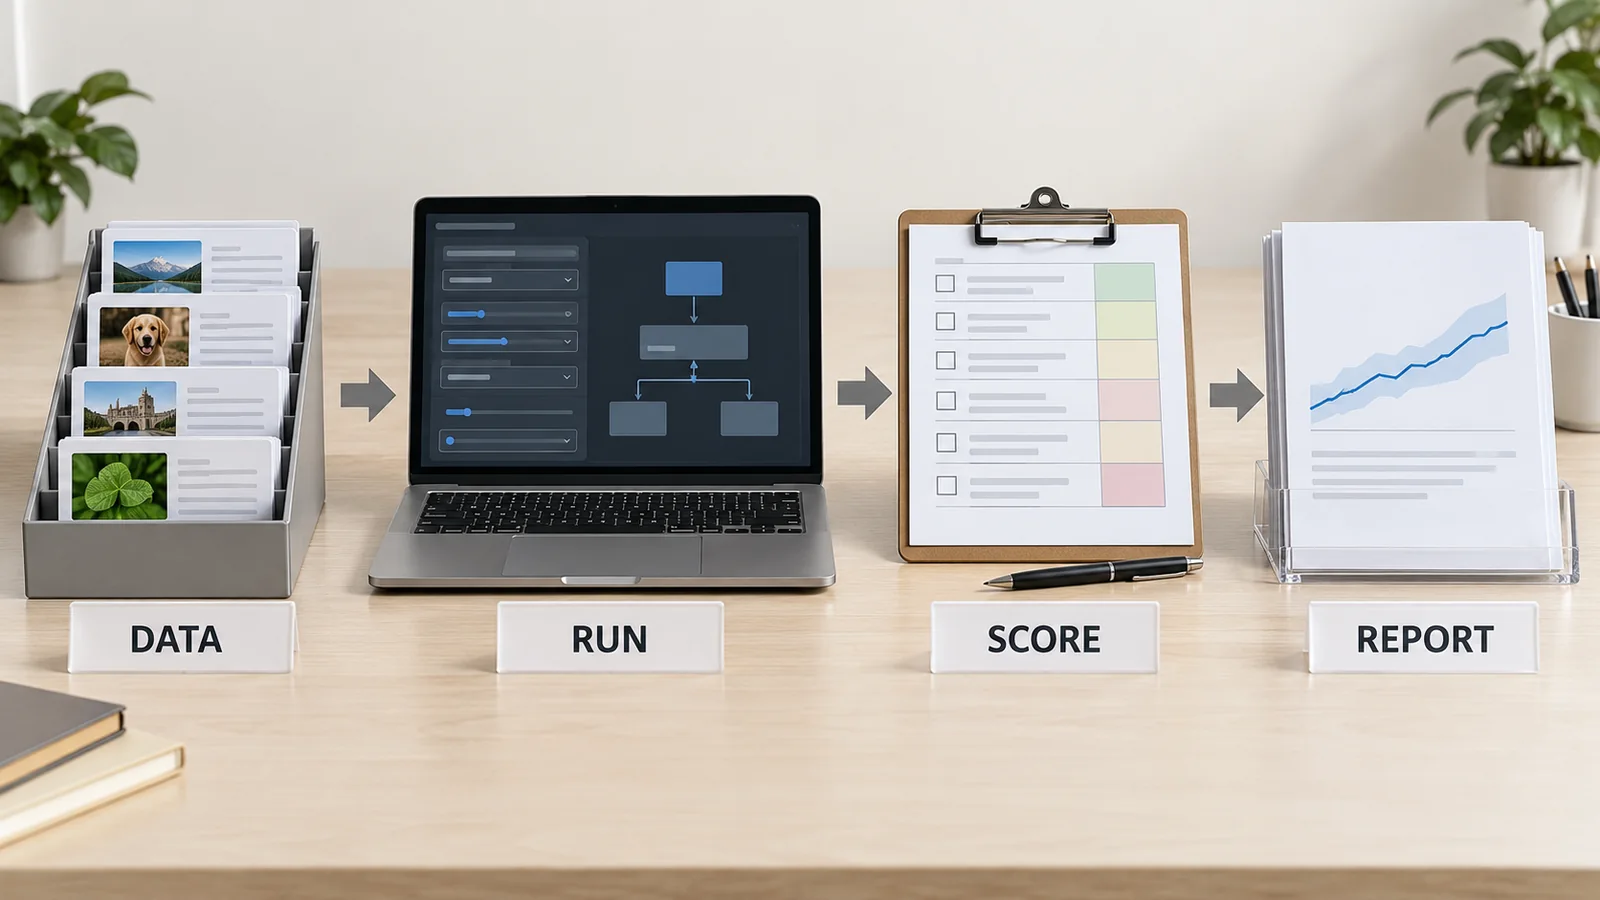
(2) The pipeline, and where deviations enter
The NIST AI 800-2 initial public draft divides evaluation settings into four kinds: inference settings (such as temperature or reasoning effort), scaffolding settings (such as tool availability and best-of-N), task settings and scoring settings [Ref. 33]. Borrowing that grouping, Fig. 2 puts the whole pipeline on one page.
View original SVG, values and source annotations
3. Original papers and settings of representative benchmarks
The table below gives the scale and format confirmed in the original papers and official pages of the main benchmarks named in this article. It does not give score levels. The same name can denote different versions or subsets, so always check "which version".
| Name (source) | What it measures; scale | Scoring | Cautions in reading |
|---|---|---|---|
| MMLU (Hendrycks et al. 2020, arXiv 2009.03300) [1] | Multiple choice across 57 subjects (elementary mathematics, US history, computer science, law and others). 15,908 questions split into sets; 14,079 test questions, at least 100 test questions per subject | Multiple-choice accuracy | At release, even the largest GPT-3 beat random chance by only about 20 points on average. Scores above 90% are now reported, so differences are small [15]. An estimated 6.49% of questions contain errors [3] |
| MMLU-Pro (Wang et al. 2024, arXiv 2406.01574) [2] | An extension of MMLU with ten options instead of four, more reasoning-heavy questions, and trivial or noisy questions removed | Multiple-choice accuracy | According to the authors, accuracy drops 16 to 33 points relative to MMLU, and the variation across 24 prompt styles falls from 4 to 5% on MMLU to 2%. Unlike MMLU, chain of thought helps |
| MMLU-Redux (Gema et al. 2024, arXiv 2406.04127) [3] | A subset of 5,700 MMLU questions re-annotated by hand across all 57 subjects | Annotation of whether a question has errors | An estimated 6.49% of MMLU questions contain errors; in the Virology questions analyzed, 57% had errors. Re-annotation showed discrepancies with originally reported performance |
| GPQA (Rein et al. 2023, arXiv 2311.12022) [4] | Multiple-choice questions written by experts in biology, physics and chemistry. Extended 546, GPQA main set 448, Diamond 198 | Multiple-choice accuracy | On the Extended set, expert accuracy is 64.8% and non-expert 34.1%. The main and Diamond sets are filtered by validator answers, and the paper notes selection effects in their accuracy figures |
| GSM8K (Cobbe et al. 2021, arXiv 2110.14168) [6], MATH (Hendrycks et al. 2021, arXiv 2103.03874) [7] | GSM8K: 8.5K grade-school math word problems. MATH: 12,500 competition math problems | Match of the final answer | GSM1k provides a contamination check [16] (Chapter 6). OpenAI said that MATH and GSM8K can no longer differentiate models effectively [44] |
| AIME (MAA) [43] | An invitational competition of the Mathematical Association of America: a 15-question exam, each answer an integer from 0 to 999. AI evaluations use the problems of particular years (AIME 2024, 2025 and so on) | Match of the final answer | Very few items (if, say, the I and II exams together make 30, the error is large, as Chapter 5 shows). The year, number of samples and thinking strength must be stated |
| HumanEval (Chen et al. 2021, arXiv 2107.03374) [5] | 164 hand-written programming problems (write a function from a docstring) | Unit-test execution. pass@k (the paper uses n = 200, k ≤ 100) | An old set, long since published. Overlap with training data has been pointed out [17]. Check the value of k (Chapter 4) |
| SWE-bench (Jimenez et al. 2023, arXiv 2310.06770) [8] / SWE-bench Verified (OpenAI, 13 August 2024) [9] | 2,294 real GitHub issues from 12 Python repositories. Verified is a 500-problem subset confirmed by experts | The fix must pass both the tests for the issue and the existing regression tests | At publication the best result was 1.96%, by Claude 2 [8]. The history of Verified and the later halt in reporting are in Chapter 6 |
| LiveCodeBench (Jain et al. 2024, arXiv 2403.07974) [13] / LiveBench (White et al. 2024, arXiv 2406.19314) [14] | LiveCodeBench continuously collects problems from LeetCode, AtCoder and CodeForces; at the time of the paper, 400 problems from May 2023 to May 2024. LiveBench updates problems monthly from recent sources and scores automatically against objective answers | Test execution / matching to objective answers | Designed to avoid overlap with a model's training data by dating the problems. Even so, the problem period must be checked against the training cutoff of the model evaluated |
| HLE (Phan et al., Nature 649, 1139–1146, published 28 January 2026) [15] | 2,500 questions written by nearly 1,000 experts: mathematics, humanities, natural sciences and more; multiple choice and short answer | Matching to the answer. The paper uses an LLM (o3-mini) as judge, allowing for equivalent notations | Questions were first tried on several frontier models, and only those the models could not solve went to expert review (of more than 70,000 attempts, about 13,000 stumped the models and went to review). The paper itself says the low accuracy is partly by design. A private held-out set is kept apart from the public set to check for overfitting and gaming |
| ChemBench (Mirza et al. 2024, arXiv 2404.01475) [42] | More than 2,700 questions evaluating chemical knowledge and reasoning, with a comparison against chemists | Automated | The authors report that the best models outperformed the best chemist in their study on average, but struggled with some basic tasks and made overconfident predictions. We did not confirm whether a peer-reviewed version exists |
All Sourced (original papers, official pages and journals; checked 15 October 2026). Part of the "cautions in reading" column is our commentary.
4. Settings move scores — format, pass@k, thinking strength, serving
Even the same model gives different scores under different evaluation settings. The table below organizes the main factors confirmed in primary sources.
| Setting | What primary sources confirm | What to record (commentary) |
|---|---|---|
| Prompt format | Sclar et al. reported that several widely used open models are extremely sensitive to meaning-preserving changes in format alone (separators, layout and the like) in few-shot settings, with differences of up to 76 accuracy points for LLaMA-2-13B. The sensitivity remains when the model is larger, when more examples are given, or after instruction tuning, and performance across formats correlates only weakly between models. The authors suggest reporting performance over a range of plausible formats instead of a single format [19] | The full prompt, separators, how options are written, how the answer is extracted. If possible, the range over several formats |
| Number of shots, use of chain of thought | On MMLU-Pro, chain of thought raises performance over direct answering, which was not the case on the original MMLU [2]. HELM Capabilities evaluates its two multiple-choice tasks with zero-shot chain of thought [29] | Number of shots, the chain-of-thought instruction, and whether the official prompt template was used |
| The k in pass@k and the number of samples | HumanEval's pass@k is computed with an unbiased estimator: generate n (≥ k) samples, of which c pass (the paper uses n = 200, k ≤ 100) [5] | k, n and temperature. As Fig. 3 shows, a different k gives a different number for the same model |
| Thinking strength and sample count (reasoning models) | The NIST AI 800-2 initial public draft gives cost-performance trade-off settings such as reasoning effort as an example of settings to choose so as to mirror real-world use [33]. For specifics see our explainer on reasoning models | Effort, thinking level or budget; pass@1 or cons@k; tokens used |
| Tools and scaffolding | The same draft treats scaffolding settings (tool availability, aggregation such as best-of-N) as a setting of their own, alongside inference, task and scoring settings [33] | Available tools and versions, the agent configuration, number of retries |
| State of serving | The draft lists as evaluation pitfalls that a model can be served in a degraded state because of misconfiguration or bugs in the inference engine, quantization or chat template, and that even commercial providers can differ in the context length at which they serve a given model [33] | Which API and which quantization were used, the context length, and the retrieval date |
| Evaluation code and answer extraction | The developers of lm-evaluation-harness, drawing on three years of experience, list sensitivity to evaluation setup, difficulty of comparing methods, and a lack of reproducibility and transparency as challenges, and make recommendations [20]. The draft also includes answer parsing and benchmark version control among its practices [33] | The name and version of the evaluation framework, the benchmark version, logs |
All Sourced (original papers and the NIST draft). The right-hand column is our commentary. NIST AI 800-2 is an initial public draft (January 2026), not a final version.
pass@k as an example: the same model can be "1%" or "75%"
For a model with about 1% per-sample success (2 of n = 200 samples pass), the HumanEval unbiased estimator gives pass@1 of 1.0%, pass@10 of 9.8% and pass@100 of 75.1%. At 5% success (c = 10), pass@1 is 5.0%, pass@10 is 40.9% and pass@100 is 99.9%Our calculation. All are computed from the same results of the same model; only k differs.
5. Estimating error — item counts and confidence intervals (our calculation)
Miller treats an evaluation as an experiment whose questions can be seen as drawn from an unseen population, and gives formulas for analyzing evaluation data, measuring the difference between two models, and planning an evaluation [Ref. 21]. NIST's draft likewise says statistics should be reported with estimated uncertainty wherever possible, and gives as examples of sources of variation the nondeterministic sampling of completions for each item and the sampling of items into the benchmark [Ref. 33]. BetterBench reports that most of the 24 benchmarks it assessed did not report statistical significance and did not allow results to be easily replicated [Ref. 22]Sourced.
Here we compute the 95% interval of accuracy for each benchmark size in the simplest case (each item right or wrong, items drawn independently). The accuracies are assumptions and not real model values.
| Items (example of the scale) | Assumed accuracy | Standard error (points) | 95% interval (standard error × 1.96) |
|---|---|---|---|
| 30 (assumed size of AIME I and II together) | 80% | 7.3 | ±14.3 (65.7 to 94.3) |
| 164 (HumanEval) | 90% | 2.3 | ±4.6 (85.4 to 94.6) |
| 198 (GPQA Diamond) | 70% | 3.3 | ±6.4 (63.6 to 76.4) |
| 500 (SWE-bench Verified) | 70% | 2.0 | ±4.0 (66.0 to 74.0) |
| 14,079 (MMLU test) | 85% | 0.30 | ±0.6 (84.4 to 85.6) |
Our calculation (standard error = √(p(1−p)/n)). Item counts are Sourced from the original papers and official pages [Ref. 4, 5, 8, 9, 1]. Accuracies are assumed. The 30 is an assumption from AIME being two exams a year (the MAA page mentions I and II) of 15 questions each; the number of items actually used must be checked for each evaluation.
When two models are compared on the same question set, an analysis that uses the item-by-item differences (a paired analysis) is effective, and NIST's draft gives a statistical test on the paired difference as the example for comparing two models' mean scores [Ref. 33]. Treating them naively as independent, at 500 items and 70% accuracy the standard error of the difference between two models is about 2.9 points and the 95% interval about ±5.7 pointsOur calculation. At 198 items it is about ±9.0 points. In other words, a difference of a few points can lie within the error, depending on the size of the question set.
Around 70% accuracy, the number of items needed to detect a difference between two independent groups, in the sense that the 95% interval around the observed difference excludes zero, is about 160 for a 10-point difference, about 650 for 5 points and about 4,000 for 2 pointsOur calculation (normal approximation, (1.96/difference)² × 2p(1−p)). This is a guide for designing your own evaluation in Chapter 9.
The MMLU test has 14,079 questions, so the statistical error is small (±0.6 points in the table above). But the deviation that comes from the quality of questions and answer keys, such as the estimate that about 6.49% of questions contain errors [Ref. 3], does not disappear as the number of items grows. A statistical interval shows only "the variation on this question set"; whether the set measures what you want to measure has to be checked separately. NIST's draft also asks, within its benchmark-selection practice, whether the benchmark relates to the construct to be measured and whether its quality is sufficient (diversity, number of items, contamination) [Ref. 33].
6. Contamination, errors and saturation — the "life" of a benchmark
(1) Three problems
Contamination is the mixing of evaluation questions or answers into training data. A survey calls it Benchmark Data Contamination and describes it as a model inadvertently incorporating evaluation-benchmark information from its training data, leading to inaccurate or unreliable performance at evaluation [Ref. 18]. Errors are mistakes in the questions or answer keys themselves, and saturation is when top models reach such high scores that differences disappear (our organization).
(2) Evidence of contamination
- GSM1k: Zhang and colleagues commissioned a new set of arithmetic problems, GSM1k, mirroring the style and difficulty of GSM8K, and evaluated leading open and closed models. Accuracy dropped by up to 8%, and several families of models showed evidence of systematic overfitting across almost all model sizes. They also report that many models, especially frontier ones, show minimal signs of overfitting, and that all models broadly generalize to novel problemsSourced[Ref. 16].
- Rephrasing: Yang and colleagues showed that removal based on n-gram overlap is insufficient, because simple variations such as paraphrasing or translation bypass it, and that if such variations are not removed even a 13B model can overfit and reach scores on par with GPT-4. They also report that 8 to 18% of HumanEval overlaps with the pre-training data of RedPajama-Data-1T and StarCoder-DataSourced[Ref. 17].
(3) Evidence of errors and saturation
- Errors: Gema and colleagues re-annotated 5,700 MMLU questions by hand and estimated that 6.49% of MMLU questions contain errors, with 57% of the Virology questions analyzed containing errors, and showed discrepancies with the originally reported performance [Ref. 3].
- Saturation: The HLE paper says its motivation was that the latest LLMs now exceed 90% on popular benchmarks such as MMLU, which limits measurement of the state of the art [Ref. 15]. OpenAI also wrote that recent frontier models score very highly on MATH and GSM8K, so these benchmarks no longer differentiate models effectively [Ref. 44].
(4) A case: SWE-bench and its successors
SWE-bench is an example where the "life" of a benchmark can be followed along one lineage.
- October 2023: SWE-bench consisted of 2,294 real GitHub issues from 12 Python repositories, and the best model at release (Claude 2) solved 1.96% of them [Ref. 8].
- 13 August 2024: OpenAI, judging that SWE-bench contained tasks that were hard or impossible to solve and systematically underestimated model capability, released SWE-bench Verified, a 500-problem subset confirmed by experts. In the annotation, 38.3% of tasks were flagged as having underspecified problem statements and 61.1% as having unit tests that could reject valid solutions, and 68.3% were excluded overall. OpenAI also said this filtering was likely overly aggressive [Ref. 9].
- September 2025: SWE-Bench Pro was released with 1,865 problems from 41 repositories, split into public, held-out and commercial sets (arXiv 2509.16941) [Ref. 11].
- 23 February 2026: OpenAI announced that it had stopped reporting SWE-bench Verified scores, recommended that other model developers do the same, and recommended reporting SWE-bench Pro results. Its reasons were that state-of-the-art progress had slowed from 74.9% to 80.9% over the previous six months; that an audit of 27.6% of the problems the models often failed to solve (138 problems) found material problems, such as test cases that reject functionally correct submissions, in at least 59.4%; and that every frontier model tested could reproduce the original fix (the gold patch) or specifics of the problem statement. It wrote that improvements on Verified increasingly reflect how much the model was exposed to the benchmark during training rather than real-world software development abilitySourced[Ref. 10].
- 8 September 2026: Other authors claimed that SWE-Bench Pro also has reward hacking through leakage of gold solutions or hidden evaluation information, and task-quality problems such as misleading problem statements and improperly scoped tests, and published a paper proposing a verified version, SWE-Bench Pro VerifiedNot yet confirmed[Ref. 12] (a pre-peer-review preprint whose content we have not verified).
(5) Countermeasures, and their limits
- Updating benchmarks: LiveCodeBench separates problems by release date and LiveBench updates its questions monthly and scores automatically against objective answers [Ref. 13, 14]. But the model's training cutoff must be matched against the problem period (commentary).
- Held-out sets: HLE keeps a private held-out set apart from the public set, to check overfitting and gaming of the public benchmark [Ref. 15].
- Canary strings: NIST's draft lists mixing unique strings into benchmark data, to check for blatant training on the test set, as an emerging practice. It also lists keeping benchmark data hidden during training, and using data created after the system was built, as ways to lower contamination risk [Ref. 33].
- Selection criteria: HELM Capabilities says it chose scenarios by considering whether they are saturated given state-of-the-art performance, how recent they are, and their quality (clarity, adoption and reproducibility) [Ref. 29].
A benchmark plays a role like a standard test piece or reference sample. But the more an AI question set is reused, the more it loses the power to measure, through "leaking into training", "errors being found" and "everyone approaching a full score". A reference sample in materials can be reproduced to the same composition even when consumed, whereas once a benchmark is published, it is hard to reproduce under the same conditions (our commentary). So read a public benchmark score together with whether it is the latest version, whether it is updated and whether it has contamination countermeasures, and in your own work keep your own evaluation set that is not made public (Chapter 9).
7. Who measured it — the evaluator
Even for the same benchmark, the freedom in settings, the interests involved and the verifiability differ with who ran it. The table below organizes the evaluators confirmed in primary sources. It does not say which is "right"; it shows what to check.
| Evaluator | Examples (what primary sources confirm) | Cautions in reading (commentary) |
|---|---|---|
| The developer (self-reported) | The appendix to OpenAI's o1 post and the gpt-oss model card give tables in which the developer evaluated its own models [44; our explainer on reasoning models]. The audit of SWE-bench Verified is also OpenAI's own analysis [10] | The developer chooses the settings (thinking strength, number of samples, tools). They are not necessarily the same conditions as another company's figures. An independent reproduction often cannot be confirmed |
| Independent research institutions and universities | HELM (Stanford CRFM) describes itself as a reproducible and transparent framework for evaluating foundation models [45]; its paper measured seven metrics (accuracy, calibration, robustness, fairness, bias, toxicity, efficiency) on 16 core scenarios and evaluated 30 models on 42 scenarios [28]. HELM Capabilities narrows five tasks (MMLU-Pro, GPQA, IFEval, WildBench, Omni-MATH) to 1,000 items each, uses zero-shot chain of thought for multiple choice, and scores some tasks as the mean of several LLM judges. All prompts are published [29] | Its strength is that it can be checked prompt by prompt. On the other hand, keeping up with new model releases is a burden, so the freshness of a leaderboard needs checking (the latest HELM Capabilities release on the page on 15 October 2026 was v1.15.0, dated 24 November 2025) |
| Industry bodies | MLCommons' AILuminate v1.0 evaluates whether an AI system resists prompts designed to elicit harmful output across 12 hazard categories (violent crimes, privacy, defamation, specialized advice and others). It has a five-level grading scale (Poor to Excellent) and an entropy-based response evaluation. The authors state limits such as evaluator uncertainty and single-turn interaction [30, 31] | It evaluates safety, so its purpose differs from capability benchmarks. What it assesses is the system's response to prompts, not the real-world frequency of harm |
| Public bodies | NIST's CAISI published the initial public draft NIST AI 800-2 (January 2026), guidance on practices for automated benchmark evaluation [33, 35]. The UK AI Security Institute develops Inspect, an open-source evaluation framework, with Meridian Labs [32] | These are guidance and tools, not model leaderboards. The draft is not a final version (Chapter 11) |
| Community voting and platforms | Chatbot Arena (now Arena) collects human preferences from users' pairwise comparisons and estimates scores with a Bradley–Terry model [24]. The code for evaluation and ranking is published as Arena-Rank [26] | It reflects human preference, but is affected by the distribution of questions, preferences for length and format, and how pre-release models are handled (Chapter 8) |
All Sourced (papers and official pages; checked 15 October 2026). The right-hand column is our commentary. The latest HELM Capabilities release is the version and date shown on the page.
- Who measured it (the developer, an independent party, votes)
- When it was measured (model version and retrieval date, benchmark version)
- Which settings (prompt, shots, thinking strength, tools, the k in pass@k)
- How many items, and how large the error is (Chapter 5)
- How it was scored (answer matching, test execution, LLM judge, humans)
- Whether the question set is affected by contamination, errors or saturation (Chapter 6)
8. LLM-as-judge, human evaluation and leaderboards (such as LMArena): methods and limits
(1) LLM-as-judge (scoring by an LLM)
Zheng and colleagues examined using strong LLMs as judges to evaluate open-ended responses. They showed that judges have position bias (favoring an answer by where it appears), verbosity bias and self-enhancement bias (favoring their own outputs), as well as limited reasoning ability, and proposed mitigations. They then reported that strong judges such as GPT-4 reach more than 80% agreement with both controlled and crowdsourced human preferences, the same level of agreement as between humansSourced[Ref. 23].
HELM Capabilities is a real example of this method. For WildBench, several LLMs (GPT-4o, Llama 3.1 405B Instruct Turbo and Claude 3.5 Sonnet) score a response against a checklist and the scores are averaged. For Omni-MATH judging, HELM did not use the judging prompt of the original paper but switched to the LLM-judge prompt of HELM Safety, because human verification (canary results) showed that the original prompt encouraged hallucination by the judgesSourced[Ref. 29]. This is primary-source evidence that the choice of judges and the prompt can change a score (commentary).
(2) Human evaluation and leaderboards: the case of Arena
Chatbot Arena is a mechanism in which users compare the anonymous responses of two models and vote. The paper describes using pairwise comparison and crowdsourced votes, ranking with a Bradley–Terry model, collecting more than 240K votes at the time of the paper, and finding that votes agree well with expert raters [Ref. 24]. In the Bradley–Terry model, the probability that model m beats m′ is 1/(1 + eξm′−ξm), where ξ is each model's coefficient [Ref. 24]. From this formula we calculated the relation between the coefficient difference and the win probability.
| Coefficient difference Δξ | 0.05 | 0.1 | 0.2 | 0.3 | 0.5 |
|---|---|---|---|---|---|
| Probability that the higher-ranked model wins one comparison | 51.2% | 52.5% | 55.0% | 57.4% | 62.2% |
Our calculation (formula: the Bradley–Terry model of the Chatbot Arena paper [Ref. 24]). We have not confirmed the scale of the score shown on the site (the coefficient itself or a converted value), so check the official explanation for how a difference in the displayed score maps to a win probability.
In other words, a rank separated by a small coefficient difference is close to a coin flip in any single comparison. Arena's official policy (updated 1 September 2026) says the evaluation and ranking pipelines are open-sourced as Arena-Rank so anyone can audit them with released data. It lists only generally available models (open weights, public APIs, public services); collects at least 1,000 votes before a rating is considered stable; treats scores of models evaluated before release as preliminary until enough fresh votes are collected after release; allows providers to test several variants before release; and says that even when sampling probabilities are uneven, the regression uses reweighting so the scores stay unbiasedSourced[Ref. 26].
(3) The dispute over fairness of leaderboards: both sides
"The Leaderboard Illusion" by Singh and colleagues claimed that undisclosed private-testing practices favor a few providers who can test several variants before release and withdraw scores if they wish, and that because they can choose the best score, Arena scores are biased by selective disclosure. It also estimated that proprietary closed models are sampled at higher rates than open-weight models, creating asymmetries in access to Arena data, and said that access to Arena data yields large gains on the Arena distribution [Ref. 25]. In a statement of 9 May 2025 (updated 13 June 2025), Arena responded that the paper contains constructive points but also incorrect claims. For example, it said that the plot behind the claim that pre-release testing could raise scores by more than 100 points was a simulation with Gaussians unrelated to Arena's policy or real performance, that the real effect is small (about +11 Elo after about 50 tests and 3,000 votes) and vanishes as fresh data accumulate, and that open models account for 40.9% in its official statistics [Ref. 27]. This article does not judge which is right. What is certain is that both sides are publicly arguing that how a leaderboard is operated (who may test which model, when and how many times) can affect what a score means, and that Arena has written down its policy of treating pre-release scores as preliminary (commentary).
Use a leaderboard (Arena, HELM and others) after checking its method, date, version and confidence interval, as material for narrowing down candidates, and do not assert its rankings as fact. A ranking by human preference does not necessarily match correctness in your work (for example, accuracy of material properties). An evaluation like HELM, whose prompts and responses are published and reproducible, is easier to check against your own settings [Ref. 28, 29].
9. A materials engineer's view — evaluating on your own problems
ChemBench is a framework that evaluates chemical knowledge and reasoning with more than 2,700 questions, and its authors report that the best models outperformed the best chemists in their study on average, while struggling with some basic tasks and making overconfident predictions [Ref. 42]. A question set that measures general chemical knowledge is different from judgement under the conditions of your own formulations, processes and equipment. As an inference, a model can still make mistakes with your terminology, your measurement conditions and the way your standards are used, even when a general benchmark is high. So build a small evaluation set from your own representative questions (for example, reading your test standard differently, converting units in process conditions, proposing candidate causes of a defect), have the responsible person fix the correct answers, and score the model's outputs.
Around 70% accuracy, the number of items needed to detect a difference between two settings is, as in Chapter 5, about 160 for 10 points, about 650 for 5 points and about 4,000 for 2 pointsOur calculation. If you can prepare only 50 questions, only differences much larger than 10 points will show. A small evaluation set cannot establish that "this model is better"; it suits uses that rule out "clearly unusable" (commentary). When two settings are compared on the same questions, a paired analysis can detect a difference with fewer items [Ref. 33].
While public benchmarks degrade through contamination and saturation (Chapter 6), an in-house evaluation set is harder to contaminate as long as it is protected from being used for training. If you input an evaluation set into an external service, how it is handled (retention, use for training) depends on the contract and settings, so check before use, and if you cannot confirm it, evaluate with a model or tool you can run in-house (a general caution, not advice from this article). The canary string that NIST's draft gives as an example (putting a unique string in the evaluation data) can also be applied to an in-house set [Ref. 33]. As the NIST draft recommends, also keep the evaluation logs (full outputs), the exact versions of the model and system, and the code version, and where possible report cost alongside performance [Ref. 33].
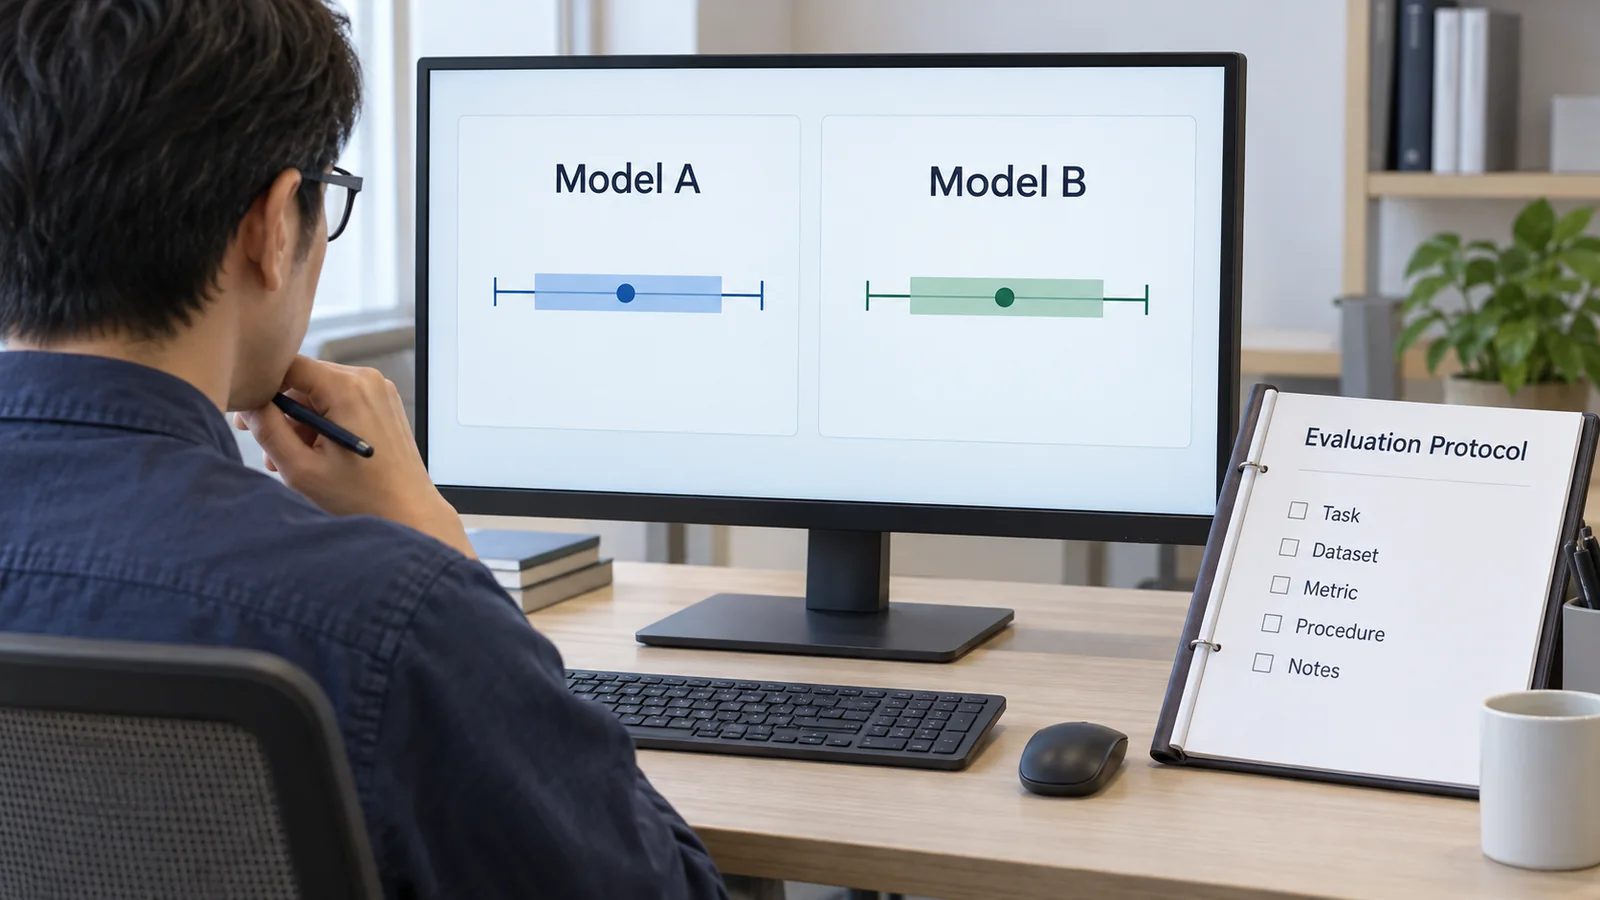
A procedure for your own evaluation (commentary)
- Decide the purpose: write down what the results will be used for (narrowing candidates, an adoption decision, monitoring in operation) and the capability you want to measure.
- Build the evaluation set: have the responsible person fix representative questions and answers. Give it a spread of difficulty and recheck for errors.
- Fix the settings: decide and record the prompt, shots, temperature, thinking strength, tools and scoring method.
- Run several times and give the error: run several times under the same settings and add an interval suited to the number of items.
- Keep results and resources used: keep the outputs, tokens used, cost, and the model version and date.
- Re-evaluate regularly: prepare for model updates and retirements by being able to rerun under the same settings.
10. Limits, and what could not be confirmed
(1) Current values of scores
This article does not list the scores or rankings of particular models. The latest rankings of HELM, Arena and others change after the check date. The latest release of HELM Capabilities we confirmed on its page was v1.15.0 (24 November 2025), and we did not check whether a newer one had appeared by 15 October 2026.
(2) Verification of the claims of companies and institutions
OpenAI's analysis of SWE-bench Verified (the audit and the evidence of contamination), the claims of both Arena and "The Leaderboard Illusion", and the claims of the SWE-Bench Pro Verified paper are all statements in published documents, and we have not reproduced them independently. SWE-Bench Pro Verified is a pre-peer-review preprint.
(3) Text of standards and drafts
For ISO/IEC standards we checked only the title, publication date and scope (abstract) on the official page, not the full text. For NIST AI 800-2 we retrieved the PDF of the initial public draft and confirmed its structure and main practices, but could not confirm a final version as of 15 October 2026. NIST AI 100-1 was checked in its PDF.
(4) Scale of Arena scores
We could not confirm whether the score shown on Arena's site is the Bradley–Terry coefficient itself or a converted value. The win-probability table in Chapter 8 is for differences in the coefficient.
(5) Evaluation in materials and chemistry
We could not confirm a primary source for a widely agreed evaluation standard specific to the materials and process field, or for the effectiveness of the in-house evaluation procedure proposed here. Chapter 9 is this article's commentary.
- A score is a composite of version, settings, scoring, item count and evaluator. There are cases where changing the setting alone, such as the format, moves it by up to 76 pointsSourced
- pass@k becomes a different number for each k. Even a model with 1% success can have a pass@100 of 75%Our calculation
- With few items, the error is large. Assuming 80% accuracy on 30 questions, the 95% interval is ±14 pointsOur calculation
- Benchmarks have a life span. Errors in MMLU, evidence of overfitting on GSM1k, and the halt in reporting of SWE-bench Verified can be confirmed in primary sourcesSourced
- Leaderboards are reference values. Use them after checking Arena's operating policy and the claims of both sides on its fairnessSourced
- Keep an unpublished evaluation set for your own problems. The smaller the difference you want to detect, the more items you needOur calculation
11. How to read evaluations and standards
Because this article is itself about how to read evaluations, this chapter lists, as far as we could confirm them, the standards, guidelines and frameworks that bear on the design, running and reporting of benchmarks. Few international standards directly define the evaluation of AI; most international documents are in the form of technical reports (TR) and technical specifications (TS) that organize concepts and terminology. The original papers of individual benchmarks are in Chapter 3.
| What is evaluated | Representative benchmark or evaluation method (name, source) | Standards and guidelines (ISO/IEC, NIST and others) | Cautions in reading |
|---|---|---|---|
| Design, running and reporting of benchmark evaluation in practice | The HELM framework (Stanford CRFM) [28, 45]; the account of lm-evaluation-harness experience [20]; the UK AI Security Institute's Inspect [32]; BetterBench (24 benchmarks assessed against 46 practices) [22]Sourced | NIST AI 800-2 "Practices for Automated Benchmark Evaluations of Language Models", initial public draft (CAISI, January 2026, DOI 10.6028/NIST.AI.800-2.ipd). Voluntary guidance setting out three stages and nine practices: objectives and benchmark selection, implementing and running the evaluation, and analysis and reporting; comments were invited until 31 March 2026. NIST's page (updated 30 September 2026) still listed it as an initial public draft on 15 October 2026, and we could not confirm a final version [33, 35]Not yet confirmed | The draft describes recommended practice, not requirements, and has no legal force. Practices marked "emerging practice" are still taking shape |
| Multi-metric, comprehensive evaluation | HELM: seven metrics (accuracy, calibration, robustness, fairness, bias, toxicity, efficiency) measured on core scenarios [28]. HELM Capabilities narrows five tasks to 1,000 items each [29]Sourced | ISO/IEC TR 42106:2026 (an overview of conceptual frameworks for differentiated benchmarking of AI system quality characteristics; published July 2026; TR = technical report) [36]Sourced | HELM is an academic framework, not an ISO/IEC standard. A TR is an overview, not requirements |
| Measuring performance on classification, regression and similar tasks | Could not be confirmed (a common method aimed at capability benchmarks of generative models) | ISO/IEC TS 4213:2022 (assessment of machine learning classification performance; October 2022; TS = technical specification) [37]. The next version, ISO/IEC DIS 4213 "Performance measurement for AI classification, regression, clustering and recommendation tasks", is under developmentNot yet confirmed (from the ISO page) | From the title and scope, it covers measuring the performance of predictive models such as classifiers; we could not confirm that it directly addresses the free-form evaluation of generative AI |
| Quality models and evaluation guidance | Could not be confirmed | ISO/IEC 25059:2023 (SQuaRE quality model for AI systems; June 2023) [40]. ISO/IEC TS 25058:2024 (guidance for quality evaluation of AI systems; January 2024; at the review stage, to be replaced by AWI 25058) [39]. ISO/IEC TS 42119-2:2025 (overview of testing AI systems, applying ISO/IEC/IEEE 29119; November 2025) [38]Sourced | They provide vocabulary and frameworks for quality characteristics; they do not set which benchmark to measure with or a passing score. The full text is paid and was not checked |
| Data quality (including evaluation data) | Could not be confirmed | ISO/IEC 5259-2:2024 (data quality for analytics and machine learning, Part 2: data quality measures; November 2024) [41]. Only the title and publication date were checkedSourced | We do not state whether it applies to benchmark question sets, because we could not confirm its abstract |
| Safety and reliability benchmarks | MLCommons AILuminate v1.0 (12 hazard categories, five grades, arXiv 2503.05731) [30, 31]. The Safety and AIR-Bench leaderboards of HELM [45]Sourced | The MEASURE function of NIST AI 100-1 (AI RMF 1.0, January 2023) describes quantitative, qualitative and mixed-method tools to analyze, assess, benchmark and monitor AI risk [34]Sourced (a voluntary framework) | AILuminate is an industry-body benchmark, not a standard. It evaluates responses to prompts, not the real-world frequency of harm |
| Operation of leaderboards | The pipelines for evaluation and ranking are published as Arena-Rank [26]. The method of Chatbot Arena [24]Sourced | Could not be confirmed (no ISO/IEC or NIST standard defining how leaderboards are operated was found; Arena's official policy [26] is that company's own operating policy) | Operating policies can change (the policy was updated 1 September 2026). Check how pre-release testing and preliminary scores are handled |
Standard numbers, titles, publication dates and stages were checked on the official ISO and NIST pages (Sourced; checked 15 October 2026). The essentials of benchmarks and frameworks come from each original paper or official page. The arrangement of the table and the "cautions in reading" column are Our calculation (our own organization).
Cautions in reading
- Benchmark values change with the settings and the evaluator. The format alone can move a score by up to 76 points, and a different k can make the same model 1% or 75% (Chapter 4). Read a score as a five-part set: version, settings, scoring, item count and evaluator.
- Watch for saturation and contamination. As the examples of MMLU, GSM8K and SWE-bench Verified show, widely used question sets lose the power to separate models through errors, contamination and saturation (Chapter 6). Prefer scores that come with countermeasures such as being recent, updated or held out.
- Read standards and guidelines by whether they recommend or require, and whether they have legal force. NIST AI 800-2 is a draft of voluntary guidance, AI 100-1 is a voluntary framework, and ISO/IEC TRs and TSs are reports and specifications. HELM, MLCommons and Arena are not standards. None of them decides "which model is better".
- Distinguish declared values from measured values. A score announced by a developer is a declared value; a score you measure under your own settings is a measured value (Chapter 9).
12. Glossary
- Benchmark
- A mechanism that turns a model's capability into a number using a fixed question set and scoring method.
- pass@k
- Probability that at least one of up to k tries on a problem passes. Computed with an unbiased estimator from n samples and c passes.
- cons@k (majority vote)
- Accuracy when the most frequent answer among k samples is taken.
- Contamination
- Evaluation questions or answers mixing into training data.
- Saturation
- Top models reaching high scores so that differences disappear.
- LLM-as-judge
- Having an LLM score or compare responses. Position, verbosity and self-enhancement biases are known.
- Bradley–Terry model
- A statistical model that estimates a strength coefficient for each model from pairwise win-loss results. Used by Arena.
- Standard error and 95% interval
- A guide to the uncertainty from drawing the items. For a binary accuracy, √(p(1−p)/n); the interval is 1.96 times that.
- Held-out set
- Questions kept unpublished and used to check overfitting and gaming.
- Canary string
- A unique string put in evaluation data as a marker to check whether it was used in training.
- Scaffolding
- The machinery outside the model (tools, retries, aggregation). It shapes the results of agent evaluations.
- TR / TS
- ISO/IEC technical report / technical specification. Different from an International Standard (IS) with requirements.
- Initial public draft (IPD)
- A not-yet-final document that NIST issues to invite comment.
13. References (primary sources)
- Hendrycks D. et al. "Measuring Massive Multitask Language Understanding", arXiv:2009.03300 (2020; v3 January 2021) — arxiv.org/abs/2009.03300
- Wang Y. et al. "MMLU-Pro: A More Robust and Challenging Multi-Task Language Understanding Benchmark", arXiv:2406.01574 (2024; v6 November 2024) — arxiv.org/abs/2406.01574
- Gema A. P. et al. "Are We Done with MMLU?", arXiv:2406.04127 (2024; v3 January 2025; MMLU-Redux) — arxiv.org/abs/2406.04127
- Rein D. et al. "GPQA: A Graduate-Level Google-Proof Q&A Benchmark", arXiv:2311.12022 (November 2023) — arxiv.org/abs/2311.12022
- Chen M. et al. "Evaluating Large Language Models Trained on Code", arXiv:2107.03374 (July 2021; HumanEval and pass@k) — arxiv.org/abs/2107.03374
- Cobbe K. et al. "Training Verifiers to Solve Math Word Problems", arXiv:2110.14168 (October 2021; GSM8K) — arxiv.org/abs/2110.14168
- Hendrycks D. et al. "Measuring Mathematical Problem Solving With the MATH Dataset", arXiv:2103.03874 (March 2021) — arxiv.org/abs/2103.03874
- Jimenez C. E. et al. "SWE-bench: Can Language Models Resolve Real-World GitHub Issues?", arXiv:2310.06770 (October 2023; v3 November 2024) — arxiv.org/abs/2310.06770
- OpenAI "Introducing SWE-bench Verified" (13 August 2024; updated 24 February 2025) — openai.com/index/introducing-swe-bench-verified/
- OpenAI "Why we no longer evaluate SWE-bench Verified" (23 February 2026) — openai.com/index/why-we-no-longer-evaluate-swe-bench-verified/
- Deng X. et al. "SWE-Bench Pro: Can AI Agents Solve Long-Horizon Software Engineering Tasks?", arXiv:2509.16941 (September 2025; v2 November 2025) — arxiv.org/abs/2509.16941
- Zheng P. et al. "SWE-Bench Pro Verified: A Reliable Benchmark for Software Engineering Agents", arXiv:2609.08149 (8 September 2026; v3 9 October 2026; pre-peer-review preprint) — arxiv.org/abs/2609.08149
- Jain N. et al. "LiveCodeBench: Holistic and Contamination Free Evaluation of Large Language Models for Code", arXiv:2403.07974 (March 2024; v2 June 2024) — arxiv.org/abs/2403.07974
- White C. et al. "LiveBench: A Challenging, Contamination-Limited LLM Benchmark", arXiv:2406.19314 (June 2024; v2 April 2025) — arxiv.org/abs/2406.19314
- Phan L. et al. "A benchmark of expert-level academic questions to assess AI capabilities (Humanity's Last Exam)", Nature 649, 1139–1146 (published 28 January 2026), DOI 10.1038/s41586-025-09962-4. Preprint arXiv:2501.14249 — doi.org/10.1038/s41586-025-09962-4
- Zhang H. et al. "A Careful Examination of Large Language Model Performance on Grade School Arithmetic", arXiv:2405.00332 (May 2024; v4 November 2024; GSM1k) — arxiv.org/abs/2405.00332
- Yang S. et al. "Rethinking Benchmark and Contamination for Language Models with Rephrased Samples", arXiv:2311.04850 (November 2023) — arxiv.org/abs/2311.04850
- Xu C. et al. "Benchmark Data Contamination of Large Language Models: A Survey", arXiv:2406.04244 (June 2024) — arxiv.org/abs/2406.04244
- Sclar M. et al. "Quantifying Language Models' Sensitivity to Spurious Features in Prompt Design or: How I learned to start worrying about prompt formatting", arXiv:2310.11324 (October 2023; v2 July 2024) — arxiv.org/abs/2310.11324
- Biderman S. et al. "Lessons from the Trenches on Reproducible Evaluation of Language Models", arXiv:2405.14782 (May 2024; v3 May 2026) — arxiv.org/abs/2405.14782
- Miller E. "Adding Error Bars to Evals: A Statistical Approach to Language Model Evaluations", arXiv:2411.00640 (November 2024) — arxiv.org/abs/2411.00640
- Reuel A. et al. "BetterBench: Assessing AI Benchmarks, Uncovering Issues, and Establishing Best Practices", arXiv:2411.12990 (November 2024) — arxiv.org/abs/2411.12990
- Zheng L. et al. "Judging LLM-as-a-Judge with MT-Bench and Chatbot Arena", arXiv:2306.05685 (June 2023; v4 December 2023) — arxiv.org/abs/2306.05685
- Chiang W.-L. et al. "Chatbot Arena: An Open Platform for Evaluating LLMs by Human Preference", arXiv:2403.04132 (March 2024) — arxiv.org/abs/2403.04132
- Singh S. et al. "The Leaderboard Illusion", arXiv:2504.20879 (April 2025; v2 May 2025) — arxiv.org/abs/2504.20879
- Arena "Arena Leaderboard Policy" (official policy; published 2 March 2024, updated 1 September 2026; checked 15 October 2026) — arena.ai/blog/policy/
- Arena "Our Response to 'The Leaderboard Illusion' Writeup" (9 May 2025, updated 13 June 2025; checked 15 October 2026) — arena.ai/blog/our-response
- Liang P. et al. "Holistic Evaluation of Language Models", arXiv:2211.09110 (November 2022; v2 October 2023; TMLR 2023) — arxiv.org/abs/2211.09110
- Stanford CRFM "HELM Capabilities: Evaluating LMs Capability by Capability" (blog post, 20 March 2025) — crfm.stanford.edu/2025/03/20/helm-capabilities.html
- Ghosh S. et al. (MLCommons) "AILuminate: Introducing v1.0 of the AI Risk and Reliability Benchmark from MLCommons", arXiv:2503.05731 (February 2025; v2 April 2025) — arxiv.org/abs/2503.05731
- MLCommons "AILuminate" (official page; checked 15 October 2026) — mlcommons.org/ailuminate/
- UK AI Security Institute / Meridian Labs "Inspect: An open-source framework for large language model evaluations" (official documentation; checked 15 October 2026) — inspect.aisi.org.uk/
- NIST (CAISI) "Practices for Automated Benchmark Evaluations of Language Models", NIST AI 800-2 Initial Public Draft (January 2026), DOI 10.6028/NIST.AI.800-2.ipd — nvlpubs.nist.gov/nistpubs/ai/NIST.AI.800-2.ipd.pdf
- NIST "Artificial Intelligence Risk Management Framework (AI RMF 1.0)", NIST AI 100-1 (January 2023), DOI 10.6028/NIST.AI.100-1 — doi.org/10.6028/NIST.AI.100-1
- NIST "Towards Best Practices for Automated Benchmark Evaluations" (published 30 January 2026; comments until 31 March 2026). The NIST Guidelines page (updated 30 September 2026) was also checked — www.nist.gov/news-events/news/2026/01/towards-best-practices-automated-benchmark-evaluations
- ISO/IEC "ISO/IEC TR 42106:2026 Differentiated benchmarking of AI system quality characteristics" (July 2026; technical report) — www.iso.org/standard/42106
- ISO/IEC "ISO/IEC TS 4213:2022 Information technology — Artificial intelligence — Assessment of machine learning classification performance" (October 2022) — www.iso.org/standard/79799.html
- ISO/IEC "ISO/IEC TS 42119-2:2025 Artificial intelligence — Testing of AI — Part 2: Overview of testing AI systems" (November 2025) — www.iso.org/standard/84127.html
- ISO/IEC "ISO/IEC TS 25058:2024 … SQuaRE — Guidance for quality evaluation of artificial intelligence (AI) systems" (January 2024) — www.iso.org/standard/82570.html
- ISO/IEC "ISO/IEC 25059:2023 … SQuaRE — Quality model for AI systems" (June 2023) — www.iso.org/standard/80655.html
- ISO/IEC "ISO/IEC 5259-2:2024 Artificial intelligence — Data quality for analytics and machine learning (ML) — Part 2: Data quality measures" (November 2024) — www.iso.org/standard/81860.html
- Mirza A. et al. "Are large language models superhuman chemists?", arXiv:2404.01475 (April 2024; v2 November 2024; ChemBench) — arxiv.org/abs/2404.01475
- Mathematical Association of America (MAA) "MAA Invitational Competitions" (description of AIME; checked 15 October 2026) — maa.org/maa-invitational-competitions/
- OpenAI "Learning to reason with LLMs" (12 September 2024; states that MATH and GSM8K no longer differentiate models) — openai.com/index/learning-to-reason-with-llms/
- Stanford CRFM "Holistic Evaluation of Language Models (HELM)" (official site and leaderboard list; latest Capabilities release v1.15.0, 24 November 2025; checked 15 October 2026) — crfm.stanford.edu/helm/
14. Claim-to-source audit
| Claim in the article | Basis | Type |
|---|---|---|
| NIST AI 800-2 initial public draft: three stages and nine practices, the four kinds of evaluation settings, comparability, reporting cost with performance, degraded serving, evaluation cheating (such as grader gaming), canary strings, ways to lower contamination, statistical and uncertainty practices, January 2026 and DOI, comment period | NIST draft PDF and news page Reference 33 https://nvlpubs.nist.gov/nistpubs/ai/NIST.AI.800-2.ipd.pdf Reference 35 https://www.nist.gov/news-events/news/2026/01/towards-best-practices-automated-benchmark-evaluations | Sourced |
| That the draft was still listed as an initial public draft on 15 October 2026, and that comments were invited until 31 March 2026 | NIST Guidelines page (updated 30 September 2026) Reference 35 https://www.nist.gov/news-events/news/2026/01/towards-best-practices-automated-benchmark-evaluations | Sourced |
| NIST AI 100-1 (January 2023), the description of the MEASURE function, and that it is voluntary | NIST AI RMF 1.0 Reference 34 https://doi.org/10.6028/NIST.AI.100-1 | Sourced |
| MMLU: 57 subjects, 15,908 questions, 14,079 test questions, at least 100 test questions per subject, results at publication | Hendrycks et al. Reference 1 https://arxiv.org/abs/2009.03300 | Sourced |
| MMLU-Pro (ten options, 16 to 33 point drop, prompt sensitivity 4 to 5% to 2%, CoT helps). MMLU-Redux (5,700 questions, estimated 6.49% errors, Virology 57%) | Wang et al.; Gema et al. Reference 2 https://arxiv.org/abs/2406.01574 Reference 3 https://arxiv.org/abs/2406.04127 | Sourced |
| GPQA sets (Extended 546, main 448, Diamond 198) and accuracy (experts 64.8%, non-experts 34.1%) | Rein et al. Reference 4 https://arxiv.org/abs/2311.12022 | Sourced |
| HumanEval 164 problems, the unbiased estimator of pass@k (n = 200, k up to 100). GSM8K 8.5K problems, MATH 12,500 problems | Chen et al.; Cobbe et al.; Hendrycks et al. Reference 5 https://arxiv.org/abs/2107.03374 Reference 6 https://arxiv.org/abs/2110.14168 Reference 7 https://arxiv.org/abs/2103.03874 | Sourced |
| AIME has 15 questions, answers are integers from 0 to 999, and there are two exams, I and II | MAA page Reference 43 https://maa.org/maa-invitational-competitions/ | Sourced |
| SWE-bench: 2,294 problems, 12 repositories, best result 1.96% at publication. Verified: 500 problems, annotation results of 38.3%, 61.1% and 68.3% | Jimenez et al.; OpenAI announcement (2024) Reference 8 https://arxiv.org/abs/2310.06770 Reference 9 https://openai.com/index/introducing-swe-bench-verified/ | Sourced |
| OpenAI's halt in reporting Verified (23 February 2026): 74.9% to 80.9%, audit of 138 problems, 59.4%, 35.5% and 18.8%, reproduction of gold patches, recommendation of SWE-bench Pro | OpenAI announcement (2026) Reference 10 https://openai.com/index/why-we-no-longer-evaluate-swe-bench-verified/ | Sourced |
| SWE-Bench Pro (1,865 problems, 41 repositories, three sets). The claims of SWE-Bench Pro Verified (pre-peer-review) | Deng et al.; Zheng et al. Reference 11 https://arxiv.org/abs/2509.16941 Reference 12 https://arxiv.org/abs/2609.08149 | Sourced |
| LiveCodeBench (400 problems, May 2023 to May 2024), LiveBench (monthly updates, top models below 70%) | Each paper Reference 13 https://arxiv.org/abs/2403.07974 Reference 14 https://arxiv.org/abs/2406.19314 | Sourced |
| HLE (2,500 questions, nearly 1,000 experts, pre-submission check against models, about 13,000 questions reviewed, held-out set, judging by o3-mini, MMLU above 90%), Nature publication date, volume and pages | HLE Nature paper Reference 15 https://doi.org/10.1038/s41586-025-09962-4 | Sourced |
| GSM1k (accuracy down by up to 8%, evidence of systematic overfitting, frontier models show few signs) | Zhang et al. Reference 16 https://arxiv.org/abs/2405.00332 | Sourced |
| Bypassing decontamination by rephrasing, overfitting of a 13B model, 8 to 18% overlap of HumanEval | Yang et al. Reference 17 https://arxiv.org/abs/2311.04850 | Sourced |
| Definition and organization of Benchmark Data Contamination | Xu et al. Reference 18 https://arxiv.org/abs/2406.04244 | Sourced |
| A difference of up to 76 points from format, weak correlation across models, the proposal to report ranges | Sclar et al. Reference 19 https://arxiv.org/abs/2310.11324 | Sourced |
| Experience with an evaluation harness and challenges of reproducibility | Biderman et al. Reference 20 https://arxiv.org/abs/2405.14782 | Sourced |
| Statistics for evaluations (drawing from a population, differences between two models, planning), and that most of 24 benchmarks do not report statistical significance | Miller; BetterBench Reference 21 https://arxiv.org/abs/2411.00640 Reference 22 https://arxiv.org/abs/2411.12990 | Sourced |
| Biases of LLM-as-judge (position, verbosity, self-enhancement) and agreement above 80% | Zheng et al. (MT-Bench) Reference 23 https://arxiv.org/abs/2306.05685 | Sourced |
| The method of Chatbot Arena (pairwise comparison, Bradley–Terry, more than 240K votes, agreement with experts) and the win-probability formula | Chiang et al. Reference 24 https://arxiv.org/abs/2403.04132 | Sourced |
| Arena's operating policy: Arena-Rank, only public models listed, 1,000 votes, preliminary scores, testing of several variants, reweighting | Arena official policy (updated 1 September 2026) Reference 26 https://arena.ai/blog/policy/ | Sourced |
| The claims of "The Leaderboard Illusion" and Arena's response (about +11 Elo, open models 40.9% and so on) | Singh et al.; Arena statement Reference 25 https://arxiv.org/abs/2504.20879 Reference 27 https://arena.ai/blog/our-response | Sourced |
| HELM (seven metrics, 16 core scenarios, 30 models, 42 scenarios), HELM Capabilities (five tasks, 1,000 items each, mean of LLM judges, change of the Omni-MATH prompt, selection criteria), the leaderboard list and the latest release | HELM paper, blog and official site Reference 28 https://arxiv.org/abs/2211.09110 Reference 29 https://crfm.stanford.edu/2025/03/20/helm-capabilities.html Reference 45 https://crfm.stanford.edu/helm/ | Sourced |
| AILuminate v1.0 (12 hazard categories, five grades, entropy-based evaluation, limits) | MLCommons paper and page Reference 30 https://arxiv.org/abs/2503.05731 Reference 31 https://mlcommons.org/ailuminate/ | Sourced |
| That Inspect is an open-source evaluation framework by the UK AI Security Institute and Meridian Labs | Inspect documentation Reference 32 https://inspect.aisi.org.uk/ | Sourced |
| Numbers, titles, publication dates and stages of ISO/IEC TR 42106:2026, TS 4213:2022 (DIS 4213 under development), TS 42119-2:2025, TS 25058:2024 (AWI 25058 planned), 25059:2023 and 5259-2:2024 | ISO standard pages Reference 36 https://www.iso.org/standard/42106 Reference 37 https://www.iso.org/standard/79799.html Reference 38 https://www.iso.org/standard/84127.html Reference 39 https://www.iso.org/standard/82570.html Reference 40 https://www.iso.org/standard/80655.html Reference 41 https://www.iso.org/standard/81860.html | Sourced |
| ChemBench (more than 2,700 questions; the authors' report that the best models outperformed the best chemist on average) | Mirza et al. Reference 42 https://arxiv.org/abs/2404.01475 | Sourced |
| OpenAI's statement that MATH and GSM8K no longer differentiate models effectively | OpenAI announcement (2024) Reference 44 https://openai.com/index/learning-to-reason-with-llms/ | Sourced |
| Standard errors and 95% intervals of accuracy (30 / 164 / 198 / 500 / 14,079 items), the interval for the difference between two models, the item counts needed (about 160 / 650 / 4,000), pass@k values (c = 2: 1.0 / 9.8 / 75.1%; c = 10: 5.0 / 40.9 / 99.9%), Bradley–Terry win probabilities (51.2 / 52.5 / 55.0 / 57.4 / 62.2%) | Our calculation. Accuracies, n and c are illustrative assumptions, not any model's values (normal and independence approximations) | Our calculation |
| "A benchmark degrades when reused", "six things to check when you see a score", "a procedure for your own evaluation", the materials engineer's views 1 to 4, and the classification of four types of evaluation | Our own organization and commentary based on published content, not views stated by any institution (this article) | Commentary |
| That Figs. 2, 3, 4 and 5 are illustrative drawings and that Figs. 1 and 6 are ImageGen-generated conceptual illustrations | Notes by this article | Commentary |
| The scale of Arena's displayed score, any newer release of HELM Capabilities, a final version of NIST AI 800-2, a widely agreed evaluation standard in materials, the effectiveness of the in-house procedure, verification of the SWE-Bench Pro Verified content, and the full text of standards | Could not be confirmed in the primary sources accessible within our research, so not stated (this article) | Commentary |
Last updated: 15 October 2026 (check date). Sources are limited to primary materials: original papers, the Nature paper, the official pages of developers and operators, and the official NIST and ISO pages. The full text of the standards is paid and was not checked. How leaderboards and benchmarks are operated changes quickly, and we do not guarantee the state after the check date. The scale of Arena's displayed score, any newer release of HELM Capabilities, a final version of NIST AI 800-2, a widely agreed evaluation standard in materials, the effectiveness of the in-house procedure, verification of the SWE-Bench Pro Verified content, and the full text of standards could not be confirmed and are not stated. Figures in the text belong to a particular version, settings and evaluator and do not show which model is better. The error calculations rest on illustrative assumptions. Figs. 2 to 5 are vector drawings; Figs. 1 and 6 are ImageGen-generated conceptual illustrations. None of them shows a real measurement screen or product.