TECHNOLOGY EXPLAINER
Applications to Catalysts
— searching for catalysts with "adsorption energy" as the yardstick, and how to test calculated and AI predictions against experiment
A catalyst speeds up a reaction, makes only what is wanted, and lasts. The candidates are enormous and cannot be searched by experiment alone. So work is advancing in which calculation and AI estimate how strongly molecules stick to a surface (the adsorption energy) and send only promising candidates on to experiment. This article checks that idea (the volcano plot) with a numerical model, then sorts out, from primary sources, large datasets such as the Open Catalyst Project, examples found by calculation and confirmed by experiment, and an example in which calculation and experiment did not agree. How platinum-group metals are used, and their supply, are left to our explainer on platinum-group metals and catalysts; here we concentrate on how the search is done.
- The short version / before you read / where this sits in the series
- What "searching for catalysts by calculation" means — adsorption energy and the volcano plot
- Examples found by calculation and confirmed by experiment
- Large datasets — the Open Catalyst Project and others
- Reading accuracy figures — how an energy error acts on rate
- Between calculation and experiment — what OCx24 showed
- Learning from the literature — the bias in catalyst data
- Running experiments automatically
- Telling prediction from experiment — the ladder of confirmation
- A materials engineer's view
- Limits, what could not be confirmed, and summary
- How to read the yardsticks and standards
- Glossary
- References
- Claim-to-source audit
Sourced = stated in published material (link given)
Our calculation = a figure this article derived, with the assumptions spelled out
Not yet confirmed = plans, work in progress or proposals, so not final
Readings for materials research are marked separately as Commentary. Inference is shown in bold. Claims by companies and research groups are treated as claims.
The calculations in Sections 2 and 5 are our own calculations with a toy model and physical formulas. They do not show the performance of any real catalyst. Figures from papers are given with their conditions and do not rank research groups or models. The Open Catalyst figures are the baselines of the 2020 paper. This field moves quickly, and the accuracy of the latest models has to be checked on the official leaderboard (we did not check the latest figures here). The checking date is 22 October 2026.
1. The short version / before you read / where this sits in the series
- In catalyst search, "adsorption energy" is the yardstick: how strongly a molecule sticks to a surface lowers activity if it is too strong or too weak (a volcano-shaped relation). Calculation and AI estimate this strength in bulk and narrow the candidates Sourced [Ref. 1, 6].
- There are examples found by calculation and confirmed by experiment: hydrogen evolution (BiPt), CO₂ to methanol (Ni–Ga) and CO₂ to ethylene (Cu–Al). On the other hand, for CO₂ reduction the computed features could hardly explain the experiments, even with the same approach Sourced [Ref. 3, 4, 5, 7].
- An error in calculation acts on rate exponentially: a barrier off by 0.1 eV makes the rate estimate off by about 48 times near room temperature. The baseline error of Open Catalyst in 2020 (around 0.5 eV) is too large to use for predicting rates as it stands Our calculation / Sourced.
It is enough to know that reactions proceed on surfaces and that precious metals are often used. No MI background is needed. Keep four ideas in mind first.
- Materials search = "looking for treasure on a vast map": multiply the combinations of catalysts (metals, alloys, oxides) by the different crystal faces and the different adsorbing molecules, and the candidates are enormous. MI is a tool for narrowing where to look.
- Machine learning = "an approximator that learns trends from past data": it is weak outside the range it learned (extrapolation) and does not understand the laws of physics.
- DFT = "a physics simulation that computes the properties of a material from the behavior of its electrons": it contains approximations and does not necessarily agree with measurements. Adsorption energy is a typical quantity computed with DFT.
- The division of labor among calculation, experiment and AI: calculation "produces candidates cheaply and quickly", experiment "checks whether it is really so", and AI "narrows where to look (by imitating DFT quickly)".
This article is one of the application explainers in our series on materials informatics (MI). How platinum-group metals are used, how they degrade, their supply and recycling are in the explainer on platinum-group metals and catalysts; the contents of DFT are in the fundamentals of density functional theory; machine-learning interatomic potentials have their own explainer; and how to split evaluation data is in the explainers on reading benchmarks and evaluation and on reading MI results and reproducibility. This article can be read on its own; the necessary background is explained in the text.
2. What "searching for catalysts by calculation" means — adsorption energy and the volcano plot
(1) First, an everyday analogy
Think of what happens on a catalyst surface as "receiving a ball and passing it to the next person". If your grip is too weak, you cannot catch the ball at all (the reactant does not stay on the surface and the reaction does not start). If your grip is too strong, you cannot let go (the product stays on the surface and the next reactant cannot land). The right strength gives the fastest cycling. This is the Sabatier principle. Limit of the analogy: on a real surface, several steps proceed at once and the state of the surface changes during the reaction. It is not as simple as passing a ball.
(2) Turning the "right strength" into a number
The number that expresses "how readily something sticks" to a surface is the adsorption energy (the more negative, the stronger the bond). If you plot the adsorption energy of a key intermediate on the horizontal axis and activity on the vertical axis, a mountain shape appears. Because the shape resembles a volcano, it is called a volcano plot. From electronic-structure calculations, Nørskov et al. explained the trend in how fast oxygen reduction proceeds on various metals in terms of the adsorption energies of oxygen and hydroxyl Sourced [Ref. 6]. In other words, the adsorption energy plays the role of a "business card" (a descriptor) that expresses a catalyst as a number.
We check how a volcano plot arises with a small model we built (Fig. 3).
View original SVG, values and sources
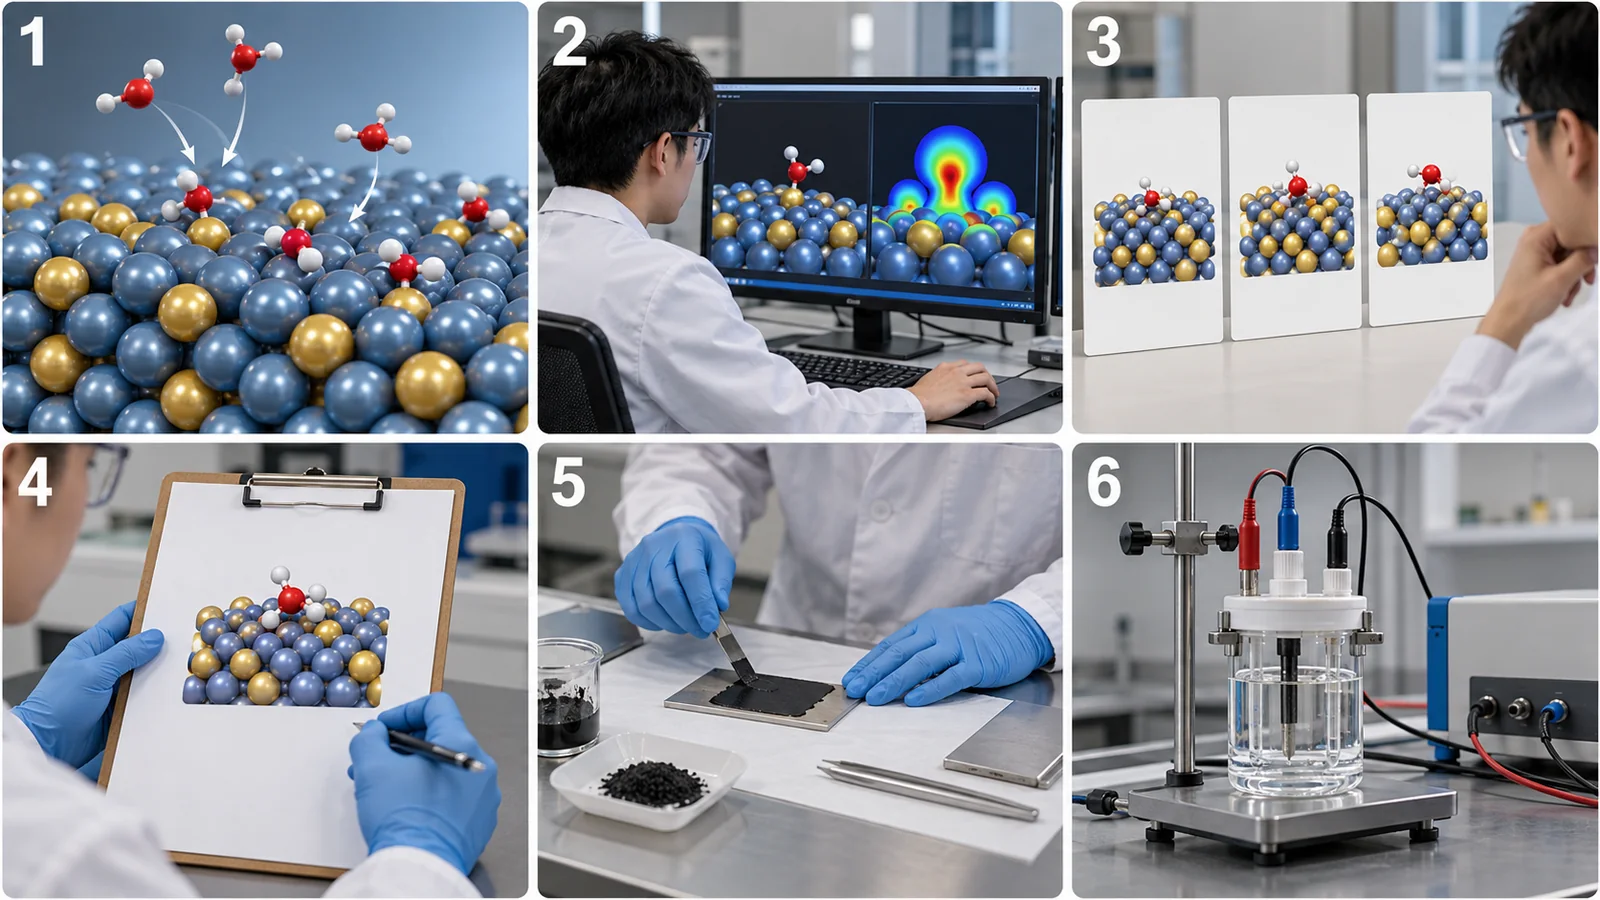
Original SVG reference: Concept diagram (vector drawing). The flow of searching for catalysts with MI. The four steps on the left are prediction by calculation and AI; the two on the right are confirmation by experiment. The division is this article's own; the order and number of steps differ by method.
- Step that activates the reactant: the stronger the adsorption, the lower the barrier (barrier = 0.9 + 0.5×E, where E is the adsorption energy in eV)
- Step in which the product leaves: the stronger the adsorption, the higher the barrier (barrier = 0.2 + max(0, −E))
- We assume the slower step sets the overall rate (500 K). Activity is higher the lower the barrier
In this model, activity is highest at E ≈ −0.47 eV, where the two barriers are equal (Our calculation). On the left (too strong), activity changes by about 10 orders of magnitude per 1 eV of E; on the right (too weak), by about 5, so the slopes of the two sides differ. All numbers are assumptions for illustration, not values for a real reaction.
Why it can: the adsorption energies of several related intermediates are known to move together (scaling relations). So one or two adsorption energies can roughly express the trend in activity (our explanation). Why it cannot: the electrolyte, potential, pH, temperature, particle shape and defects, and the interaction with the support are not contained in adsorption energy. The OCx24 paper states that the energies of isolated adsorbates were not enough to predict the complexity of CO₂ reduction [Ref. 7] (Section 6).
(3) Another guide: the d-band model
For transition-metal surfaces, a widely used idea (the d-band model) is that the position of the energy distribution of the metal's d electrons (the d band) is a guide to adsorption strength. The 1995 paper by Hammer and Nørskov, titled "Why gold is the noblest of all the metals", is known as one of the origins of this idea [Ref. 21] (we checked it only at the level of its title and bibliographic data). A fuller explanation is left to our explainer on the fundamentals of density functional theory.
3. Examples found by calculation and confirmed by experiment
Attempts to search for catalysts by calculation began before AI became common. Here we set out three examples in which calculation narrowed the candidates and experiment confirmed them, based on the papers' abstracts (Fig. 4).
- Hydrogen evolution (Greeley et al., 2006): they evaluated the activity and stability of more than 700 binary surface alloys by DFT and predicted that BiPt would have an activity equal to or better than Pt, the standard catalyst for hydrogen evolution. They synthesized and tested BiPt and report better hydrogen-evolution performance than pure Pt Sourced [Ref. 3].
- CO₂ to methanol (Studt et al., 2014): through descriptor-based analysis and calculation they identified Ni–Ga intermetallic compounds as stable candidates, and synthesized and tested several catalysts. They report that Ni₅Ga₃ was particularly active and selective, with methanol-synthesis activity equal to or better than the conventional Cu/ZnO/Al₂O₃ catalyst and considerably less CO by-product, at ambient pressure Sourced [Ref. 4].
- CO₂ to ethylene (Zhong et al., 2020): using DFT with active learning (a way of choosing candidates efficiently with few calculations) they found Cu–Al alloys. They report a Faradaic efficiency (the share of the electricity that went to the target product) above 80% (about 66% for pure Cu) at a current density of 400 mA/cm², and, by in situ X-ray absorption, a Cu coordination environment that favors C–C bond formation Sourced [Ref. 5].
The misunderstanding: AI designed a catalyst and it turned out as good as predicted.
What is correct: in these examples, the achievement is that calculation (DFT) narrowed the candidates, and people synthesized them and confirmed by experiment. Where machine learning was used, its role was to narrow candidates; whether the catalyst is excellent is decided by synthesis and measurement.
Also, these are successes. Candidates that looked promising by calculation but did poorly in experiment are rarely published, so the success rate cannot be read from them (our commentary).
4. Large datasets — the Open Catalyst Project and others
(1) What is public
The Open Catalyst Project is a joint effort of FAIR (Fundamental AI Research) at Meta and the Department of Chemical Engineering at Carnegie Mellon University. Its official site states the aim of using AI to model and discover catalysts for renewable-energy storage Sourced [Ref. 12]. The public resources are summarized in the table (checked 22 October 2026).
| Name | Contents (as reported) | Purpose |
|---|---|---|
| OC20 (2021) | 1,281,040 DFT relaxations (about 265 million single-point calculations). Diverse materials, surfaces and adsorbates, including nitrogen, carbon and oxygen species. Pre-defined splits for evaluation. Baselines (CGCNN, SchNet, DimeNet++) and a public leaderboard [1] | A common foundation for tasks that predict adsorption energies and forces with AI |
| OC22 (2023) | Oxide electrocatalysts. 62,331 DFT relaxations (about 9.85 million single points). Total-energy tasks. Training jointly with OC20 improved energy prediction by about 36% (GemNet-OC) [2] | Oxide catalysts such as those for the oxygen evolution reaction (OER) |
| OC25 (2025) | A dataset of solid-liquid interfaces. The paper calls it the largest for solid-liquid interfaces, and computes the free energy of CO dimerization on Cu surfaces in cells of over 800 atoms [10] | Electrocatalysis including electrolyte effects (solvent, ions, charge) |
| UMA (2025) | A universal atomic model trained on about half a billion 3-D atomic structures. One model serves molecules, materials and catalysts [11]. The official repository lists oc20, oc22 (oxides) and oc25 (electrocatalysis) as catalysis task names [13] | Catalyst calculations without building a separate model for each task |
| Catalysis-Hub.org | A public database of reactions on catalyst surfaces that gathers more than 100,000 adsorption and reaction energies and records calculation conditions to secure reproducibility [14] | Sharing and reuse of calculated data |
Sources: the abstracts and text of each paper, the official site, and the README of fairchem (checked 22 October 2026). Sourced.
OC20 divides what to predict from a "structure with a molecule on a surface" into three tasks (Fig. 5). S2EF predicts the DFT energy and the force on each atom from the atom positions; this is the same idea as a "machine-learning interatomic potential". IS2RS predicts the structure of lowest energy from the first arrangement, and IS2RE predicts the relaxed energy (the adsorption energy) directly from the first arrangement, which is described as the most common task in catalysis [Ref. 1].
(2) Licenses of models and data
The README of fairchem (Meta FAIR's collection of code) states that the code is under the MIT license and that model and weight licenses vary by application area. To use the UMA models, you must apply for access to the model on Hugging Face and log in Sourced [Ref. 13]. We could not confirm the terms of use of each dataset (whether commercial use is allowed and so on). Check the official statements before using them in your own work.
5. Reading accuracy figures — how an energy error acts on rate
(1) The 2020 baseline figures
The OC20 paper tried three graph neural networks (CGCNN, SchNet, DimeNet++) as baselines. On the task of predicting the relaxed energy from the initial structure (IS2RE), the results when trained on all the training data were as follows Sourced [Ref. 1].
- Mean absolute error (MAE) of energy: 0.50 to 0.92 eV (depending on the model and on the test split)
- The "answer with the median" baseline: 1.68 to 1.89 eV
- Fraction within 0.02 eV error (EwT): about 2 to 7%
- The test has four splits (same range as training / unseen adsorbate / unseen catalyst composition / both unseen). The more unfamiliar the split, the larger the error tends to be
For the S2EF metric, the paper says the results are "still far from practically useful" [Ref. 1]. From the fact that no upper limit on model size was seen in most tasks, it also points to the possibility of improvement with larger models [Ref. 1]. What we stress here is that these are baselines from 2020. Since then, data (OC22, OC25) and models (UMA and others) have been released, and present accuracy may be much better. But we did not check the latest figures. Check the date and conditions on the official leaderboard.
(2) Our calculation: by what factor is the rate off for a 0.1 eV error?
We calculate how serious the size of an energy error is, from the rate equation. The rate of a reaction is roughly proportional to exp(−Ea / kT) for a barrier (activation energy) Ea (k: the Boltzmann constant, T: temperature). If the barrier differs by ΔE, the rate differs by a factor of exp(ΔE / kT). We look at this numerically (Fig. 6). Our calculation
- 300 K (near room temperature): 0.05 eV → 6.9 times, 0.1 eV → 48 times, 0.2 eV → about 2,300 times, 0.5 eV → about 250 million times
- 600 K (an example of gas-phase thermal catalysis): 0.05 eV → 2.6 times, 0.1 eV → 6.9 times, 0.2 eV → 48 times, 0.5 eV → about 16,000 times
So a model with an error of around 0.5 eV cannot be used for a quantitative prediction such as "this catalyst is so many times faster than that one". What it can be used for is a screen that "ranks candidates roughly and reduces the number sent to experiment". However, the error of one method is often largely shared among the catalysts being compared (a systematic shift), and a ranking can be more accurate than an absolute value (our commentary; how far this holds has to be checked for each task).
Fig. 6 is the simplest estimate, assuming "an error in the barrier acts directly on the rate". In practice, an error in adsorption energy may reach the barrier only in part (like the coefficient 0.5 in the model of Fig. 3), or may act in a more complicated way because several steps interact. The figure is meant to give a feel for the point that "an energy error acts exponentially on rate, so even a difference of 0.1 eV cannot be ignored".
(3) How the "structure" is chosen is also a source of error
Adsorption energy changes with where, and in what orientation, the molecule sits on the surface (the adsorption configuration). Finding the lowest-energy configuration is itself laborious work. AdsorbML is a method that searches for low-energy configurations with machine-learning potentials; in a balanced setting it found the lowest-energy configuration 87.36% of the time and made the calculation about 2,000 times faster. For this evaluation they also built the Open Catalyst Dense dataset, with about 1,000 surfaces and about 100,000 configurations Sourced [Ref. 8]. Put the other way, in the remaining 13% or so, the lowest configuration is missed (our calculation: 100% − 87.36%). Such a miss becomes an error that overestimates the energy (our commentary).
Kolluru et al. also state that machine-learning potentials for catalysts, when focused on specific chemistries and compositions, do well at interpolating between data but find it hard to generalize across chemical space, and position OC20 as an attempt to change that Sourced [Ref. 9].
6. Between calculation and experiment — what OCx24 showed
(1) What they did
To close the gap between the predictions of AI-based catalyst calculation and experimental results, Abed et al. built an experimental dataset (OCx24) (a 2024 preprint) Sourced [Ref. 7].
- Experiment: with two synthesis methods (chemical reduction and spark ablation) they synthesized 572 samples of 13 elements, and confirmed composition, purity and structure by XRF and XRD. In 441 gas diffusion electrodes (including replicates) they evaluated CO₂ reduction (CO2RR) and hydrogen evolution (HER) at up to 300 mA/cm². There were 230 independent preparations, which became 179 targets when similar compositions were grouped.
- Calculation: for about 19,400 materials (those in Materials Project, OQMD and Alexandria that could be thermodynamically stable under reaction conditions), they computed adsorption energies for six adsorbates (OH, CO, CHO, C, COCOH, H), combining AI and DFT. It took 685 million structural relaxations and about 20 million DFT single points. The paper calls it the largest computational catalyst screening.
(Our calculation: 685 million / about 20 million ≈ 34. That is the sense of scale: about 34 AI relaxations per DFT single point.)
(2) Result: hydrogen evolution worked; CO₂ reduction did not
- Hydrogen evolution (HER): a linear model with only the adsorption energies of hydrogen (H) and hydroxyl (OH) as features could explain the experimental voltage (R² = 0.59 under LOCO, which removes a composition entirely). The experimental scatter (297 replicates) is σ = 0.043 V. When this model was used to estimate the activity of about 19,400 materials, Pt appeared near the top of the volcano, even though Pt (including alloys) was not in the training data Sourced. The paper also lists 436 materials without Pd, Pt, Rh, Ir, Ru, Au, Os and Ag (282 of them containing Se) as candidates for low-cost HER catalysts. This is a prediction, not a result confirmed by experiment [Ref. 7].
- CO₂ reduction (CO2RR): production rates of each product were predicted with random forests. Under the evaluation where the same composition is on the training side (LOO), R² was 0.46 for H₂, 0.44 for CO and 0.43 for liquid products. But under the evaluation that removes the composition entirely (LOCO), it was 0.22 for H₂, 0.18 for liquid products, 0.00 for CO and 0.01 for ethylene, hardly explained at all. The paper concludes that the energies of isolated adsorbates plus elemental features are not enough to predict the complexity of this chemistry Sourced [Ref. 7].
The misunderstanding: compute adsorption energies in bulk with DFT or AI and you can tell good catalysts from bad for any reaction.
What is correct: in OCx24, hydrogen evolution could be explained by adsorption energies, but CO₂ reduction was hardly explained by the same approach. The paper says that CO₂ reduction has many reaction pathways (even for products with up to two carbons there can be hundreds of reactions) and that the effects of the electrolyte, pH, the gas-solid-liquid interface, temperature, reactor design and electric field are not in the simulation [Ref. 7]. The range in which the yardstick of "adsorption energy" works differs by reaction.
LOO (Leave One Out) removes one sample, trains on the rest and evaluates on the removed one. Samples of the same composition remain on the training side, so the model can "match something similar". LOCO (Leave One Composition Out) removes all samples of a composition before evaluating. It is a stricter evaluation of what a catalyst search really needs: the ability to predict compositions never seen before. That LOO does well while LOCO does not is how data leakage and extrapolation show up in catalysts (our commentary; the general discussion is in our explainer on reading benchmarks and evaluation).
From the trend that correlation improves as data grow, the paper expects that increasing the dataset to the 10,000 to 100,000 scale would allow much more predictive models [Ref. 7] (Not yet confirmed; this is the authors' expectation).
7. Learning from the literature — the bias in catalyst data
There is also learning from experimental data reported in the past rather than from calculation. This has also been attempted in catalysis. Suzuki et al., using literature data for the oxidative coupling of methane (OCM), the water-gas shift (WGS) and CO oxidation, showed that feeding in elemental features instead of catalyst compositions directly improves prediction accuracy; gradient boosting (XGBoost) was best, and for OCM they proposed the top 20 candidate catalysts Sourced [Ref. 16]. The same paper says that literature data come with obstacles: little compositional overlap, bias from previously published reports and low sample counts for many elements [Ref. 16].
For OCM there are also a report that combined high-throughput experiments with catalyst informatics [Ref. 17] and one that determined reaction conditions by machine learning [Ref. 18] (we checked them at the level of titles). A review that broadly organizes the application of machine learning to catalysis is by Toyao et al. [Ref. 19] (checked at the title level).
What appears in papers is mostly catalysts that worked. Catalysts that showed no activity or could not be reproduced are rarely published. So an AI trained on the literature can learn "what kind of catalyst is good" but has difficulty learning "what kind is bad" (our commentary). That OCx24 lists "containing both positive and negative results" as a condition of an experimental dataset is a response to this problem [Ref. 7].
When organizing your own experimental data, always record the catalysts that did not work, and their conditions. Catalyst data need, besides composition, the preparation method (impregnation, co-precipitation and so on), loading, calcination conditions, pretreatment (reduction and so on), reaction conditions (temperature, pressure, gas composition, space velocity), the amount of catalyst, and the change of conversion over time. This record decides the value of the data.
8. Running experiments automatically
Another way is to run the experiment itself automatically and let AI choose the next condition. Burger et al. used a mobile robot to search photocatalyst formulations for producing hydrogen from water. The robot operated autonomously for eight days, performing 688 experiments in a ten-variable experimental space, and with a batched Bayesian search it found photocatalyst mixtures six times more active than the initial formulations Sourced [Ref. 20]. (This is a search for photocatalyst mixtures, a different object from the search for metal catalysts.) The general explanation of robots and Bayesian optimization is in our explainers on autonomous laboratories and on Bayesian optimization and active learning. OCx24 also ran a high-throughput flow from synthesis, through characterization by XRD and XRF, to electrolysis tests [Ref. 7].
9. Telling prediction from experiment — the ladder of confirmation
We line up the reports so far by "how far they were confirmed". For catalysts, it helps to divide the stages into five rungs (this article's own arrangement).
- Calculated prediction: prediction of adsorption energy, volcano plot or stability by calculation or AI
- Synthesized, structure and composition confirmed: actually make it and confirm by XRD, XRF, in situ X-ray absorption and so on
- Activity and selectivity at standard conditions: measure activity normalized by area or mass, and product fractions
- Near-real conditions and stability: high current density, pressure, impurities, long tests
- Independent check, scale-up: replication by other groups, reproduction in real devices or mass production
As Fig. 9 shows, OC20 is a dataset, a tool at rung 1 (prediction). The three examples from Greeley et al. to Zhong et al. went through rungs 1 to 3, and OCx24 covered rungs 1 to 3 and part of rung 4 (up to industrially meaningful current densities). But no report among those covered here could be confirmed through rung 5 (independent verification, scale-up). Long-term stability could not be confirmed within the abstracts.
- How far was it confirmed: by calculation only, synthesized and measured, or under near-real conditions?
- What was it compared with: was a baseline catalyst (Pt, Cu, a commercial product) measured under the same conditions? Greeley et al. compared with Pt, and Studt et al. with Cu/ZnO/Al₂O₃ [Ref. 3, 4].
- What was activity normalized by: geometric area, electrochemically active surface area (ECSA) or mass? The standard protocol of McCrory et al. takes the overpotential needed for 10 mA/cm² (per geometric area) as the main metric and also reports specific activity per ECSA [Ref. 15].
- Are the reaction conditions near real use: current density, temperature, pressure, gas purity. For CO₂ reduction there is a report evaluated at a high current density of 400 mA/cm² [Ref. 5].
- Stability: however high the activity, a catalyst that degrades in hours cannot be used. Greeley et al. also looked at stability by calculation [Ref. 3], but long-term stability by experiment could not be confirmed within the abstract. For the degradation of platinum and iridium, see our explainer on platinum-group metals and catalysts.
10. A materials engineer's view
What calculation handles is a neatly cut crystal face with a molecule placed on it. A real catalyst has nanoparticles, defects, interfaces with the support, impurities and a surface that changes during the reaction (the materials gap). The OCx24 paper states that ordered intermetallic nanoparticles are easy to model by calculation but exceptionally hard to synthesize, with high failure rates, so every sample has to be characterized Sourced [Ref. 7]. Many samples did not take the target structure in XRD; in that case the adsorption energy of the material with the closest composition was substituted [Ref. 7].
In practice it is safer to confirm in this order: (1) was the target structure formed (XRD, compositional analysis), (2) particle size and shape (microscopy), (3) the state of the surface under reaction conditions (in situ measurement), (4) activity, selectivity and stability. The prediction from calculation is a story about the clean surface in (1); (2) to (4) are confirmed by experiment.
- Use adsorption energy for "ranking": look not at absolute values but at the order of candidates and their position relative to a baseline catalyst (your current product) (Section 5).
- Check whether the yardstick works for each reaction: some reactions, like hydrogen evolution, can be explained by adsorption energy and some, like CO₂ reduction, cannot (Section 6). First check whether, for your reaction, the model reproduces the order of known catalysts.
- Put in known catalysts to check the model: whether a known good catalyst appears near the top of the predictions, like Pt in OCx24, is one guide to whether the model is sound [Ref. 7] (though that alone is not enough).
- Experimental design: measure a baseline catalyst under the same conditions each time, confirm reproduction across several lots, normalize by amount of catalyst and surface area, and check the effect of mass transfer in the reactor.
- Record data: keep preparation, pretreatment, reaction conditions and failures (Section 7). Your own experimental data are highly valuable information that calculated data do not have.
What can be left to AI, and where expert judgment is needed
| Situation | Easier to leave to AI | Needs expert judgment |
|---|---|---|
| Pre-selecting candidates | Ranking thousands to tens of thousands of compositions and surfaces by adsorption energy and cutting to a few dozen | Choosing a descriptor suited to the reaction, the validity of conditions, checking against known catalysts |
| Running calculations | Search and relaxation of adsorption configurations with machine-learning potentials (AdsorbML [8]) | Judging whether a case is outside the range the model learned (extrapolation), and how much to check with DFT |
| Synthesis and characterization | (Repetitive work by robots) | Working out why the target structure did not form; designing particle size and loading method |
| Measuring activity and selectivity | Measurements with a fixed procedure, recording of data | Setting reaction conditions, separating mass transfer from reaction rate, evaluating stability |
The table is this article's own arrangement (commentary).
11. Limits, what could not be confirmed, and summary
(1) Latest accuracy
The Open Catalyst accuracy figures are baselines from the 2020 paper. We did not check the accuracy of later models (UMA and others) or the latest values on the official leaderboard.
(2) Papers cited from the abstract or title only
Greeley et al., Studt et al., Zhong et al., Burger et al. and Nørskov et al. are cited from their abstracts; Hammer and Nørskov (1995), Toyao et al., Nguyen et al. and Ohyama et al. from their titles and bibliographic data. OCx24 was checked in the text of the preprint (arXiv); we did not check whether a peer-reviewed published version exists.
(3) Licenses
We confirmed that the fairchem code is under the MIT license, but we did not check the terms of use of each dataset (whether commercial use is allowed and so on) or the licenses of each model's weights.
(4) What we do not cover
We do not cover microkinetic models of reaction rates, models of catalyst degradation and poisoning, homogeneous and enzyme catalysts, photocatalysis (except the one example of Burger et al.), or company case studies. For the supply and recycling of platinum-group metals, see our explainer on platinum-group metals and catalysts.
(5) Developments in Japan
We did not survey data infrastructure for catalyst research in Japan or the efforts of institutions and companies there.
- In catalyst search, adsorption energy is the yardstick. Using the volcano-shaped relation, in which activity falls when binding is too strong or too weak, calculation and AI narrow the candidates Sourced
- There are examples found by calculation and confirmed by experiment. BiPt (hydrogen evolution), Ni–Ga (CO₂ to methanol), Cu–Al (CO₂ to ethylene). But note that successes are the ones more likely to be published Sourced
- Open Catalyst is a common foundation of calculated data. OC20 (1.28 million DFT relaxations), OC22 (oxides), OC25 (solid-liquid interfaces), UMA. The 2020 baseline energy error was 0.50 to 0.92 eV Sourced
- An energy error acts on rate exponentially. A 0.1 eV deviation is about 48 times at 300 K and about 6.9 times at 600 K Our calculation
- How well calculation matches experiment differs by reaction. In OCx24, hydrogen evolution could be explained by adsorption energies (LOCO R² 0.59) and Pt appeared at the predicted top, but CO₂ reduction was hardly explained Sourced
- Questions for evaluating a catalyst: how far was it confirmed, what was it compared with, what was it normalized by, are conditions near real use, and what about stability. No report within this article's scope could be confirmed through independent verification or scale-up.
12. How to read the yardsticks and standards
How good MI for catalysts is depends on what is taken as the correct answer (a DFT value or an experiment), how the evaluation data are split (whether compositions similar to training are included or removed: LOO or LOCO), what it is compared against (the median, a baseline catalyst) and how far it was confirmed (Section 9). We could not find an international standard specific to MI for catalysts. Here are the community benchmarks and shared procedures for experimental evaluation that we could confirm (checked 22 October 2026).
| Item evaluated | Representative benchmarks and evaluation methods (name and source) | Standards and guidelines (ISO/IEC, NIST and others) | Cautions when reading |
|---|---|---|---|
| Predicting adsorption energy and forces | Open Catalyst 2020 (OC20): S2EF (energy MAE, force MAE, EFwT), IS2RS (ADwT, AFbT), IS2RE (energy MAE, fraction within 0.02 eV: EwT). Splits are ID, OOD adsorbate, OOD catalyst and OOD both. A public leaderboard [1, 12]. OC22 (oxides, total-energy tasks) [2], OC25 (solid-liquid interfaces) [10] Sourced | Could not be confirmed | The 2020 baseline figures differ from those of current models. Check the latest on the official leaderboard, with its date and conditions |
| Searching adsorption configurations | AdsorbML and Open Catalyst Dense (about 1,000 surfaces, about 100,000 configurations). Lowest-energy configuration 87.36%, about 2,000 times faster [8] Sourced | Could not be confirmed | The roughly 13% of misses become an error that overestimates the energy |
| Correspondence between computed features and experiment | OCx24 (572 samples, 441 electrodes, HER and CO2RR): R² (LOO and LOCO), experimental scatter σ = 0.043 V (HER voltage) [7] Sourced | Could not be confirmed | LOCO measures the ability on new compositions. A figure from LOO alone can be overstated |
| Comparing catalysts experimentally | The standard protocol of McCrory et al. (18 HER and 26 OER electrocatalysts; the overpotential needed for 10 mA/cm², short-term (2 h) stability, electrochemically active surface area) [15] Sourced | Could not be confirmed (the protocol is a shared procedure shown in a paper, not an ISO-type standard) | Superiority in activity cannot be decided unless catalysts are compared under the same conditions. Check how activity was normalized (geometric area, ECSA, mass) |
| Sharing calculated data | Catalysis-Hub.org (more than 100,000 adsorption and reaction energies, with calculation conditions recorded) [14]. FAIR principles [22] Sourced | (FAIR is a set of principles, not an ISO-type standard) | The principles are recommendations, not requirements. Whether calculation conditions (functional, settings) are consistent across the data is key to reuse |
| Learning from literature data | The study by Suzuki et al. on literature data for OCM, WGS and CO oxidation [16] Sourced | Could not be confirmed | Little compositional overlap, bias from past reports, small sample counts. Few failures recorded |
| Licenses | fairchem: the code is MIT; models and weights vary by use, and UMA requires an application on Hugging Face [13] Sourced | Could not be confirmed (terms for each dataset) | Check the official statements on whether commercial use is allowed |
| Independent verification | — | Could not be confirmed | Within this article's scope, no report could be confirmed through rung 5 (independent verification, scale-up) |
The arrangement of the table is Our calculation (arrangement). Each figure was checked in the paper's abstract or text, or on the official site (22 October 2026).
Cautions when reading (for materials engineers)
- A benchmark ranking is not the ability on your catalyst: a benchmark like OC20 evaluates the prediction of adsorption energies on calculated data. The activity, selectivity and stability of a real catalyst must be confirmed separately.
- Tell prediction from experimental confirmation: always check which rung of the ladder in Section 9 a result is at. "Found by AI" is often a rung 1 story.
- How the data are split: figures change a lot between LOO and LOCO. If you are searching for new compositions, look at the LOCO figure.
- How strong a principle or standard is: the FAIR principles are recommendations. The protocol of McCrory et al. is a proposal for a shared procedure, not a standard with legal force. The authors' expectation (that growing the data to 10,000 to 100,000 would improve prediction) is treated as Not yet confirmed.
13. Glossary
- Catalyst
- A substance that speeds up a reaction without itself being changed.
- Activity / selectivity / stability
- Speed of reaction / share of the wanted product / whether it lasts. The three yardsticks for a catalyst.
- Adsorption / adsorption energy
- A molecule sticking to a surface / how readily it sticks (the more negative, the stronger).
- Sabatier principle
- The idea that binding to a surface that is too strong or too weak lowers activity, and the right strength is best.
- Volcano plot
- A plot of binding strength (horizontal) against activity (vertical) that forms a mountain shape.
- Descriptor
- A "business card" for a catalyst: a number that represents it, such as an adsorption energy.
- Scaling relations
- Relations in which the adsorption energies of related intermediates move together.
- d-band model
- The idea that the energy distribution of a transition metal's d electrons is a guide to adsorption strength.
- DFT (density functional theory)
- A physics simulation that computes the properties of a material from the behavior of its electrons. It contains approximations.
- Relaxation (structural)
- A calculation that moves atoms to the arrangement of lowest energy.
- S2EF / IS2RS / IS2RE
- The three tasks of OC20: predict energy and forces / the relaxed structure / the relaxed energy.
- MAE
- Mean absolute error: the average of the absolute differences between prediction and answer.
- OOD (out of distribution)
- Data outside the range used in training, such as unseen adsorbates or catalyst compositions.
- LOO / LOCO
- Evaluation leaving out one sample / leaving out all samples of one composition. LOCO is stricter.
- HER / OER / CO2RR
- Hydrogen evolution reaction / oxygen evolution reaction / electrochemical reduction of CO₂.
- Faradaic efficiency
- The share of the charge passed that went to the target product.
- Gas diffusion electrode (GDE)
- An electrode that lets gas reach the catalyst layer easily. Used for evaluation at high current density.
- ECSA
- Electrochemically active surface area. One metric for normalizing activity.
- Active learning
- A method in which AI chooses the next data to take, so it learns with few calculations or experiments.
- Materials gap
- The gap between the ideal surface of calculation and a real catalyst (particles, defects, support).
- FAIR principles
- Principles for making data findable, accessible, interoperable and reusable.
- MI (materials informatics)
- Using data, calculation and machine learning to make materials research more efficient.
14. References
- Chanussot L. et al. "Open Catalyst 2020 (OC20) Dataset and Community Challenges", ACS Catal. 11, 6059–6072 (2021), DOI 10.1021/acscatal.0c04525 (the preprint arXiv:2010.09990 was used to check the text) — arxiv.org/abs/2010.09990
- Tran R. et al. "The Open Catalyst 2022 (OC22) Dataset and Challenges for Oxide Electrocatalysts", ACS Catal. 13, 3066–3084 (2023), DOI 10.1021/acscatal.2c05426 (abstract checked at arXiv:2206.08917) — arxiv.org/abs/2206.08917
- Greeley J. et al. "Computational high-throughput screening of electrocatalytic materials for hydrogen evolution", Nat. Mater. 5, 909–913 (2006), DOI 10.1038/nmat1752 — doi.org/10.1038/nmat1752
- Studt F. et al. "Discovery of a Ni-Ga catalyst for carbon dioxide reduction to methanol", Nat. Chem. 6, 320–324 (2014), DOI 10.1038/nchem.1873 — doi.org/10.1038/nchem.1873
- Zhong M. et al. "Accelerated discovery of CO2 electrocatalysts using active machine learning", Nature 581, 178–183 (2020), DOI 10.1038/s41586-020-2242-8 — doi.org/10.1038/s41586-020-2242-8
- Nørskov J. K. et al. "Origin of the Overpotential for Oxygen Reduction at a Fuel-Cell Cathode", J. Phys. Chem. B 108, 17886–17892 (2004), DOI 10.1021/jp047349j — doi.org/10.1021/jp047349j
- Abed J. et al. "Open Catalyst Experiments 2024 (OCx24): Bridging Experiments and Computational Models", arXiv:2411.11783 (November 2024, preprint) — arxiv.org/abs/2411.11783
- Lan J. et al. "AdsorbML: a leap in efficiency for adsorption energy calculations using generalizable machine learning potentials", npj Comput. Mater. 9, 172 (2023), DOI 10.1038/s41524-023-01121-5 (open access) — nature.com/articles/s41524-023-01121-5
- Kolluru A. et al. "Open Challenges in Developing Generalizable Large-Scale Machine-Learning Models for Catalyst Discovery", ACS Catal. 12, 8572–8581 (2022), DOI 10.1021/acscatal.2c02291 (abstract checked at arXiv:2206.02005) — arxiv.org/abs/2206.02005
- Sahoo S. J. et al. "Insights into CO dimerization at electrified Cu interfaces from large-scale machine learning simulations" (introducing Open Catalyst 2025 [OC25]), arXiv:2509.17862 — arxiv.org/abs/2509.17862
- Wood B. M. et al. "UMA: A Family of Universal Models for Atoms", arXiv:2506.23971 — arxiv.org/abs/2506.23971
- Open Catalyst Project "Open Catalyst Project" (official site) — opencatalystproject.org
- Meta FAIR Chemistry "fairchem" (README on GitHub; used to check the code license and the UMA task names; checked 22 October 2026) — github.com/facebookresearch/fairchem
- Winther K. T. et al. "Catalysis-Hub.org, an open electronic structure database for surface reactions", Sci. Data 6, 75 (2019), DOI 10.1038/s41597-019-0081-y (open access) — doi.org/10.1038/s41597-019-0081-y
- McCrory C. C. L. et al. "Benchmarking Hydrogen Evolving Reaction and Oxygen Evolving Reaction Electrocatalysts for Solar Water Splitting Devices", J. Am. Chem. Soc. 137, 4347–4357 (2015), DOI 10.1021/ja510442p — doi.org/10.1021/ja510442p
- Suzuki K. et al. "Statistical Analysis and Discovery of Heterogeneous Catalysts Based on Machine Learning from Diverse Published Data", ChemCatChem 11, 4537–4547 (2019), DOI 10.1002/cctc.201900971 — doi.org/10.1002/cctc.201900971
- Nguyen T. N. et al. "High-Throughput Experimentation and Catalyst Informatics for Oxidative Coupling of Methane", ACS Catal. 10, 921–932 (2020), DOI 10.1021/acscatal.9b04293 (checked at the title level) — doi.org/10.1021/acscatal.9b04293
- Ohyama J. et al. "Data Driven Determination of Reaction Conditions in Oxidative Coupling of Methane via Machine Learning", ChemCatChem 11, 4307–4313 (2019), DOI 10.1002/cctc.201900843 (checked at the title level) — doi.org/10.1002/cctc.201900843
- Toyao T. et al. "Machine Learning for Catalysis Informatics: Recent Applications and Prospects", ACS Catal. 10, 2260–2297 (2020), DOI 10.1021/acscatal.9b04186 (checked at the title level) — doi.org/10.1021/acscatal.9b04186
- Burger B. et al. "A mobile robotic chemist", Nature 583, 237–241 (2020), DOI 10.1038/s41586-020-2442-2 — doi.org/10.1038/s41586-020-2442-2
- Hammer B., Nørskov J. K. "Why gold is the noblest of all the metals", Nature 376, 238–240 (1995), DOI 10.1038/376238a0 (checked at the level of title and bibliographic data) — doi.org/10.1038/376238a0
- Wilkinson M. D. et al. "The FAIR Guiding Principles for scientific data management and stewardship", Sci. Data 3, 160018 (2016), DOI 10.1038/sdata.2016.18 — doi.org/10.1038/sdata.2016.18
15. Claim-to-source audit
| Claim in the text | Basis | Label |
|---|---|---|
| OC20: 1,281,040 DFT relaxations (about 264,890,000 single points), three tasks (S2EF, IS2RS, IS2RE), four splits, three baselines, a public leaderboard. IS2RE baselines: energy MAE 0.50 to 0.92 eV, median baseline 1.68 to 1.89 eV, fraction within 0.02 eV about 2 to 7%. The paper says S2EF results are still far from practically useful. No upper limit on model size was seen in most tasks | Abstract, text and tables of Chanussot et al. (2021) (arXiv version) Reference 1 https://arxiv.org/abs/2010.09990 | Sourced |
| OC22: oxides, 62,331 DFT relaxations (about 9,854,504 single points), about 36% better energy prediction when combined with OC20 (GemNet-OC) | Abstract of Tran et al. (2023) Reference 2 https://arxiv.org/abs/2206.08917 | Sourced |
| BiPt: over 700 binary surface alloys evaluated by DFT, predicted activity equal to or better than Pt, synthesized and tested with better performance than Pt (in agreement with calculation) | Abstract of Greeley et al. (2006) Reference 3 https://doi.org/10.1038/nmat1752 | Sourced |
| Ni–Ga catalyst: candidates found by descriptor analysis and calculation, then synthesized and tested. Ni₅Ga₃ active and selective, methanol activity equal to or better than Cu/ZnO/Al₂O₃, less CO (ambient pressure) | Abstract of Studt et al. (2014) Reference 4 https://doi.org/10.1038/nchem.1873 | Sourced |
| Cu–Al: explored by DFT and active learning. Ethylene Faradaic efficiency above 80% (about 66% for pure Cu) at 400 mA/cm² (1.5 V vs RHE). Coordination environment checked by in situ XAS | Abstract of Zhong et al. (2020) Reference 5 https://doi.org/10.1038/s41586-020-2242-8 | Sourced |
| The trend in oxygen reduction rate explained by the adsorption energies of oxygen and hydroxyl | Abstract of Nørskov et al. (2004) Reference 6 https://doi.org/10.1021/jp047349j | Sourced |
| OCx24: 572 samples of 13 elements, XRF and XRD, 441 electrodes (HER and CO2RR, up to 300 mA/cm²), 230 independent preparations and 179 targets, 19,406 materials with six adsorbates, 685 million relaxations and about 20 million DFT single points, HER (LOCO R² = 0.59, LOO 0.61), Pt near the volcano top (absent from training), σ = 0.043 V (297 replicates), 436 candidates without precious metals (282 containing Se), CO2RR LOO (H₂ 0.46, CO 0.44, liquid 0.43, ethylene 0.08) and LOCO (0.22, 0.00, 0.18, 0.01), simplifications of the simulation, expected improvement with 10,000 to 100,000 data, difficulty of synthesizing intermetallic nanoparticles | Abstract, text and Table 1 of Abed et al. (preprint) Reference 7 https://arxiv.org/abs/2411.11783 | Sourced / Not yet confirmed |
| AdsorbML: low-energy adsorption configurations searched with machine-learning potentials, lowest energy found 87.36% of the time, about 2,000 times faster, Open Catalyst Dense (about 1,000 surfaces, about 100,000 configurations) | Abstract of Lan et al. (2023) Reference 8 https://www.nature.com/articles/s41524-023-01121-5 | Sourced |
| Machine-learning potentials for catalysts focused on specific chemistries and compositions interpolate but find it hard to generalize across chemical space | Abstract of Kolluru et al. (2022) Reference 9 https://arxiv.org/abs/2206.02005 | Sourced |
| OC25: the largest dataset for solid-liquid interfaces. CO dimerization on Cu surfaces computed in cells of over 800 atoms with enhanced sampling up to 7 ns | Abstract of Sahoo et al. (arXiv) Reference 10 https://arxiv.org/abs/2509.17862 | Sourced |
| UMA: a universal atomic model trained on about half a billion 3-D atomic structures; one model for molecules, materials and catalysts | Abstract of Wood et al. (arXiv) Reference 11 https://arxiv.org/abs/2506.23971 | Sourced |
| The Open Catalyst Project is a joint effort of Meta FAIR and Carnegie Mellon University, aiming to use AI to model and discover catalysts for renewable-energy storage | The official site Reference 12 https://opencatalystproject.org/ | Sourced |
| The fairchem code is under the MIT license, model licenses vary by use, UMA requires an application and login on Hugging Face. Task names oc20 (catalysis), oc22 (oxide catalysis), oc25 (electrocatalysis) | README of fairchem (checked 22 October 2026) Reference 13 https://github.com/facebookresearch/fairchem | Sourced |
| Catalysis-Hub.org: more than 100,000 adsorption and reaction energies, calculation conditions recorded | Abstract of Winther et al. (2019) Reference 14 https://doi.org/10.1038/s41597-019-0081-y | Sourced |
| 18 HER and 26 OER electrocatalysts compared by a standard protocol: overpotential for 10 mA/cm² (per geometric area), 2-hour stability, ECSA | Abstract of McCrory et al. (2015) Reference 15 https://doi.org/10.1021/ja510442p | Sourced |
| Literature data (OCM, WGS, CO oxidation): input of elemental features, XGBoost best, top 20 candidates for OCM. Little compositional overlap, bias from past reports, low sample counts | Abstract of Suzuki et al. (2019) Reference 16 https://doi.org/10.1002/cctc.201900971 | Sourced |
| High-throughput experiments and catalyst informatics for OCM, machine learning of OCM reaction conditions, a review of catalysis informatics (title level) | Titles and bibliographic data of Nguyen et al., Ohyama et al. and Toyao et al. Reference 17 https://doi.org/10.1021/acscatal.9b04293 Reference 18 https://doi.org/10.1002/cctc.201900843 Reference 19 https://doi.org/10.1021/acscatal.9b04186 | Sourced |
| Photocatalyst search by a mobile robot: eight days, 688 experiments, ten variables, batched Bayesian search, six times the activity of the initial formulations | Abstract of Burger et al. (2020) Reference 20 https://doi.org/10.1038/s41586-020-2442-2 | Sourced |
| A paper known as one of the origins of the d-band model (title and bibliographic data) | Bibliographic data of Hammer and Nørskov (1995) Reference 21 https://doi.org/10.1038/376238a0 | Sourced |
| Title and bibliographic data of the FAIR principles (Wilkinson et al., 2016) | Bibliographic data of the paper Reference 22 https://doi.org/10.1038/sdata.2016.18 | Sourced |
| The toy volcano model (barriers = 0.9 + 0.5E and 0.2 + max(0, −E), 500 K, apex at E ≈ −0.47 eV, slopes of about 10 and about 5 orders of magnitude per eV on the two sides). The error factor exp(ΔE/kT) (300 K: 6.9 times for 0.05 eV, 48 times for 0.1 eV, about 2,300 times for 0.2 eV, about 250 million times for 0.5 eV; 600 K: 2.6, 6.9, 48 and about 16,000 times). Ratios of single points (264,890,000 / 1,281,040 ≈ 207; 685 million / 20 million ≈ 34), and 100% − 87.36% | Our calculation (a toy model and Arrhenius-type formulas). Not values for a real catalyst | Our calculation |
| The latest Open Catalyst accuracy, the terms of use of each dataset, an international standard specific to MI for catalysts, reports confirmed through rung 5 (independent verification, scale-up), and experimental confirmation of long-term stability | Could not be confirmed in the primary sources accessible within the scope of this survey, so they are not stated | Commentary |
| The readings that "scaling relations let one or two adsorption energies express a trend", "successes are more likely to be published", "that LOO does well while LOCO does not is a problem of extrapolation", "the error of one method is often shared among the catalysts compared, so a ranking is more accurate than an absolute value" and "the catalyst literature records few failures", and the arrangement of what to leave to AI and what experts decide | This article's arrangement and commentary based on published content. Not views stated by any institution | Commentary |
| That Figs. 2 to 7 and 9 are explanatory drawings, not real observations, and that Figs. 1 and 8 are ImageGen-generated conceptual illustrations | Note by this article | Commentary |
Last updated 22 October 2026. Sources are limited to primary material (peer-reviewed papers, arXiv papers, and the official pages of the Open Catalyst Project and fairchem). The Open Catalyst accuracy figures are baselines from 2020. The calculation examples are from our toy model and formulas and do not show the performance of any real catalyst. The latest accuracy, the terms of use of each dataset, an international standard specific to MI for catalysts, reports confirmed through independent verification or scale-up, and experimental confirmation of long-term stability could not be confirmed and are not stated here. All figures are explanatory concept graphics or drawings that include our calculations. Figs. 1 and 8 are ImageGen-generated conceptual illustrations, and none of them shows a real instrument or measurement result.