TECHNOLOGY EXPLAINER
How to Read Evaluation and Reproducibility in Materials Informatics
- Labels, splits, metrics and reproduction behind every "score" and "discovery", read with materials-specific examples
Papers and talks on materials informatics (MI) are full of phrases such as "an error of X eV", "first on the leaderboard" and "AI discovered X thousand new materials". But such numbers mean very different things depending on what was used as the answer (measurement or calculation), how the data were split and which metric was used. And even the word "discovery" spans a wide range, from a candidate nominated by calculation to a material actually made and confirmed to be new. This article assumes a materials engineer who has never used machine learning. It reads MI evaluation through four questions: labels, splits, metrics and reproduction. Within what papers and official sources state, it neutrally sets out shared yardsticks such as Matbench, Matbench Discovery and JARVIS-Leaderboard, examples in which small errors still give wrong decisions, and the criticism and corrections around "AI discovered".
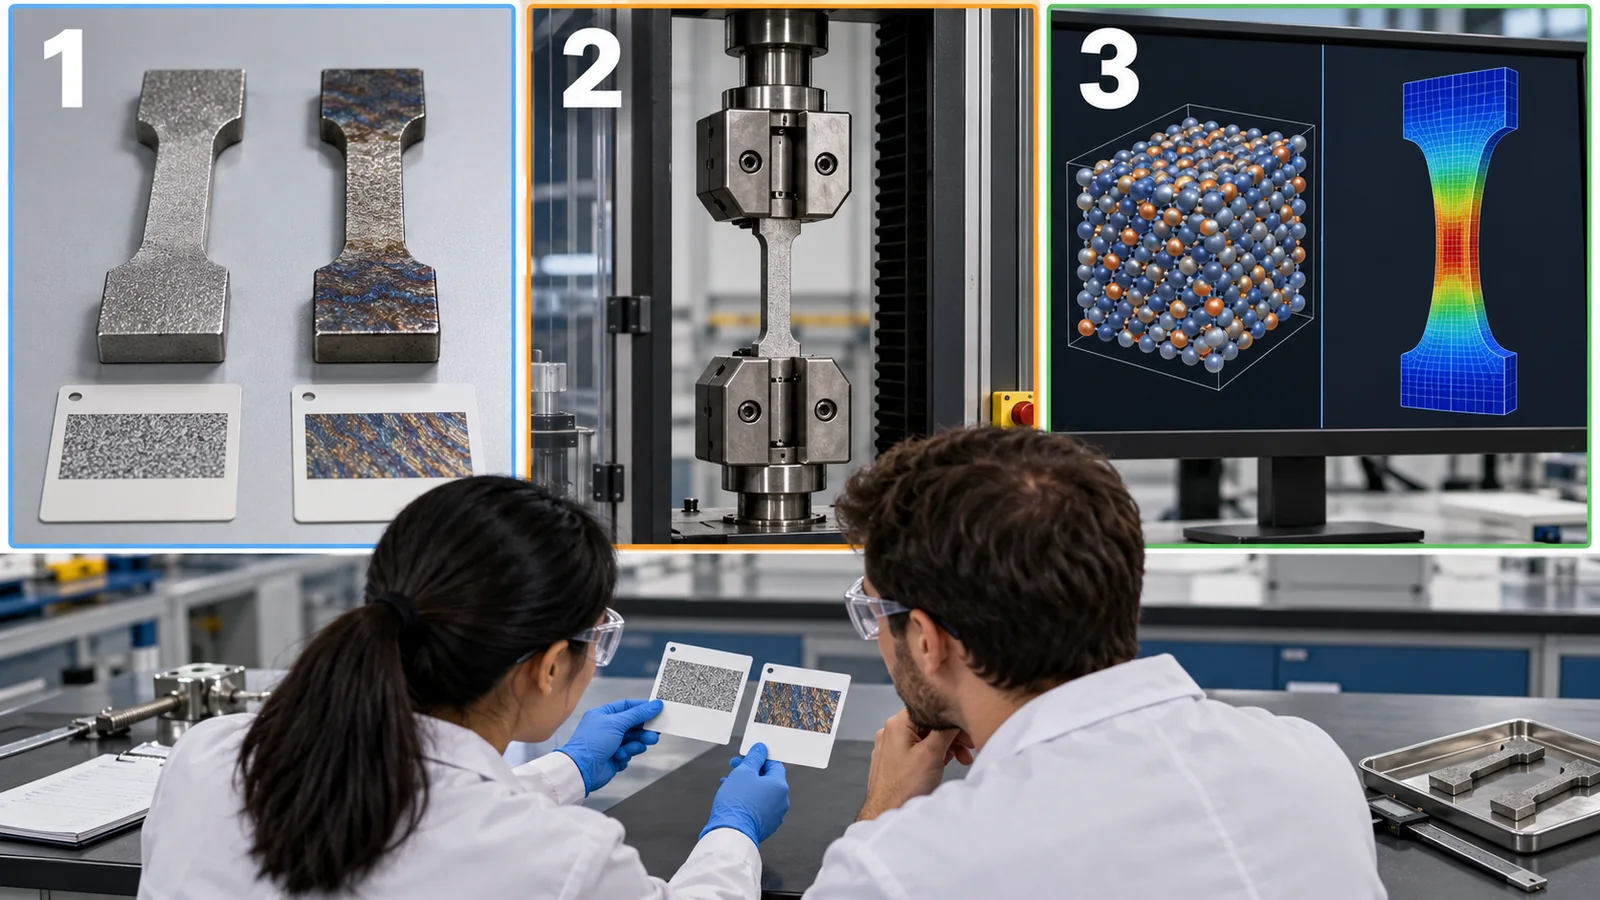
- The short version / before you start / where this fits in the series
- Four places where MI evaluation goes wrong
- Shared yardsticks: Matbench, Matbench Discovery, JARVIS-Leaderboard
- Small errors, wrong decisions: judging stability
- How test data are built: splits, leakage, distribution shift
- Reproducibility: what counts as "the same" in calculation and experiment
- Reading "AI discovered": claims, criticism and corrections
- A materials engineer's view: your own evaluation and a question list
- Limits, what we could not confirm / summary
- How to read the yardsticks and standards
- Glossary
- References (primary sources)
- Claim-to-source audit
Sourced = stated in a published source (link given)
Our calculation = a value this article computed from stated assumptions
Not yet confirmed = items under revision or still being updated, and otherwise not settled
Our own readings are marked as commentary. Inference is shown in bold. The checking date is 22 October 2026.
The numbers from papers and official pages are results for that source's data, split, metric and checking date. We do not line up numbers from different sources to rank methods or research groups. Leaderboards are updated, so we give no ranking of specific methods. The discussion on "AI discovered" sets out the claims, criticism and corrections of each paper within what has been published; we did not replicate any of it. We do not judge which side is right, and we do not blame any individual or group. The synthetic-data example (chapter 4) is a calculation on made-up data created for this article, not the performance of any real material. We do not rank companies, methods or countries, and we give no advice on investment or design.
1. The short version / before you start / where this fits in the series
- Before reading a number, check four questions: is the correct answer (label) measured or calculated, how was the test data split, does the metric fit the use, and does the same result come out again? With these four, the same "error of 0.1 eV" can be a useful number or an almost meaningless one.
- Small errors, yet wrong decisions: there is a report that machine learning predicts formation energy well but predicts stability poorly Sourced [Reference 5]. In synthetic data, even with a mean absolute error of 0.06 eV/atom, only 72.5% of the candidates called "stable" were truly stable Our calculation.
- "AI discovered" comes in levels, and there is criticism and a correction: for the autonomous laboratory A-Lab, an author correction of 19 January 2026 clarified "novel" as "new to the prediction platform" and the numbers in the abstract were updated Sourced [References 10, 11]. Another group examined the report in detail and argues that the discovery of new materials is not supported [Reference 13]. What matters is reading how far the claim goes.
Read an evaluation number together with "what was used as the answer, how the data were split and what it was measured with". And "discovery" is five different claims: predicted, synthesized, structure identified, new, and useful. Check which one is being made.
Machine learning is "an approximator that learns trends from past data". Limits of the analogy: it is weak outside the range it learned from (extrapolation), and it does not understand physical laws. In evaluation we test it on data not used for learning.
Three words used in this article first. A label is the value machine learning learns as the "correct answer". MAE (mean absolute error) is the average size of the prediction misses. Precision is "of those called a hit, the share that really were hits", and recall is "of the real hits, the share found".
Searching for materials is like "looking for treasure on a vast map", and MI is a tool for narrowing where to look. Calculation "gives candidates cheaply and fast", AI "narrows where to look", and experiment "checks whether it is true". Evaluation is the work of checking whether this narrowing is really useful.
The basics of evaluation in machine learning in general (generalization, overfitting, data leakage, extrapolation) are covered in our explainer on machine learning and neural networks and in our explainer on benchmarks and how to read evaluations (centred on language models). To avoid overlap, this article concentrates on what is specific to materials: DFT values becoming the labels, judging crystal stability, reproducibility between calculation codes, and confirming synthesis and structure identification. Concrete examples for alloys and electronic materials are in our explainers on applications to alloys and structural materials and on applications to semiconductor and electronic materials; databases are in our explainer on materials databases and the FAIR principles; autonomous laboratories are in our explainer on self-driving laboratories.
2. Four places where MI evaluation goes wrong
Pitfalls of evaluation in machine learning in general are covered in other articles. Once the circumstances specific to materials are added, the places where things go wrong can be organized into the following four (our own organization).
- 1. What is the label: most materials data are produced by calculation such as DFT. The accuracy of matching calculated values differs from the accuracy of matching measurements (we explained this with band gaps in chapter 3 of our explainer on applications to semiconductor and electronic materials).
- 2. How was it split: there are many similar materials (the same chemical system, the same family of crystal structures), so if the data are split at random, the "siblings" of each test record remain on the training side and the numbers become optimistic (chapter 5).
- 3. Does the metric fit the purpose: the purpose of a search is a decision: "is it stable?", "hit or miss?". Even with a small error (MAE), decisions near the boundary go wrong (chapter 4).
- 4. Does the same result come out again: calculations change with code and settings. Experiments change with laboratory, instrument and sample. We need to decide what counts as "the same" (chapter 6).
A benchmark is a mechanism that fixes the same problems (data) and scoring method and compares many methods. Compared with a collection of exam questions: a high score on the collection does not guarantee that the real job can be done. We must see whether the questions resemble the real job, and whether the answers are provisional ones made by calculation. Limits of the analogy: unlike exam questions, the "answers" of a benchmark are often the results of calculation chosen by people, and the answers themselves contain error.
3. Shared yardsticks: Matbench, Matbench Discovery, JARVIS-Leaderboard
In materials MI there are shared benchmarks for comparing methods under the same conditions. We summarize the official statements of three representative ones (checked 22 October 2026). All three are community efforts, not standards.
(1) Matbench: comparing property prediction
Matbench is a shared set of problems for predicting properties of inorganic bulk materials, released by Dunn and co-workers in 2020. It has 13 tasks (from 312 to 132,752 records, from 10 data sources), predicting optical, thermal, electronic, thermodynamic, tensile and elastic properties from composition or crystal structure. All tasks are evaluated with the same 5-fold nested cross-validation Sourced [Reference 1]. The authors say that this "measure every task by one procedure" approach is easy for everyone to use, but that cross-validation split by group may be closer to real use (predicting chemical systems with no data) in some cases [Reference 1].
(2) Matbench Discovery: comparing the judgement of crystal stability
Matbench Discovery by Riebesell and co-workers is a framework that compares machine-learning energy models, used as a pre-filter ahead of first-principles calculation, on the task of searching for stable inorganic crystals Sourced [Reference 2]. The paper lists four points as design ideas.
- A realistic task (prospective data): evaluate on newly generated data from the intended search workflow. The test data are the WBM dataset (257,487 structures), made by element substitution and DFT relaxation.
- Relevant targets: use the "distance to the convex hull", an indicator of stability, rather than formation energy.
- Informative metrics: MAE, RMSE and R² alone can give misleading confidence in reliability. Look mainly at performance as decisions (classification metrics).
- Scalability: look at behaviour on large data.
The paper's evaluation uses the "discovery acceleration factor (DAF)". The DAF is the share of stable materials among the candidates picked by a model (precision) divided by the share of stable materials when picking at random (prevalence); its maximum on the test data is about 6.5 (about 33,000 stable out of 215,000 structures) [Reference 2]. The same paper points out that even accurate regression models have unexpectedly many false positives (actually unstable but called stable) when the prediction is close to the stability boundary (0 eV/atom above the hull) [Reference 2].
The official website's leaderboard (checked 22 October 2026) lists, besides discovery (judgement), tasks such as geometry optimization, phonons and molecular dynamics, and can be sorted by a combined score CPS (discovery F1 at 50%, structure RMSD at 10% and the phonon thermal-conductivity error κ SRME at 40%) Sourced [Reference 3]. The display can be switched between "full test set" and "unique prototypes only". The weights are a design choice of the site, and what to emphasize is for the user to decide (commentary). The leaderboard and the weights of the metrics may keep changing, so read the numbers as of the checking date Not yet confirmed.
(3) JARVIS-Leaderboard: comparing AI, calculation and experiment in one place
JARVIS-Leaderboard by Choudhary and co-workers is an open-source, community-run platform for comparison, built to address the lack of reproducibility checks and validation. It covers five areas: AI, electronic-structure calculations (ES), force fields (FF), quantum computation (QC) and experiments (EXP); AI takes atomic structures, microscope images, spectra and text as input. For electronic-structure calculations it varies methods, software, pseudopotentials, materials and properties and compares with experiment, and for experiments it builds benchmarks by an interlaboratory approach (several laboratories measuring the same thing). At the time of the paper there were 1,281 contributions to 274 benchmarks (152 methods, more than 8 million data points) Sourced [Reference 4].
Most Matbench tasks use public calculation data such as the Materials Project. A method at the top of a leaderboard is not necessarily at the top for your own material (your composition range, your measurement conditions). It is worth re-measuring on your own representative materials with your own split (chapter 8). Use a leaderboard as "material for narrowing candidate methods" and do not state a ranking as fact.
4. Small errors, wrong decisions: judging stability
(1) Formation energy is predicted well, stability is not
When searching for candidates for new materials, what we want to know is "can this compound exist stably?". Stability is set by competition with other phases of the same elements, and we examine "is it better to decompose into other phases?" with a diagram called the convex hull. If the distance to the hull (decomposition enthalpy ΔHd) is 0 or less the compound is judged stable, and if it is above 0, unstable.
In studies that predict the formation energy of compounds by machine learning (the energy ΔHf of making a compound from its elements), there were claims of accuracy approaching DFT. Bartel and co-workers tested the formation energies of seven machine-learning models for stability prediction on 85,014 compositions of the Materials Project. The result was that formation energy itself is predicted well, but every model that predicts from composition alone is poor at predicting stability, making them less useful than DFT for searching. In particular, in chemical spaces where stable compounds are rare, only the model using crystal structure could efficiently tell which materials are stable. The paper concludes that high accuracy in formation energy does not imply high accuracy in stability Sourced [Reference 5].
The reason is the difference of scale. According to the same paper, for Materials Project compounds ΔHf spreads widely, with a mean of -1.42 eV/atom and a mean absolute deviation of 0.95 eV/atom, whereas ΔHd gathers in a much narrower range, with a mean of 0.06 eV/atom and a mean absolute deviation of 0.12 eV/atom [Reference 5]. A prediction error of several tens of meV/atom in ΔHf looks small compared with the whole spread of ΔHf. But compared with the spread of ΔHd (0.12 eV/atom), an error of the same size is enough to cross the boundary between stable and unstable (commentary).
Suppose 1,000 candidates are judged "stable". If 725 of them are truly stable, precision is 72.5%. The other 275 are misses that would be sent to experiments or detailed calculation in the belief that they are stable. On the other hand, if there are 880 truly stable candidates in total and 725 of them were found, recall is about 82%, and the other 155 or so are missed (the example uses made-up numbers Our calculation). What costs money in a search is wasted experiments on misses (false positives). Low precision raises the cost of experiments.
(2) Checking the relation between error and decisions with synthetic data
We reproduced how small errors still give wrong decisions with synthetic data that you can check by hand.
- Data (made up): the distribution of the distance to the hull was made as a Laplace distribution matched to the report of Bartel and co-workers (mean 0.06, mean absolute deviation 0.12 eV/atom). If values of 0 eV/atom or below are "stable", about 30% are stable.
- Prediction: a Gaussian error was added to the true value. The size of the error is a mean absolute error (MAE) of 0.02 to 0.10 eV/atom.
- Decision: a prediction of 0 eV/atom or below is judged "stable", and precision and recall are calculated.
Result: with an MAE of 0.02 eV/atom, precision was 0.91 and recall 0.93. With an MAE of 0.06 eV/atom (half the spread of ΔHd), precision fell to 0.73 and recall to 0.82, and with an MAE of 0.10 eV/atom precision fell to 0.61 Our calculation. In other words, even with an apparently small error of "MAE 0.06 eV/atom", more than a quarter of the candidates called "stable" are misses.
Our calculation. Python (NumPy), 400,000 points, random seed 0. A simple assumption in which the error is added directly to the distance to the hull; these are not the results of any real model. In reality the distribution of errors is not Gaussian and is biased by chemical system (commentary).
In fact: how much an MAE matters depends on the size of the error relative to the spread of the target. An error that is small for a quantity scattered widely, like formation energy, is large for a quantity gathered in a narrow range, like the distance to the hull. Riebesell and co-workers also say that global metrics such as MAE, RMSE and R² can give misleading confidence in reliability, and recommend evaluating by performance as decisions (classification metrics) [Reference 2].
(3) Knowing the "scale" of errors: experiments disagree with one another too
A sense of scale is also useful. Kirklin and co-workers compared DFT values in the OQMD database with 1,670 experimental formation energies. The mean absolute error between DFT and experiment was 0.096 eV/atom. They also examined, for compounds with several experimental sources, the mean absolute error between experiments themselves, and found a surprisingly large disagreement of 0.082 eV/atom. The authors say that a significant fraction of the difference between DFT and experiment may be due to experimental uncertainty Sourced [Reference 6].
So the experimental values taken as the "correct answer" already contain a disagreement of about 0.08 eV/atom. There is a region in which making the error of machine learning smaller than that cannot be called "closer to measurement" (commentary). The boundary of the stability decision (the spread of the hull distance of 0.12 eV/atom) also deals with differences of the same order.
If the scatter of measurement is 0.08 eV/atom, a difference in prediction errors smaller than that is no basis for deciding "which is better". If you check the scatter of your own measurements in-house (standard deviation of repeated measurements, lot-to-lot and instrument-to-instrument differences), it becomes a guide to "the size at which a difference means something" when you evaluate prediction errors (commentary).
5. How test data are built: splits, leakage, distribution shift
The basics of splitting (random split, split by group, data leakage) were covered with small examples in our explainer on machine learning and neural networks and in our explainer on applications to alloys and structural materials. Here we organize the circumstances specific to materials and the levels of how test data are built.
(1) Many similar records: why a "random split" becomes optimistic
Meredig and co-workers pointed out, in the context of materials discovery, that conventional machine-learning metrics overestimate performance for discovery. They proposed cross-validation that holds out whole clusters of similar items (LOCO CV) and a simple nearest-neighbour method as a baseline, and showed that performance in discovery depends strongly on the problem, the way data are sampled and extrapolation Sourced [Reference 7].
(2) Performance drops when the release changes: distribution shift
Li and co-workers showed that models trained on the 2018 release of the Materials Project can show severely degraded performance on the compounds newly added in the 2021 release. The point is that an excellent benchmark score does not imply good generalization. As countermeasures they present UMAP (a way to see the relation between training and test data in feature space) and the disagreement among several models (query by committee) to find data outside the distribution, and report that adding only 1% of the test data to training greatly improved prediction accuracy Sourced [Reference 8].
How to read it: a database changes as new calculations are added. It is necessary to record "which release of the data was used for training and which for evaluation" (commentary).
(3) Data leakage: learning from outside materials science
Kapoor and Narayanan surveyed 17 fields that use machine learning in science, found that data leakage affected at least 294 papers, and classified leakage into eight types. They propose "model info sheets" for reporting, and show a case in which, after correcting the leakage, the claim that complex machine learning beats a simple classical model no longer held Sourced [Reference 14]. We did not check whether the surveyed fields include materials science, but leakage of the same types can occur in materials MI: duplicated compounds, the same chemical system, the order of preprocessing and so on (commentary).
(4) Prospective tests: coming closer to real use
Matbench Discovery places prospective testing, evaluation on "data newly generated by the real search workflow", at the centre of its design [Reference 2]. But its "answer" is the DFT distance to the convex hull, not a value confirmed stable by experiment. A prospective test is an evaluation in the world of calculation that is closer to real use, and it still has to be confirmed by experiment in the end (commentary).
Decide the split by the use. For "quality prediction of a new lot" in an existing material system, splitting by lot is probably enough. For "proposing candidates in a composition system you have never made", you need an evaluation that holds out whole composition systems. For "use on next year's data", splitting by time is closer to reality. Build your in-house evaluation set in several ways for each use, and the meaning of the numbers becomes easier to explain (commentary).
6. Reproducibility: what counts as "the same" in calculation and experiment
When we say "reproducible", the meaning differs depending on what is kept the same and what is changed. In materials MI the following three are easily mixed up, so we think of them separately (our own organization).
- The same procedure gives the same result: do the same data, code, settings and random seed give the same number? In machine-learning calculations, if the software version, data version and random seed are not recorded, you cannot reproduce it even yourself.
- Another tool gives the same result: do another calculation code or pseudopotential, another laboratory or instrument, give the same number?
- Other data give the same trend: do other samples or another set of compounds give the same accuracy? (This is the "generalization" of the previous chapter.)
(1) Reproducibility of experiments, in the words of measurement
The international vocabulary of metrology (VIM, JCGM 200:2012) defines measurement reproducibility as "measurement precision under reproducibility conditions". Reproducibility conditions are conditions that include different locations, operators and measuring systems, with replicate measurements on the same or similar objects. Repeatability is the precision when the measurement is repeated under the same conditions (repeatability conditions) Sourced [Reference 19]. ISO 5725-1:2023 is a standard that sets out the conditions and the statistical model needed to evaluate the "trueness" and "precision" of a measurement method, and ISO 5725-2:2025 gives the basic method for determining the repeatability and reproducibility of a standard measurement method [References 17, 18] (the full texts are paid, so we stay with the titles and scope).
In materials experiments, "the same person measures the same sample again on the same instrument" is repeatability, and "measuring in another laboratory, by another person, on another instrument" is reproducibility. The experimental benchmarks of JARVIS-Leaderboard are built on this idea of interlaboratory comparison [Reference 4].
(2) Reproducibility of calculation: even the same DFT changes with the code
Lejaeghere and co-workers computed the equation of state of 71 elemental crystals with 15 widely used DFT codes and 40 potentials, and compared them. The calculated values showed differences, but most recent codes and methods converged toward almost the same value, with differences comparable to experimental error Sourced [Reference 15]. This shows that "calculated by DFT" alone can still leave small differences depending on the code and potential, and that, when used properly, agreement between codes has reached the level of experimental error.
The electronic-structure area of JARVIS-Leaderboard provides a place to compare methods, software, pseudopotentials, materials and properties against experiment [Reference 4]. When reading a paper, check whether the code name and version, the functional, the pseudopotential, the cutoff and the k-points are given (commentary). That the choice of functional changes the band-gap error was seen in our explainer on applications to semiconductor and electronic materials.
(3) Reproducibility of machine learning: how it is reported
The "model info sheets" proposed by Kapoor and Narayanan are a reporting form that asks for an explanation of splits, preprocessing and duplicates for each of the eight types of data leakage [Reference 14]. In reports of materials MI, the following records, in addition, make it easier for others to check (commentary): the source and release of the data (for example the release of the Materials Project), the unit of the split, the order of preprocessing, software versions, random seeds and the number of repeats, and the definitions of the metrics.
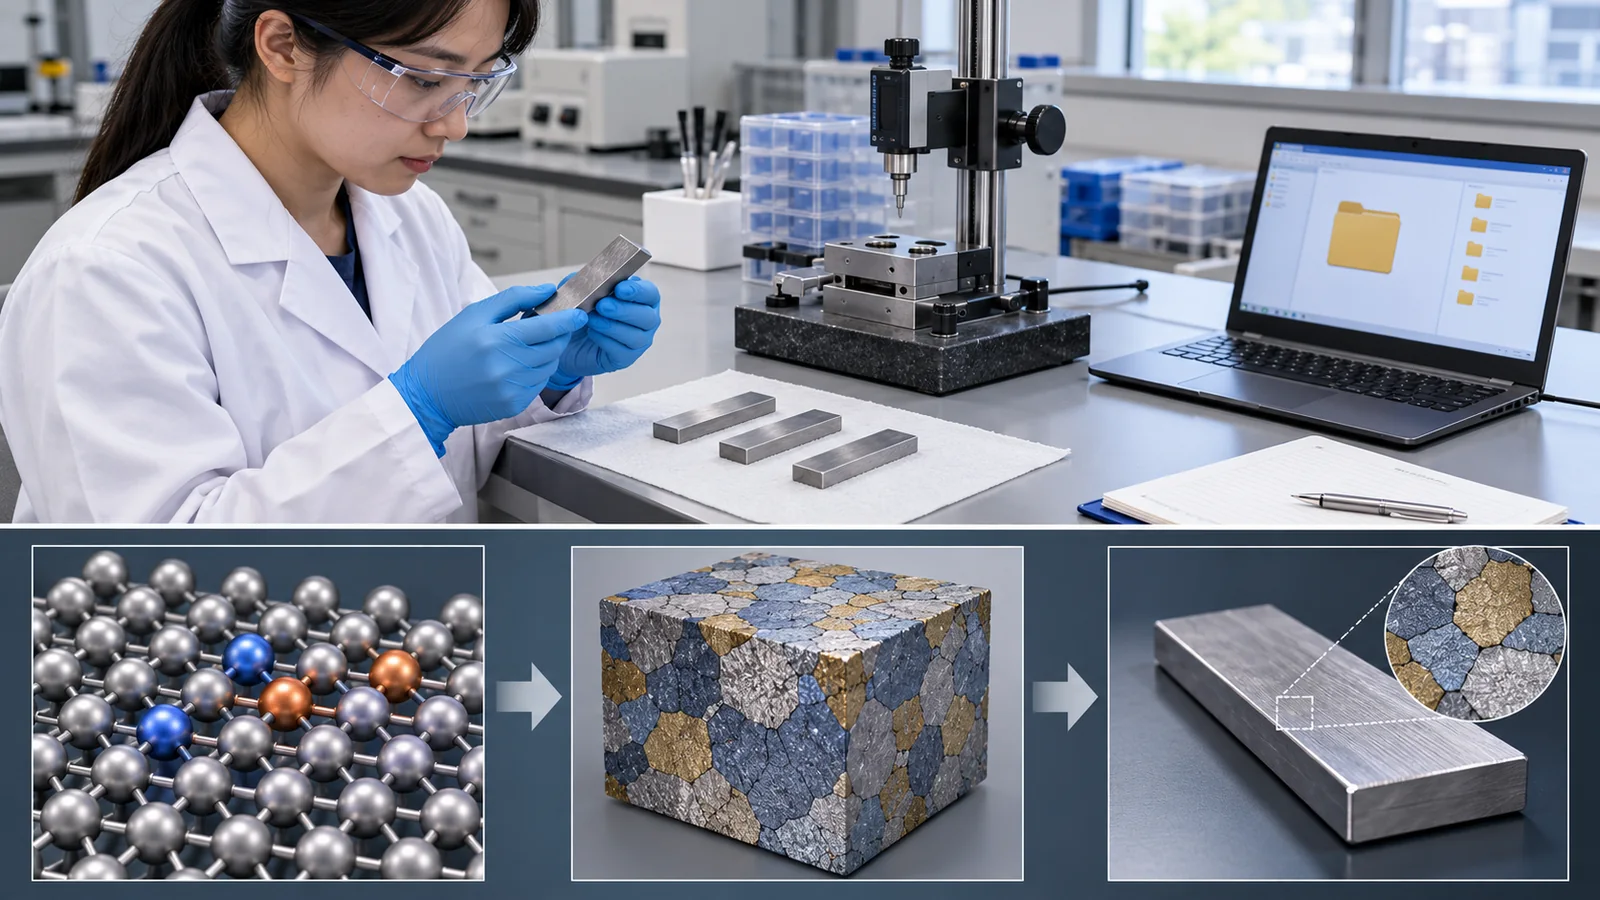
The cheapest thing that helps most in evaluating machine learning is to put the repeatability and reproducibility of your own measurements into numbers: how much does the same sample scatter when measured several times on the same instrument (repeatability), and what happens on another day, by another person, on another instrument (reproducibility)? These numbers are a guide to the lower limit of prediction error (the "scale" of chapter 4). Using the terms of ISO 5725 and the VIM makes it easier to align the meaning of numbers with other companies and outside parties [References 17 to 19].
7. Reading "AI discovered": claims, criticism and corrections
The phrase "AI discovered X thousand new materials" draws the most attention in materials MI and is also the most easily misunderstood. Here we line up, neutrally, two major published claims (GNoME and A-Lab) and the scholarly criticism and corrections that followed. We do not judge which is right and we did not replicate them. Based on the published documents, we organize "at which level the claim is made".
(1) GNoME: 2.2 million structures and 736 experimental realizations
Merchant and co-workers reported that graph neural networks trained at scale raised the efficiency of the search for stable crystals by an order of magnitude. Building on 48,000 stable crystals found in earlier studies, they state that they discovered 2.2 million structures below the current convex hull. They also say that, "of the stable structures, 736 have already been independently experimentally realized" Sourced [Reference 9]. "Stable" here is a classification based on the DFT convex hull, and the 2.2 million is a count of computed predictions. The 736 are structures that had been synthesized separately by other researchers and can be read as examples in which a prediction corresponded to a real substance (commentary).
In response, Cheetham and Seshadri examined the report from a chemistry viewpoint and wrote that "there is scant evidence for compounds that fulfil the trifecta of novelty, credibility and utility". At the same time they said the methods hold promise and that expertise in materials synthesis and crystallography needs to be incorporated Sourced [Reference 12]. We could not find a formal rebuttal of this point by the authors of GNoME.
(2) A-Lab: the success rate of an autonomous laboratory, and the meaning of "novel"
Szymanski and co-workers reported that the autonomous laboratory A-Lab for solid-state synthesis, over 17 days of continuous operation, planned experiments using computation, literature data, machine learning and active learning, and carried them out with robots. The abstract at publication said it realized "41 novel compounds from a set of 58 targets". An author correction published on 19 January 2026 acknowledges that concerns were raised about the unambiguous identification of the compound structures using diffraction and about the claims of novelty, and that the claims of novelty were subject to misinterpretation. The authors explain that the intention was "new to the prediction platform", not necessarily "new to science", and updated the text. The updated abstract says it realized "36 compounds from a set of 57 targets" Sourced [References 10, 11]. We did not check the details of why the numbers changed (an annotated PDF accompanying the correction).
Leeman and co-workers, using the 2023 report on A-Lab as an example, examined problems that can arise in unsupervised materials discovery. They examined all 43 synthesis products and argue that there are four common shortfalls in the analysis, which lead to the conclusion that "no new materials have been discovered in that work". Their main points are that automated Rietveld analysis of powder X-ray diffraction data is not yet reliable, and that while predictions put the elements on distinct crystallographic positions, in reality elements often share positions, giving higher-symmetry structures that are known alloys or solid solutions (neglect of disorder). They state that two thirds of the claimed successful materials are likely to be known compositionally disordered versions of the predicted ordered compounds Sourced [Reference 13]. This is the analysis of that paper's authors, and we did not verify it independently.
| Item | Original claim (within what was published) | Scholarly comments | Published correction / status |
|---|---|---|---|
| GNoME (Nature, 2023) | 2.2 million structures below the hull by calculation; 736 independently realized by experiment [9] | Scant evidence for compounds with novelty, credibility and utility together; the method is promising and needs synthesis and crystallography expertise [12] | We could not find a rebuttal by the authors |
| A-Lab (Nature, 2023) | At publication: 41 novel compounds from 58 targets in 17 days. Updated abstract: 36 compounds from 57 targets [10] | Examined 43 products and argue that no new materials were discovered; automated Rietveld analysis and treatment of disorder are issues [13] | Author correction of 19 January 2026: "novel" means new to the prediction platform; text updated after concerns about identification [11] |
All Sourced (statements in each paper and correction, checked 22 October 2026). The arrangement of the table is Our calculation (organization). We did not check the difference between counting "41" for A-Lab and "43" in Leeman et al.
The "2.2 million" of GNoME is a count of computed predictions, while the comment by Cheetham and Seshadri is about the novelty and utility of compounds among them. They measure different things, so both can hold. The "could be synthesized" of A-Lab and the "doubts about structure identification and novelty" of Leeman and co-workers are also, in the figure, about different levels (2 versus 3 and 4). What is certain is that criticism was published, that the authors of A-Lab issued a correction, and that "discovery" has to be read level by level (commentary).
In fact: what "discovery" contains changes greatly with which of the five levels in the figure it points to. Being predicted stable by calculation only, and being synthesized, structurally confirmed, confirmed not to be known and shown to have a use, are different claims. Read the "discovery" in an announcement by a company or research group as the claim of the side that announced it, and look for how far it goes (commentary).
In the field, it often happens that a compound that looked new turns out to be one variant of a known solid solution or disordered phase (commentary). The "neglect of disorder" pointed out by Leeman and co-workers is a familiar problem for materials engineers [Reference 13]. When you send an AI candidate to experiment, always build into the process matching against known compounds, solid solutions and alloys (a search in crystal-structure databases, phase identification of X-ray diffraction and, if needed, a check of element distribution). We do not quote the contents of paid databases such as ICSD in this article.
8. A materials engineer's view: your own evaluation and a question list
We summarize what we have covered as six questions to ask when reading a paper or a talk. The same questions can be used when you evaluate MI results in your own company (our own organization, not an official guideline).
The more a public benchmark is used, the more methods are tuned to that problem and the further scores drift from real ability (commentary). It is worth having a private evaluation set made from your own materials and your own measurement conditions. If you prepare several ways of splitting (by lot, by composition system, by period) and measure the same model with each, the meaning of the numbers becomes easier to explain (chapter 5). Keep the source, release and measurement conditions of the data with the evaluation set.
The discussion of chapter 7 shows what is indispensable in experimental confirmation. (1) Confirm that it is the intended phase by several methods (composition analysis and another measurement), not diffraction alone. (2) Match it against known compounds and solid solutions. (3) Make a control (an existing material) under the same conditions and look at the difference. (4) Look at repeats (another lot, another day) to see whether it is chance. (5) Include independent confirmation (another person, another instrument) for important results. In the terms of chapter 6, (3) and (4) correspond to repeatability and (5) to reproducibility. Decide the criteria before you see the results and do not move them afterwards (commentary).
9. Limits, what we could not confirm / summary
(1) Depth of checking of the papers
We checked the text of the papers by Dunn and co-workers, Riebesell and co-workers and Bartel and co-workers. We checked the papers by Merchant and co-workers, Szymanski and co-workers and its author correction, Cheetham and Seshadri, Leeman and co-workers, Kirklin and co-workers, Li and co-workers, Meredig and co-workers, Kapoor and Narayanan and Lejaeghere and co-workers within the abstract (or a published summary). For the JARVIS-Leaderboard paper we checked the abstract and the official page, and for the VIM the entries of the terms.
(2) The discussion on "AI discovered"
The claims of GNoME and A-Lab, the criticism of them and the author correction of A-Lab are the statements of published documents set side by side, and we did not replicate them. We could not confirm the annotated PDF accompanying the A-Lab author correction, a rebuttal by the authors of GNoME to Cheetham and Seshadri, or a rebuttal by the authors of A-Lab to Leeman and co-workers. We also did not check the difference between "41" for A-Lab and "43" in Leeman and co-workers.
(3) Changes in leaderboards and metrics
The leaderboard of Matbench Discovery and the weights of its combined score CPS are as of the checking date (22 October 2026). We give no ranking of specific models. We confirmed from the Crossref record that an Author Correction to the Matbench Discovery paper (2025) has been published, but we did not check its content.
(4) The reality of data leakage in materials
We could not confirm whether the fields surveyed by Kapoor and Narayanan include materials science. We could not find primary sources that systematically examined the frequency of leakage in materials MI.
(5) Standards and guidance
We could not find an international standard (ISO/IEC or similar) that defines the evaluation or reproducibility of materials MI. The full texts of ISO 5725 and the ISO/IEC standards are paid, so we confirmed only titles and scope.
(6) What we did not cover
Evaluation of language models (our explainer on benchmarks and how to read evaluations), evaluation of catalysts (Open Catalyst and others), individual evaluations of machine-learning interatomic potentials (our explainer on machine-learning interatomic potentials) and quantification of uncertainty (our explainer on uncertainty and applicability domain) are not covered.
- Read numbers together with four questions (label, split, metric, reproduction). The error in matching measured values and the error in matching DFT values are different things.
- Small errors still give wrong decisions. The accuracy of formation energy does not imply the accuracy of stability Sourced. In synthetic data, at an MAE of 0.06 eV/atom, the precision of candidates judged stable was 0.73 Our calculation.
- Know the scale of the yardstick. DFT differs from experiment by 0.096 eV/atom, and experiments themselves disagree by 0.082 eV/atom Sourced.
- Build test data to suit the use. Random splits tend to be optimistic, and performance can drop when the release changes. Even with a prospective test, if the answer is a calculation, confirm it by experiment in the end Sourced.
- "Discovery" is five different claims. The 2.2 million of GNoME is a computed prediction, and for A-Lab an author correction updated the meaning of "novel" and the numbers in the abstract. Read how far each claim goes Sourced.
10. How to read the yardsticks and standards
Results of materials MI are read with several yardsticks: error metrics (MAE, R² and so on), decision metrics (precision, recall, F1, the discovery acceleration factor and so on), the split, reproducibility and confirmation by experiment. Error metrics show "how far it misses on average", decision metrics "how well hit-or-miss judgements are right", the split "whether it also holds for new materials", reproducibility "whether the result is the same with another tool or at another place", and experimental confirmation "whether the material could really be made and measured". Because this article deals with evaluation itself, this chapter overlaps a great deal with earlier chapters. Here we put the benchmarks, standards and principles we could confirm into one table. We could not find an international standard specific to materials MI. The checking date is 22 October 2026.
| What is evaluated | Representative benchmark or evaluation method (name, source) | Standards and guidance (ISO/IEC, BIPM, NIST, FAIR and so on) | Cautions when reading |
|---|---|---|---|
| Error in property prediction | Matbench (13 tasks, 312 to 132,752 records, 5-fold nested cross-validation) [1] Sourced | Could not be confirmed (a standard defining how to measure prediction error) | Check whether the target is measured or calculated. Read it as a ratio to Dummy (the baseline answering the mean) |
| Judging stability | Matbench Discovery (WBM 257,487 structures, F1, DAF and others; leaderboard being updated) [2, 3] / test on stability by Bartel et al. (85,014 compositions) [5] Sourced Not yet confirmed | Could not be confirmed | The answer is the DFT distance to the hull. Watch false positives near the boundary. The weights of a combined score are a design choice |
| Comparing AI, calculation and experiment | JARVIS-Leaderboard (274 benchmarks, 1,281 contributions, 5 areas) [4] Sourced | Could not be confirmed | Splits and answers differ by task. Experiments use the idea of interlaboratory comparison |
| Splits and distribution shift | LOCO CV and the nearest-neighbour baseline (Meredig et al.) [7] / performance drop across releases (Li et al.) [8] / synthetic data of this article Sourced Our calculation | Could not be confirmed | A random split can be optimistic. Decide the split by the use |
| Data leakage and reporting | Model info sheets (Kapoor and Narayanan, 294 papers in 17 fields) [14] Sourced | ISO/IEC 5259-1:2024 (data quality for AI, Part 1: overview, terminology and examples, July 2024) [20] Sourced | The reality of leakage in materials is unconfirmed. The full text of ISO/IEC is paid and the requirements were not checked |
| Reproducibility of calculation | Comparison of DFT codes (Lejaeghere et al., 71 elements, 15 codes) [15] / DFT versus experiment (Kirklin et al.) [6] Sourced | Could not be confirmed (an international standard defining DFT procedures) | Record code, version, functional and pseudopotential. Compare the difference between values with the difference between experiments |
| Repeatability and reproducibility of experiments | Interlaboratory comparison in JARVIS-Leaderboard [4] Sourced | ISO 5725-1:2023 (trueness and precision, July 2023), ISO 5725-2:2025 (determining repeatability and reproducibility, December 2025) [17, 18] / VIM (JCGM 200:2012) [19] Sourced | Standards and terms for evaluating measurement methods. They do not decide how good an MI prediction is |
| Claims of "discovery" | GNoME, A-Lab and the criticism and corrections [9 to 13] Sourced | Could not be confirmed (a standard defining the criteria for claims of "discovery") | Read how far the claim goes among the five levels. Check whether a correction exists |
| Publishing data, AI terms and risk management | - | FAIR principles (Wilkinson et al., 2016) [16] / ISO/IEC 22989:2022 (AI concepts and terminology, July 2022) [21] / NIST AI RMF 1.0 (NIST AI 100-1, intended for voluntary use) [22] Sourced | FAIR and the NIST AI RMF are recommendations and not legally binding. ISO/IEC standards are mostly voluntary to adopt (commentary) |
The arrangement of the table is Our calculation (organization). Numbers, titles and publication dates of standards were checked on the official ISO pages (checked 22 October 2026). The full texts are paid, so we stay with the scope statements. Benchmarks and leaderboards are community efforts, not standards. ASTM standards are not covered in this article, and we did not consult the ASTM site.
Cautions when reading (for materials engineers)
- A benchmark ranking and your own material's strength are different: a leaderboard gives numbers for specific data, splits and metrics. Combined scores with different weights change the ranking if you emphasize different things. Re-measure on your own data.
- Prediction and experimental verification are different questions: even with a high score on judging stability, whether the material can be synthesized, whether the structure is right, whether it is new and whether it is useful are separate (chapter 7).
- Data leakage and the pitfall of splitting: if similar materials fall on both sides, numbers become optimistic. Performance can also drop when the release changes.
- Read standards and principles as recommended or required: FAIR is a set of principles (recommended) and the NIST AI RMF is a voluntary framework. An ISO standard is generally understood to become binding only when cited in laws or contracts (commentary). For "complies with the standard", check which requirement of which standard.
- Plans and achievements differ: leaderboards keep being updated and standards keep being revised (a new edition of ISO 5725-2 was published in December 2025). When you quote, add the edition and the checking date.
11. Glossary
- MI (materials informatics)
- Using materials data and machine learning to advance the search for and design of materials.
- Benchmark
- A mechanism that fixes the same problems, data and scoring and compares many methods.
- Label
- The value machine learning learns as the "correct answer". Whether it is measured or calculated changes its meaning.
- MAE (mean absolute error)
- The average size of the prediction misses. Same unit as the target.
- Precision / recall
- Share of real hits among those called hits / share of the real hits that were found.
- False positive
- Something called a hit that is really a miss. Leads to wasted experiments.
- F1
- The harmonic mean of precision and recall; decision performance in one number.
- DAF (discovery acceleration factor)
- The share of stable materials among the picked candidates divided by the share when picking at random.
- Formation energy (ΔHf)
- The energy of making a compound from its elements.
- Convex hull / distance to the hull (ΔHd)
- A diagram for checking whether decomposing into other phases is better / that difference. At 0 or below, judged stable.
- Cross-validation
- Splitting the data, testing the prediction, swapping and repeating.
- Nested cross-validation
- Cross-validation that separates the choice of settings from evaluation. Used by Matbench.
- LOCO CV
- Cross-validation that holds out a whole cluster of similar items.
- Distribution shift
- A difference between the distribution of the training data and of the data used in practice. A cause of lower performance.
- Prospective test
- Evaluation on data newly generated by the real search workflow.
- Data leakage
- Information that should be used only for evaluation getting into training. Inflates numbers.
- DFT
- A physical simulation that computes properties from the behaviour of electrons. Includes approximations.
- Repeatability / reproducibility
- Precision when repeated under the same conditions / precision under conditions of different place, operator and instrument.
- Interlaboratory comparison
- Several laboratories measuring the same sample and comparing results.
- Rietveld analysis
- A method that fits a crystal-structure model to a powder X-ray diffraction pattern to obtain phase fractions and structure.
- Disorder (solid solution)
- Several elements sharing the same crystal positions. Distinguished from an ordered compound.
- FAIR principles
- Principles for making data findable, accessible, interoperable and reusable.
- Model info sheets
- A reporting form asking for an explanation of splits and preprocessing for each type of data leakage.
12. References (primary sources)
- Dunn A., Wang Q., Ganose A., Dopp D., Jain A. "Benchmarking materials property prediction methods: the Matbench test set and Automatminer reference algorithm", npj Computational Materials 6, 138 (2020), DOI 10.1038/s41524-020-00406-3 (open access, full text checked) - doi.org/10.1038/s41524-020-00406-3
- Riebesell J., Goodall R. E. A., Benner P., Chiang Y. et al. "A framework to evaluate machine learning crystal stability predictions", Nature Machine Intelligence 7, 836-847 (2025), DOI 10.1038/s42256-025-01055-1 (full text checked; an Author Correction exists in the same journal, DOI 10.1038/s42256-025-01117-4) - doi.org/10.1038/s42256-025-01055-1
- Matbench Discovery official website (leaderboard and metrics, checked 22 October 2026) - matbench-discovery.materialsproject.org
- Choudhary K., Wines D., Li K., Garrity K. F. et al. (37 authors) "JARVIS-Leaderboard: a large scale benchmark of materials design methods", npj Computational Materials 10, 93 (2024), DOI 10.1038/s41524-024-01259-w (abstract checked; official page pages.nist.gov/jarvis_leaderboard) - doi.org/10.1038/s41524-024-01259-w
- Bartel C. J., Trewartha A., Wang Q., Dunn A., Jain A., Ceder G. "A critical examination of compound stability predictions from machine-learned formation energies", npj Computational Materials 6, 97 (2020), DOI 10.1038/s41524-020-00362-y (open access, full text checked) - doi.org/10.1038/s41524-020-00362-y
- Kirklin S., Saal J. E., Meredig B., Thompson A., Doak J. W., Aykol M., Rühl S., Wolverton C. "The Open Quantum Materials Database (OQMD): assessing the accuracy of DFT formation energies", npj Computational Materials 1, 15010 (2015), DOI 10.1038/npjcompumats.2015.10 (abstract checked) - doi.org/10.1038/npjcompumats.2015.10
- Meredig B., Antono E., Church C. et al. "Can machine learning identify the next high-temperature superconductor? Examining extrapolation performance for materials discovery", Molecular Systems Design & Engineering 3, 819-825 (2018), DOI 10.1039/C8ME00012C (abstract checked) - doi.org/10.1039/C8ME00012C
- Li K., DeCost B., Choudhary K., Greenwood M., Hattrick-Simpers J. "A critical examination of robustness and generalizability of machine learning prediction of materials properties", npj Computational Materials 9, 55 (2023), DOI 10.1038/s41524-023-01012-9 (abstract checked) - doi.org/10.1038/s41524-023-01012-9
- Merchant A., Batzner S., Schoenholz S. S., Aykol M., Cheon G., Cubuk E. D. "Scaling deep learning for materials discovery", Nature 624, 80-85 (2023), DOI 10.1038/s41586-023-06735-9 (abstract checked) - doi.org/10.1038/s41586-023-06735-9
- Szymanski N. J., Rendy B., Fei Y. et al. (16 authors) "An autonomous laboratory for the accelerated synthesis of inorganic materials", Nature 624, 86-91 (2023), DOI 10.1038/s41586-023-06734-w (abstract at publication and updated abstract after the correction checked) - doi.org/10.1038/s41586-023-06734-w
- Szymanski N. J. et al. "Author Correction: An autonomous laboratory for the accelerated synthesis of inorganic materials", Nature 650, E1 (19 January 2026), DOI 10.1038/s41586-025-09992-y - doi.org/10.1038/s41586-025-09992-y
- Cheetham A. K., Seshadri R. "Artificial Intelligence Driving Materials Discovery? Perspective on the Article: Scaling Deep Learning for Materials Discovery", Chemistry of Materials 36, 3490-3495 (2024), DOI 10.1021/acs.chemmater.4c00643 (abstract checked) - doi.org/10.1021/acs.chemmater.4c00643
- Leeman J., Liu Y., Stiles J., Lee S. B., Bhatt P., Schoop L. M., Palgrave R. G. "Challenges in High-Throughput Inorganic Materials Prediction and Autonomous Synthesis", PRX Energy 3, 011002 (2024), DOI 10.1103/PRXEnergy.3.011002 (abstract checked) - doi.org/10.1103/prxenergy.3.011002
- Kapoor S., Narayanan A. "Leakage and the reproducibility crisis in machine-learning-based science", Patterns 4, 100804 (2023), DOI 10.1016/j.patter.2023.100804 (open access, abstract checked) - doi.org/10.1016/j.patter.2023.100804
- Lejaeghere K. et al. (69 authors) "Reproducibility in density functional theory calculations of solids", Science 351, aad3000 (2016), DOI 10.1126/science.aad3000 (summary text checked) - doi.org/10.1126/science.aad3000
- Wilkinson M. D. et al. "The FAIR Guiding Principles for scientific data management and stewardship", Scientific Data 3, 160018 (2016), DOI 10.1038/sdata.2016.18 - doi.org/10.1038/sdata.2016.18
- ISO "ISO 5725-1:2023 Accuracy (trueness and precision) of measurement methods and results - Part 1: General principles and definitions" (ISO page) - iso.org/standard/69418.html
- ISO "ISO 5725-2:2025 Accuracy (trueness and precision) of measurement methods and results - Part 2: Basic method for the determination of repeatability and reproducibility of a standard measurement method" (ISO page) - iso.org/standard/90054.html
- JCGM "JCGM 200:2012 International vocabulary of metrology - Basic and general concepts and associated terms (VIM)" (BIPM page; entries 2.21, 2.24 and 2.25 checked) - doi.org/10.59161/JCGM200-2012
- ISO/IEC "ISO/IEC 5259-1:2024 Artificial intelligence - Data quality for analytics and machine learning (ML) - Part 1: Overview, terminology, and examples" (ISO page) - iso.org/standard/81088.html
- ISO/IEC "ISO/IEC 22989:2022 Information technology - Artificial intelligence - Artificial intelligence concepts and terminology" (ISO page) - iso.org/standard/74296.html
- NIST "Artificial Intelligence Risk Management Framework (AI RMF 1.0)", NIST AI 100-1, January 2023, DOI 10.6028/NIST.AI.100-1 (statement that it is intended for voluntary use checked) - doi.org/10.6028/NIST.AI.100-1
13. Claim-to-source audit
| Claim in the text | Basis | Label |
|---|---|---|
| Matbench has 13 tasks (312 to 132,752 records, 10 data sources) and evaluates all tasks with 5-fold nested cross-validation; the authors' view that cross-validation by group may be closer to real use | Text of Dunn et al. (2020) Reference 1 https://doi.org/10.1038/s41524-020-00406-3 | Sourced |
| The design of Matbench Discovery (realistic tasks, relevant targets, informative metrics, scalability), WBM with 257,487 structures, the definition of DAF and its maximum of about 6.5 (about 33,000/215,000), the mismatch between regression and decision metrics, the asymmetry of false positives | Abstract and text of Riebesell et al. (2025) Reference 2 https://doi.org/10.1038/s42256-025-01055-1 | Sourced |
| The leaderboard of Matbench Discovery lists several tasks, and the CPS is a combination of discovery F1 (50%), structure RMSD (10%) and phonon κ SRME (40%); the choice between "full test set" and "unique prototypes only" | Official website (checked 22 October 2026) Reference 3 https://matbench-discovery.materialsproject.org/ | Sourced |
| JARVIS-Leaderboard covers AI, ES, FF, QC and EXP, builds experimental benchmarks by interlaboratory comparison, and has 274 benchmarks, 1,281 contributions, 152 methods and more than 8 million data points | Abstract of Choudhary et al. (2024) Reference 4 https://doi.org/10.1038/s41524-024-01259-w | Sourced |
| Seven models tested on 85,014 compositions: formation energy is predicted well but composition-only models are poor at predicting stability; ΔHf of -1.42 ± 0.95 eV/atom and ΔHd of 0.06 ± 0.12 eV/atom | Abstract and text of Bartel et al. (2020) Reference 5 https://doi.org/10.1038/s41524-020-00362-y | Sourced |
| MAE of 0.096 eV/atom between OQMD DFT and 1,670 experimental formation energies, and 0.082 eV/atom between experiments themselves | Abstract of Kirklin et al. (2015) Reference 6 https://doi.org/10.1038/npjcompumats.2015.10 | Sourced |
| Conventional machine-learning metrics overestimate performance for materials discovery; LOCO CV and the nearest-neighbour benchmark were introduced | Abstract of Meredig et al. (2018) Reference 7 https://doi.org/10.1039/C8ME00012C | Sourced |
| Models trained on Materials Project 2018 can degrade severely on new compounds of the 2021 release; UMAP and query by committee; improvement from adding 1% | Abstract of Li et al. (2023) Reference 8 https://doi.org/10.1038/s41524-023-01012-9 | Sourced |
| GNoME: 2.2 million structures below the current convex hull on top of 48,000 stable crystals; 736 independently realized by experiment | Abstract of Merchant et al. (2023) Reference 9 https://doi.org/10.1038/s41586-023-06735-9 | Sourced |
| A-Lab: at publication "41 novel compounds from 58 targets"; the updated abstract "36 compounds from 57 targets"; 17 days of operation | Abstract of Szymanski et al. (2023), publication version and updated version Reference 10 https://doi.org/10.1038/s41586-023-06734-w | Sourced |
| Author correction of 19 January 2026: concerns about identification and novelty, "novel" meaning new to the prediction platform, text updated | Nature 650, E1 Reference 11 https://doi.org/10.1038/s41586-025-09992-y | Sourced |
| Comment on GNoME: scant evidence for compounds with novelty, credibility and utility together; the method is promising and needs expertise | Abstract of Cheetham and Seshadri (2024) Reference 12 https://doi.org/10.1021/acs.chemmater.4c00643 | Sourced |
| Examination of A-Lab: 43 products, four common shortfalls, the conclusion that no new materials were discovered, two thirds possibly known disordered versions, issues of Rietveld analysis and disorder | Abstract of Leeman et al. (2024) Reference 13 https://doi.org/10.1103/prxenergy.3.011002 | Sourced |
| Data leakage affected at least 294 papers in 17 fields, eight types of leakage, model info sheets | Abstract of Kapoor and Narayanan (2023) Reference 14 https://doi.org/10.1016/j.patter.2023.100804 | Sourced |
| 71 elemental crystals, 15 DFT codes and 40 potentials compared; most recent codes converged with differences comparable to experimental error | Summary text of Lejaeghere et al. (2016) Reference 15 https://doi.org/10.1126/science.aad3000 | Sourced |
| The FAIR principles are a concise and measurable set of principles for improving the reusability of data | Abstract of Wilkinson et al. (2016) Reference 16 https://doi.org/10.1038/sdata.2016.18 | Sourced |
| Numbers, titles and scope of ISO 5725-1:2023 (July 2023) and ISO 5725-2:2025 (December 2025; the 2019 edition withdrawn) | ISO pages (checked 22 October 2026) Reference 17 https://www.iso.org/standard/69418.html Reference 18 https://www.iso.org/standard/90054.html | Sourced |
| VIM terms: 2.21 measurement repeatability, 2.24 reproducibility condition (different locations, operators, measuring systems), 2.25 measurement reproducibility | JCGM 200:2012 Reference 19 https://doi.org/10.59161/JCGM200-2012 | Sourced |
| Numbers, titles and publication dates of ISO/IEC 5259-1:2024 (July 2024) and ISO/IEC 22989:2022 (July 2022) | ISO pages Reference 20 https://www.iso.org/standard/81088.html Reference 21 https://www.iso.org/standard/74296.html | Sourced |
| That NIST AI RMF 1.0 (NIST AI 100-1) is intended for voluntary use | Text of NIST AI 100-1 Reference 22 https://doi.org/10.6028/NIST.AI.100-1 | Sourced |
| Synthetic-data results (precision 0.91 to 0.61 and recall 0.93 to 0.76 for MAE of 0.02 to 0.10 eV/atom; precision 0.725 and recall 0.823 at MAE 0.06) and the examples explaining precision and recall (725/1,000, 725/880) | Our calculation (Python and NumPy; 400,000 synthetic points from a Laplace distribution, random seed 0). Not the performance of real materials | Our calculation |
| The content of the Author Correction to the Matbench Discovery paper, the annotated PDF accompanying the A-Lab correction, rebuttals by the authors of GNoME and A-Lab, the difference between "41" and "43" for A-Lab, the reality of data leakage in materials, and an international standard specific to evaluating materials MI could not be confirmed and are not stated | Not found in the primary sources we could reach in this survey | Commentary |
| The organizations "four questions", "four levels of split", "five meanings of discovery" and "six questions", the materials engineer's views, and the reading that "both documents can be right at the same time" | Our own organization and commentary based on published content; not views stated by the institutions concerned | Commentary |
| That figures 2 to 6, 8 and 9 are explanatory drawings or plots of published numbers, not observations of real data, and that figures 1 and 7 are frames for AI-generated images | Note by this article | Commentary |
Last updated: 22 October 2026 / Sources are limited to primary ones (peer-reviewed papers, arXiv preprints, official websites, and official ISO, BIPM and NIST materials). The full texts of ISO standards are paid and were not checked. The synthetic-data example is a calculation on data made up for this article, not the performance of real materials. The discussion on "AI discovered" sets out the statements of published documents neutrally, and we did not replicate it. The content of some corrections and rebuttals, the reality of data leakage in materials, and a standard specific to evaluating materials MI could not be confirmed and are therefore not stated. The figures are explanatory concept diagrams, drawings that include our own calculation, or plots of published numbers; Figs. 1 and 7 are ImageGen-generated conceptual illustrations.