

Key Findings
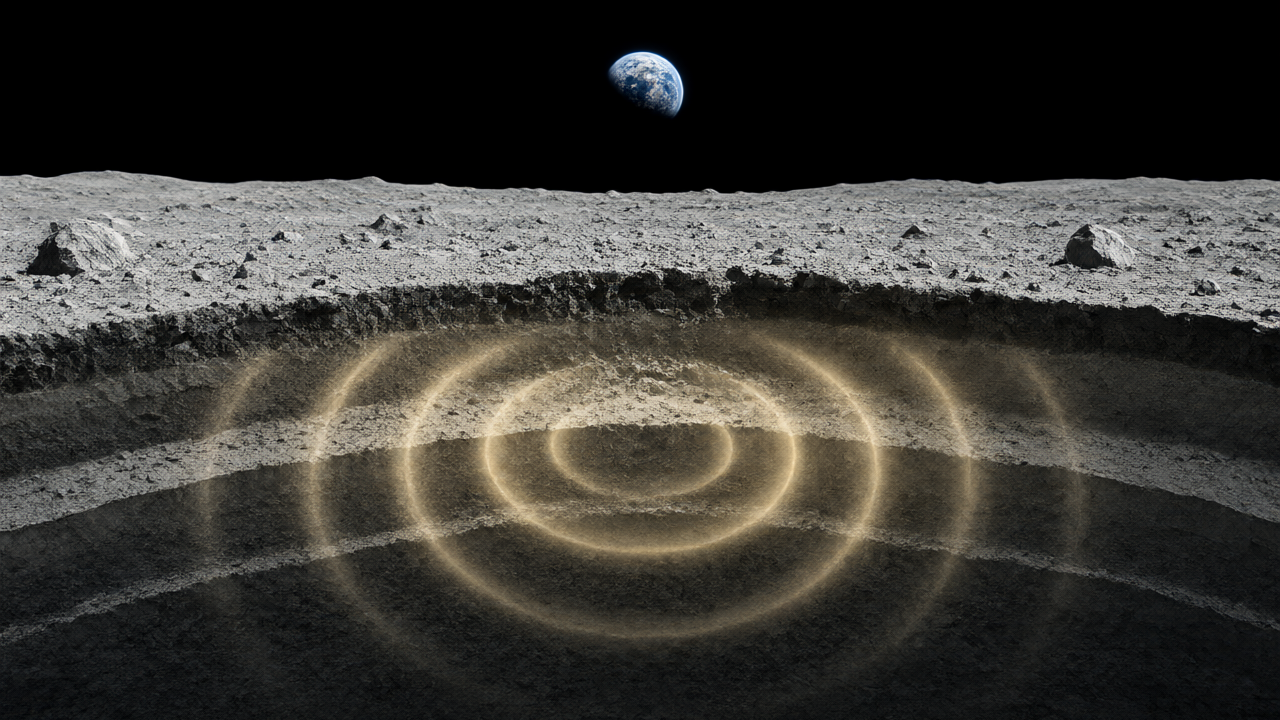
The analysis of Apollo 16 active seismic experiment (ASE) data reveals 2D mechanical heterogeneity in the shallow lunar subsurface. By processing data from 19 thumper shots and three geophones, researchers were able to generate 27 Rayleigh-wave phase-velocity dispersion curves distributed along a 90 m-long profile, allowing for spatially localized estimates of the lunar subsurface structure.
Technical Details
The study utilized different datasets for 1D and 2D analysis. The Apollo 14 dataset was used to obtain a 1D \(V_{s}\) profile for comparison, while the Apollo 16 dataset was used for 2D resolution. The Apollo 16 experiment, conducted on 21 April 1972, featured geophones G1, G2, and G3 positioned at 0, 45.7, and 91.4 m along the profile.
To overcome the limitation of having only three geophones, the team constructed receiver gathers by treating multiple shot locations as spatial samples. Due to source-receiver reciprocity, these receiver gathers were analyzed similarly to conventional shot gathers. The researchers implemented the following technical processes:
- Seismic Interferometry: Used to retrieve an approximate impulsive response and mitigate the effects of long-duration source wavelets.
- Cross Coherence: Applied to reduce sensitivity to absolute amplitude variations and localized distortion caused by amplitude saturation near shot locations.
- CWT-MASW: Continuous Wavelet Transform-based Multichannel Analysis of Surface Waves was used to estimate phase velocity from dispersive wave packets in the time-frequency domain (5–22 Hz), reducing noise interference.
- Moving Windows: Each receiver gather was divided into windows of six adjacent traces to balance depth sensitivity (approximately 10 m) and lateral resolution.
Background and Context
The Apollo 16 ASE data presented challenges including high noise levels and amplitude saturation, particularly in records from shot 1 at G3 and shot 19 at G1. To address this, the researchers selected reference shots with clear signals and minimal saturation—specifically shot 2 for G3, shot 18 for G1, and shots 10, 11, and 12 for G2.
Significance and Outlook
This methodology allows for the resolution of lateral variations in the lunar subsurface that 1D profiles cannot capture. By independently inverting the 27 generated dispersion curves, the study provides a more detailed understanding of the mechanical heterogeneity of the Moon’s shallow subsurface.
Source: https://doi.org/10.21203/rs.3.rs-11391753/v1
Get our weekly technology intelligence — free
Receive an infographic that lets you judge at a glance whether each field’s analysis report is worth reading.
Subscribe Free — Weekly Tech Intelligence
By subscribing, you’ll receive Troy-Technical’s weekly technology intelligence newsletter.
- Your email and selected fields are used only to deliver the newsletter.
- We never share your information with third parties.
- You can unsubscribe anytime via the link in each email.
See our Privacy Policy for details.
Takes about a minute · Unsubscribe anytime